ISSN 1517-7076 artigo e-11888, 2017
Autor Responsável: Ricardo Fischer Brandenburg Data de envio: 07/01/2016 Data de aceite: 14/08/2017
10.1590/S1517-707620170004.0222
Influence of mixing methods on the properties
of high density polyethylene nanocomposites
with different carbon nanoparticles
Ricardo Fischer Brandenburg1, Carlos Mauricio Lepienski2, Daniela Becker1, Luiz Antonio Ferreira Coelho1
1 State University of Santa Catarina -UDESC 2 Federal University of Parana – UFPR
e-mail:coelholaf@gmail.com
ABSTRACT
In this paper, nanocomposites with multiwalled carbon nanotubes (MWCNT) or graphene nanosheets were prepared using a high density polyethylene (HDPE) matrix. Two different processes were employed: a solu-tion method and a melt mixing method. The crystallinity index of the HDPE showed similar levels in nano-composites after the addition of carbon nanotubes. It can be seen that the preparation process modified the degree of crystallinity of the HDPE matrix with graphene nanosheets. Nanocomposites prepared by the solu-tion method showed a decrease in the crystallinity index. The addisolu-tion of carbon nanotubes led to an increase of Young´s Modulus with an increase in the MWCNT quantity, regardless of the preparation process used, with a 22.8 % increase for composites with 0.5 wt% of CNTs. The nanocomposites with graphene nanosheets exhibited a different behavior with each mixing method. Nanocomposites prepared by the solution method showed a higher Young´s Modulus than those prepared by melt mixing. Results of transmission electronic microscopy and field emission scanning electronic microscopy indicated homogeneous dispersion for carbon nanotubes in melt mixing. Graphene nanocomposites showed some agglomerates, with smaller platelets in the nanocomposites prepared by solution mixing compared to that prepared by the melt mixing.
Keywords: nanocomposites, high density polyethylene, graphene, carbon nanotube, mixing methods
_______________________________________________________________________________________ 1. INTRODUCTION
Traditional polymer composites use a dispersed phase with size on the order of micrometers. A classic exam-ple is carbon fiber and glass fiber, and the percentage added in the composites sometimes can exceed the or-der of 40% v/v [1]. The composites may exhibit regions with internal stresses and this may lead to weakness of the composite structure and the final properties provided by composites are lower than the theoretical cal-culations. Classical composites, in general, are not multifunctional. Nanocomposites emerged in the late 1980s, and showed significant changes in polymer properties [2]. The nanocomposites exhibit a dispersed phase with one or more dimensions smaller than 100nm, and are characterized by possessing high surface areas, allowing the modification of properties with lower volume fraction in the dispersed phase, compared to a traditional composite [1]. Particles in the nanosize range have large surface areas per volume, generally around 1000 times larger than in traditional composites. The surface area and aspect ratio of nanoparticles are crucial in the stress transfer from the dispersed phase to the matrix. Once dispersed in a homogeneous man-ner, they can generate a region called interphase without a region of internal stress and very often nanocom-posites are multifunctional. Once obtained the state of interphase percolation, the whole polymer matrix will be modified, and therefore it is a material with maximum performance in the use of nanoparticles [3].
in dispersing nanoparticles, but in general, large quantities of solvent compared to the mass of the nanocom-posite obtained are required [4, 5]. In addition, from the best of our knowledgement, there are a few works that had prepared nanocomposites using solution mixing techniques [6-10] with HDPE as a matrix, very probably due to time consumption of the method and the fact that organic solvents in general are employed. In our previous work [11], we observed significant differences in the nanocomposites morphology and con-sequently in mechanical and thermal properties using different mixing techniques.
Carbon nanotubes are tubular structures of carbon atoms, and have a high Young´s modulus, flexibil-ity, low densflexibil-ity, excellent thermal and electric conductivity and a high aspect ratio [12]. Mittal [5] mentioned several studies using carbon nanotubes in modifying properties of different polymeric matrixes, with in-creased Young´s modulus, thermal and electrical conductivity. Graphenes are plane and two-dimensional structures formed by carbon atoms having only one atom thick [13] and it is found in agglomerates contain-ing in general a different number of packed sheets, known as platelets. They have excellent dimensional sta-bility, thermal and electrical conductivity, flexibility and exceptional mechanical strength [8].
Several studies using carbon nanotubes (CNT) and graphene in polyethylene using different prepara-tion methods are found in the literature, but few compare the different methods and these two nanoparticles. Jeon et al. [9] studied polyethylene and single-wall carbon nanotube (SWCNT) nanocomposites made by solution dispersion, and observed a homogeneous dispersion at concentrations up to 8 wt% of SWCNT and percolation thresholds for concentrations up to 0.13 wt%. They did not observe change in the crystallization temperature. Chrissafis et al [14], obtained nanocomposites with different particles through melt mixing us-ing a torque rheometer. In nanocomposites containus-ing 2.5 wt% of carbon nanotubes, no homogeneous disper-sion of carbon nanotubes throughout the matrix was observed. The DSC results showed no change in the melt temperature and they observed an increase of 30% in the Young´s modulus in nanocomposites. Valentino et al [15] studied the dispersion of different concentrations of carbon nanotubes in HDPE by means of a torque rheometer. The results obtained by them indicate a homogeneous dispersion of CNTs in HDPE, indicating a percolation threshold for contents between 1 wt% and 2.5 wt%. He et al [8] prepare HDPE and carbon nano-tube nancomposites by solution intercalation and observed a decrease in the HDPE crystallinity degree and an increase in half-crystallization time, implying the presence of MWNTs can give rise to a decreased rate of crystallization. They related this behavior with high superficial area of CNT so that probably restrict molecu-lar motion of PE and consequently interfere with crystal growth. They could act as the nucleating agent to facilitate the crystallization of PE in the hybrids while confine the crystallization of PE. Jiang and Drzal [16] showed an increase in the crystallinity degree and in the melt temperature in nanocomposites with graphene obtained by melt intercalation. The authors related this behavior with the possibility of the graphenes act as nucleated agent. They also reported that the crystallinity degree is increased up to a certain graphene concen-tration, a small platelet distance could reduce the potential for polymer crystallization.
El Achaby and Qaiss [17] prepared nanocomposites with carbon nanotubes and graphene in a high density polyethylene matrix using a torque rheometer. The results pointed out changes in the mechanical properties using 3%wt of graphene. They observed an increase of 87% in the Young´s modulus. Also, they reported an increase of 57% in Young´s modulus with the same mass fraction of carbon nanotubes (3%). The authors associated behavior of the graphene nanocomposites with the greater particle surface area and high aspect ratio of the 2-D surface, thus increasing interaction with the polymer chains due to a high interphase area. Using solution mixing, Du et al [18], obtained nanocomposites with graphene or with carbon nanotubes. They observed an electrical percolation threshold at 0.32 wt% of carbon nanotubes and at 1.0 wt% of gra-phene. A three-dimensional conduction network in the nanocomposites with carbon nanotubes is cited in the article as being responsible for the electrical performance compared to a 2D conduction system shown by graphene. They associate this behavior to the difficulty of graphene exfoliation, and consequently inadequate distribution occurs due to the large surface area, showing great interparticle interaction originated by van der Waals forces.
2. MATERIALS AND METHODS
2.1 Materials
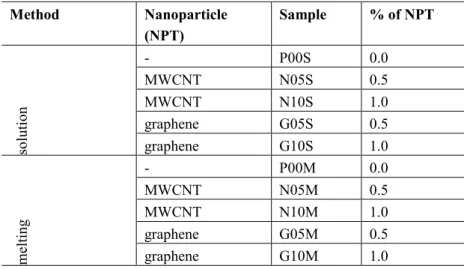
The resin used in this work was HDPE (HC760LS-L), supplied by Braskem (Mn=23,000 g/mol and MW= 68,500 g/mol). MWCNTs were supplied by Shengdu Organic Chemicals, commercially denominated as TNIM4, with purity higher than 85 %, electrical conductivity of 100 S/cm, diameters ranging from 10-30 nm and lengths from 10-30 µm. Graphene was supplied by Angstron Materials (nanosheet with 50 to 100 nm of thickness and average length was less than 5 µm) with purity higher than 98%. All experiments were per-formed using 0.5 or 1.0 wt% of carbon nanoparticles relative to the mass of HDPE, except the neat system. The nanocomposite samples prepared in this study were obtained by solution or melt mixing. The adopted nomenclature for this study is presented in Table 1.
Table 1: Nomenclature and composition of the samples.
Method Nanoparticle (NPT)
Sample % of NPT
so
lu
ti
o
n
- P00S 0.0
MWCNT N05S 0.5
MWCNT N10S 1.0
graphene G05S 0.5
graphene G10S 1.0
m
el
ti
n
g
- P00M 0.0
MWCNT N05M 0.5
MWCNT N10M 1.0
graphene G05M 0.5
graphene G10M 1.0
2.2 Sample preparation
The 10g of polyethylene was dissolved in 1000mL of 1,2 dichlorobenzene. The solution was maintained at 130°C and stirred until complete polymer dissolution. The appropriate volume of nanoparticles was added in another flask with 80mL of 1,2 diclorobenzene. This mixture was previously manually stirred, followed by sonication for 30 minutes at 150 W, using a Sonics VCX 750 sonicator device with a tip at 130°C. Before the sonication, the solution with nanoparticles was added into the polymer solution and the magnetic stirrer was used for mixing the components for ten minutes. Methanol was used as a non-solvent to separate the nano-composite. The precipitation was done at 6°C and maintained for 8h. The nanocomposite was filtered and dried under vacuum at 60°C for 48 hours. The melt mixing process was performed in a Haake torque rhe-ometer with a 50 cm3 mixing chamber and standard rotors, operated at 180°C and 50 rpm for 10 minutes. The nanocomposites were compressed and molded into a disk of 2mm thickness and 50 mm diameter using a hydraulic press at 180°C for 5 min by applying a force of 5T and cooled with water to room temperature.
2.3 Characterization techniques
The melting and crystallization temperature and crystallinity degree were obtained by differential scanning calorimetry (DSC), in a NETZSCH DSC 200 F3 device, with a heating rate of 10 °C/min, from 30°C to 300 ºC (under nitrogen atmosphere). The percent of crystallinity (Xc) was determined from the enthalpy of crys-tallization of HDPE, Equation 1, using a value of H= 293J/g for HDPE 100% [19] crystalline and the en-thalpy values were corrected for HDPE weight present in the nanocomposite.
The nanoindentation was performed on a Nanoindenter XP device using a Berkovich indenter. By applying the method of Oliver and Pharr [20], measurements of elastic modulus and nanohardness were done through sixteen indentations arranged in a 4x4 indentation matrix. Each indentation was spaced 200 μm from the previous. A maximum load of 50 mN was used, with 8 cycles of loading and unloading in each indenta-tion.
Ultrathin sections of 30nm were cut from the compression molded disks with a diamond knife at -85°C, using an RCM Power Tome X Ultramicrotome. Sections were collected on the surface of a water-dimethylsulfoxide (60/40 v/v) bath cooled at -60°C. A JEOL JEM-2100 transmission electron microscope was used for the images. The morphology was also analyzed by field emission electronic microscopy (FEG). The images were obtained by a Jeol JSM 6701F FEG and samples were fractured under liquid nitrogen.
3. RESULTS AND DISCUSSION
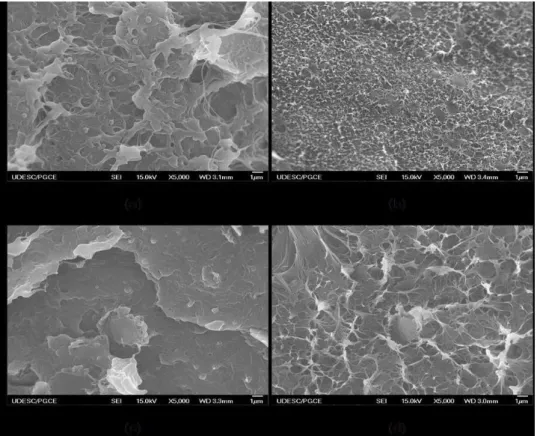
The images obtained by FEG with 0.5 wt% of nanoparticles are shown in Figure 1. It is well known from that the dispersion state can change the mechanisms of fracture toughness in nanocomposites. More agglomerates may allow the appearance of crack deflection for instance. Although, any change can be seen in the fracture morphology regardless of the dispersion method for MWCNT nanocomposite. The dispersion methods al-tered the fracture morphology for nanocomposites with graphene. In the samples prepared by the solution mixing process G05S (Figure 1 (c)), the plastic deformation is less evident than that prepared by the melt mixing process G05M (Figure 1 (d)). It can be seen in figure 1d signs of too many coarse fibrillation struc-tures which is not present in figure 1c. These fibrillation are signs of crazing in the material and this is a strong evidence of plastic deformation. El Achaby & Quais [17] also observed less plastic deformation in nanocomposites with graphene than in those with carbon nanotubes. This behavior can be related with gra-phene dispersion state in the polymeric matrix. In Figure 2, it is possible to observe the decrease of gragra-phene nanosheet size in the nanocomposites prepared by the solution method (Fig 2(b)). In Figure 2, it is possible to observe the decrease of graphene nanosheet size in the nanocomposites prepared by the solution method (Fig 2(b)).The diffusion coefficient of a nanoparticle is smaller in a media with solvent/amorphous polymer than in a media of an amorphous polymer. Stokes-Einstein equation in fact predicted this behavior in fair agreement with several studies. In our case, it was used solvent in the solution method which decreased the viscosity of the media given a higher diffusion coefficient to the nanoparticle. In this way, it is more probable to find smaller graphene nanoplateletes in this method than in melt dispersion since the viscosity of the neat polymer is much higher than the solution of solvent/polymer.
Figure 1: FEG micrographs of (a)N05S, (b) N05F, (c) G05S, (d) G05F nanocomposites.
Figure 2: FEG micrographs (a) Graphene nanosheets in HDPE obtained by melt dispersion (G10F); (b) Graphene
nanosheets in HDPE obtained by solution (G05S)
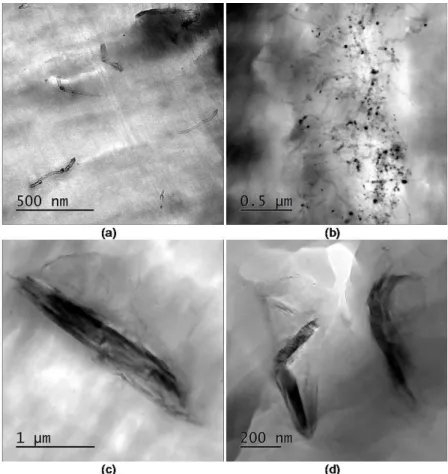
Figure 3 – TEM micrographs of N05M (a), N05S (b), G05M (c) and G05S (d) nanocomposites.
Table 2 shows melt and crystallization temperature and crystallinity index obtained by DSC and Fig-ure 4 present the DSC thermograms. It can be observed that melt and crystallization temperatFig-ure showed no significant change regardless of the nanoparticle and the preparation process. This behavior was also ob-served by different authors [14, 21-23]. The preparation methods interfere in the crystallinity index of neat HDPE (P00S and P00M). The crystallinity index of neat HDPE prepared by solution (PE00S) is 7% higher than that obtained by melting mixing. This behavior can be related with the cooling rate. The critical demix-ing temperature was located far below the meltdemix-ing curve, the resultdemix-ing crystal morphology is a sdemix-ingle, lamel-lar crystallite grows from the homogeneous solution [24]. For melting process highly oriented cylindrites or anisometric spherulites compressed in the strain direction and having their primary nuclei more or less aligned in rows parallel to the strain is formed [25]. These differences in morphology could altered the crys-tallizantion degree.
The addition of MWCNT did not significantly alter the crystallinity degree in the nanocomposites ob-tained by solution melting. For the melting process, it is possible to observe an increase of 13% for nano-composites containing 0.5 wt% carbon nanotube and 9% for nannano-composites containing 1.0 wt%. In the litera-ture, we see decreases in the crystallinity degree for high concentration of carbon nanotubes in the nanocom-posites [8,22] The influence of preparation methods can be attributed to the dispersion of carbon nanotube as seen in Figure 3(a) and (b). He et al [8] affirmed that the inorganic component could act as a nucleating agent for crystallization or the inorganic network could confine the crystallization restricting the polymer move-ment and decrease the polymer crystallization. These two mechanisms could be competitive, and usually with the increase of carbon nanotube the restriction action should be the key factor during de polymer crystalliza-tion.
Table 2 – DSC result of PE and nanocomposites for different mixing processes.
Nanocomposites Melt Temperature (ºC)
Crystallization tem-perature (°C)
Crystallinity degree (%)
N05S 135 117 67 + 2,8
N10S 135 117 66+ 4,1
G05S 133 117 61+ 0,1
G10S 134 116 50
P00M 134 114 62+ 6,1
N05M 135 119 70+ 1
N10M 136 119 68+ 3,1
G05M 134 116 63 + 7,8
G10M 134 117 55 + 1
Figure 4: DSC thermograms (a) melting (b) solution methods
The data from thermogravimetric analysis (TGA) of nanocomposites for different mixing processes are summarized in Table 3. In general, the nanocomposites obtained by both methods showed no change in thermal behavior independent of the nanoparticle added. El Achaby and Qaiss [17] observed that nanocom-posites with graphene in an exfoliated state showed an increase in thermal stability due to its higher interfa-cial area, indicating that the state of dispersion affects the thermal stability. El Achaby and Qaiss [17] using a HDPE matrix reported an increase of 24oC in the temperature at 5% mass loss in nanocomposites with 0,5% w/w of graphenes and an increase of 3oC in samples with 0,5% w/w of CNTs. Their results presented an trend of higher values in the beginning of mass loss for samples with graphenes than in samples with carbon nanotubes. They concluded that this is possible due to the higher surface area of graphenes when compared to carbon nanotubes. Finally, in their work the final temperature is equal for all nanocomposites. Although in this work it was found different results. It is possible to see that with 5% of mass loss samples N05S e N10S had reduction of 16oC and 18oC, respectively. Also, samples G05S e G10S presented reductions of 3oC and 11oC at the same 5% of mass loss. In samples prepared in the melting technique it is found higher thermal stability in mass loss compared to those prepared with the same amount of nanofillers by solution method. In samples G05M and G10M it is detected and increase of 5oC and a decrease of 11oC respectively. Both nano-fillers used in this work have high thermal conductivity, considering the number of agglomerates seen in our microscopies, this can cause thermal degradation in localized regions decreasing the thermal resistance.
(a)
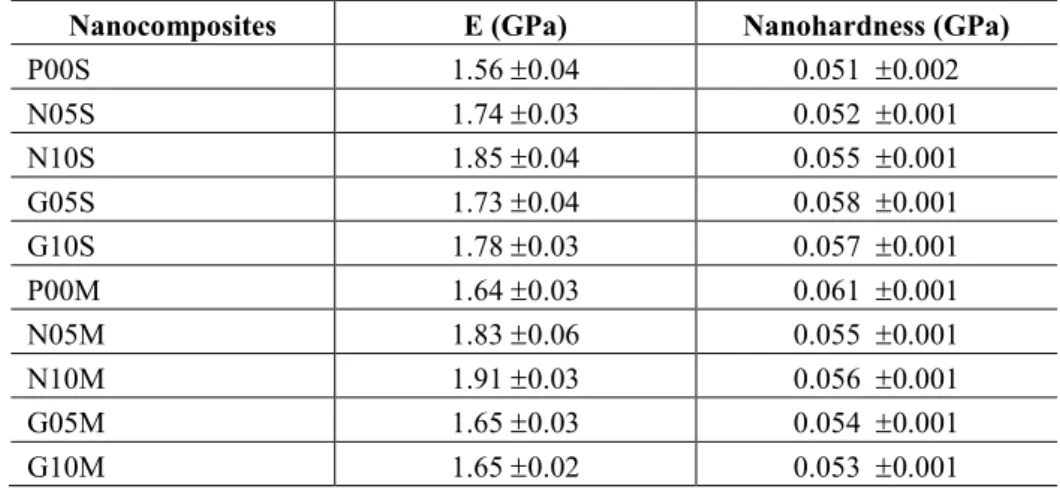
In Table 4, we see an increase in Young´s modulus with increasing mass fraction of carbon nanotubes, regardless of the process used. This behavior was also observed by different authors [14, 17, 21]. Different behavior was observed with graphene addition. For the same graphene quantity, different results were ob-tained, indicating that the preparation method influenced the Young´s modulus. Despite the reduction in the crystallinity degree of the samples obtained by solution, they have higher Young´s modulus than those ob-tained by the melting process. As shown in transmission microscopy (Figure 3 (c) and (d)), the decrease in graphene agglomerates observed in the samples obtained by solution mixing can lead to an increase in inter-facial area and consequent increase in the shear strength mechanism at the interface nanocomposites. El Ach-aby e Qaiss [17] observed that the addition of graphene has higher Young´s modulus than the use of carbon nanotubes at concentrations of 0.5wt% and 1.0wt%. The authors associated this behavior with the graphene higher surface area. In our case, the graphene nanocomposites did not present an intercalated or expholiated state and the nanocomposites with carbon nanotubes present a more homogeneous dispersion.
Table 3: Data obtained from TGA analysis of nanocomposites for different mixing processes
Nanocomposites Tonset (ºC) Tpeak (ºC)
P00S 402 493
N05S 388 487
N10S 395 490
G05S 415 494
G10S 408 492
P00M 412 494
N05M 400 492
N10M 414 495
G05M 410 489
G10M 394 490
It is well known in the literature that there three mechanims of reinforcement in nanocomposites: (1) Stress is transferred via a shear stress at the nanofiller/matrix interface, and the rate of load transfer depends on the shear stress. For instance, the higher the aspect ratio of nanofillers, the longer the length the carries the maximum load, and the higher the modulus of the nanocomposite.(2)A second mechanism to increase stiff-ness is the constraint of the polymer by nanoparticles detected by changes in the glass transition region (in-creases in this case), and (3) a localized yielding near the particles which is important at very low macroscop-ic elastmacroscop-ic strain.
In both cases, i.e. S and M (Table 4) samples, it is possible to see the reinforcement, except in M sam-ples for G05M and G10M when compared to the neat sample P00M. Very probably the increases are due to the transfer of shear stress at the nanofiller/matrix interface since employed nanoparticles have high aspect ratio, and a much higher modulus than the matrice. Unfortunately it was not possible to determine the glass transition region for our samples since our materials have high degree of crystallinity. Unfortunately in litera-ture it was not possible to find glass transition temperalitera-tures for similar nanocomposites in the literalitera-ture [26-28].
Comparing samples at the same content of nanoparticles from S and M it is not possible to see a dif-ferent level of reinforcement. It is possible to see that for low content in S and M samples, reinforcement was higher, very probably due to a better dispersion state of nanoparticles which provided more area to stress transfer.
Table 4: Nanoindentatio results of nanocomposites prepared by solution and melt mixing process
Nanocomposites E (GPa) Nanohardness (GPa)
P00S 1.56 0.04 0.051 0.002
N05S 1.74 0.03 0.052 0.001
N10S 1.85 0.04 0.055 0.001
G05S 1.73 0.04 0.058 0.001
G10S 1.78 0.03 0.057 0.001
P00M 1.64 0.03 0.061 0.001
N05M 1.83 0.06 0.055 0.001
N10M 1.91 0.03 0.056 0.001
G05M 1.65 0.03 0.054 0.001
G10M 1.65 0.02 0.053 0.001
4. CONCLUSION
The preparation process influenced the nanocomposites morphology differently, depending on the carbon nanoparticles used. Carbon nanotubes showed better dispersion in the nanocomposites prepared by melt mix-ing and graphene showed smaller agglomerates in the samples prepared by solution mixmix-ing.
In the thermal properties, the type of carbon nanoparticles had a greater influence than the preparation methods. The addition of graphene led to a decrease in the crystallinity index regardless of preparation pro-cess, whereas the addition of carbon nanotubes showed no significant change regardless of the preparation process.
For mechanical properties, the preparation method and the type of carbon nanoparticles significantly affect the results obtained. Nanocomposites with carbon nanotubes exhibited variations of properties accord-ing to the particle fraction used and no significant changes with the dispersion method used were identified. Nanocomposites with graphene obtained by the solution method had the highest Young´s modulus. The frac-tion of graphene used also affected the results, where larger fracfrac-tions represented an increase of the proper-ties.
5. ACKNOWLEDGEMENTS
The authors acknowledge the financial support from the FAPESC and CNPq.
6. BIBLIOGRAPHY
[1] HU, H., ONYEBUEKE, L., ABATAN, A. “Characterizing and Modeling Mechanical Properties of Nanocomposites- Review and Evaluation”,Journal of Minerals & Materials Characterization & Engineer-ing, v. 9, n. 4, pp. 275, 2010.
[2] AJAYAN, P.M., SCHADLER, L.S,, BRAUN, P.V. Nanocomposites Science and Technology, 1. ed. Weinheim: Wiley, 2003.
[3] TANAKA, T., KOZAKO, M., FUSE, N., et al., “Proposal of a multi-core model for polymer nanocom-posite dielectrics”,IEEE Transactions on Dielectrics and Electrical Insulation, v.12, n. 4, pp. 669, 2005. [4] MAZOV, I.N., KUZNETSOV, V.L., KRASNIKOV, D.V., et al., “Structure and Properties of Multiwall Carbon Nanotubes/Polystyrene Composites Prepared via Coagulation Precipitation Technique”, Journal of Nanotechnology, v. 2011, pp. 1, 2011.
[5] MITTAL, V. Polymer Nanotubes Nanocomposites - Synthesis, Properties and Applications. 1. ed. New Jersey. 2010.
[6] LEE, J-H., KIM, S.K., KIM, N.H. “Effects of the addition of multi-walled carbon nanotubes on the posi-tive temperature coefficient characteristics of carbon-black-filled high-density polyethylene nanocomposites”, Scripta Materialia, v. 55, n. 12, pp. 119, 2006.
[8] HE, L., XU, Q., SONG, R., et al., “Thermal and Morphological Characterization of Composites Prepared by Solution Crystallization Method of High-Density Polyethylene on Carbon Nanotubes”,Polymer Compo-sites, v. 31, n. 5, pp. 913, 2010.
[9] JEON, K., LUMATA, L., TOKUMOTO, T., et al., “Low electrical conductivity threshold and crystalline morphology of single-walled carbon nanotubes – high density polyethylene nanocomposites characterized by SEM, Raman spectroscopy and AFM”,Polymer, v. 48, n. 16, pp. 4751, 2007.
[10] DU, J., ZHAO, L., ZENG, Y., et al., “Comparison of electrical properties between multi-walled carbon nanotube and graphene nanosheet/high density polyethylene composites with a segregated network structure”, Carbon, v. 49, n. 4, pp.1094, 2011.
[11] SILVA, B.L., NACK, F.C., LEPIENSKI, C. M., et al., “Influence of Intercalation Methods in Properties
of Clay and Carbon Nanotube and High Density Polyethylene Nanocomposites”. Materials Research, v.17,
n.6 ,pp. 1628, 2014.
[12] SPITALSKY, Z., TASIS, D., PAPAGELIS, K., et al., “Carbon nanotube–polymer composites:
Chemis-try, processing, mechanical and electrical properties”, Progress in Polymer Science, v.35, n. 3, pp.357, 2010. [13] FERRARI, A. C., MEYER, JC, SCARDACI, V., et al., “Raman Spectrum of Graphene and Graphene
Layers”, Physical Review Letters, v. 97, n. 18, pp. 1, 2006.
[14] CHRISSAFIS, K., PARASKEVOPOULOS, K.M., TSIAOUSSIS, I., et al., “Comparative Study of the Effect of Different Nanoparticles on the Mechanical Properties, Permeability and Thermal Degradation Mechanism of HDPE”,Journal of Applied Polymer Science, v. 114, n. 3, pp. 1606, 2009.
[15] VALENTINO, O., SARNO, M., RAINONE, N.G., et al., “Influence of the polymer structure and nano-tube concentration on the conductivity and rheological properties of polyethylene/CNT composites”, Physi-cal E: Low-dimensional Systems and Nanostructures, v. 40, n. 7, pp. 2440, 2008.
[16] JIANG, X., DRZAL, L.T. “Multifunctional High-Density Polyethylene Nanocomposites Produced by Incorporation of Exfoliated Graphene Nanoplatelets: Crystallization, Thermal and Electrical Properties”, Polymer Composites, v.33, n. 4, pp. 636, 2012.
[17] EL ACHABY, M., QAISS, A. “Processing and properties of polyethylene reinforced by graphene nanosheets and carbon nanotubes”,Materials & Design, v. 44, pp. 81, 2013.
[18] DU, J., ZHAO, L., ZENG, Y., et al., “Comparison of electrical properties between multi-walled carbon nanotube and graphene nanosheet/high density polyethylene composites with a segregated network structure”, Carbon, v. 49, n. 4, pp. 1094, 2011.
[19] SAHEBIAN, S., ZEBARJAD, S.M., VAHDATI, K. J., et al., “The effect of nano-sized calcium car-bonate on thermodynamic parameters of HDPE”, Journal of materials processing technology, v. 209, pp. 1310, 2009.
[20] YAN, W., PUN, C.L., SIMON, G.P. “Conditions of applying Oliver-Pharr method to the nanoindenta-tion of particles in composites”,Composites Science and Technology, v. 72, pp. 1147, 2012.
[21] VEJA, J.F., et al. “Rheology, Processing, Tensile Properties, and Crystallization of Polyethylene/Carbon Nanotube Nanocomposites”,Macromolecules, v. 42, n. 13, pp. 4719, 2009.
[22] JEEVANANDA, T., et al. “Investigation of multi-walled carbon nanotube-reinforced high-density poly-ethylene/carbon black nanocomposites using electrical, DSC and positron lifetime spectroscopy techniques”, Polymer International, v. 58, n. 7, pp. 775, 2009.
[23] FIM, F.C., GUTERRE, J.M., BASSO, N.R.S., et al.,“Polyethylene/graphite nanocomposites obtained by in situ polymerization”,Journal of Polymer Science Part A: Polymer Chemistry, v. 48, n. 3, pp.692, 2010.
[24] HU, W., FRENKEL, D. “Polymer Crystallization Driven by Anisotropic Interactions”,Adv Polym Sci , v.191, pp.1, 2005.
[25] PETERLIN A. “Crystallization from a strained melt or solution”, Polymer Engineering and Science, v.16, n. 3, pp. 126, 1976.
[26] WEI, P., BAI, S. “Fabrication of a high-density polyethylene/graphene composite with high exfoliation and high mechanical performance via solid-state shear milling”, RSC Adv., v. 5, pp. 93697, 2015.
[28] KODJIE, S.L., LI, L., LI, B., et al., “Morphology and Crystallization Behavior of HDPE/CNT Nan