263 REM: R. Esc. Minas, Ouro Preto, 55(4): 263-266, out. dez. 2002
Resumo
A quantificação de goetita, magnetita, martita e especularita em minérios de ferro foi realizada através de uma combinação de análises químicas e difração de raios X. Observou-se que a intensidade do pico de difração (111) da goetita é constante para uma determinada amostra, se o mesmo porta-amostras é utilizado. Curvas de calibração com um comportamento linear foram obtidas usando-se as áreas do pico (111) e as quantidades de goetita obtidas através da espectroscopia Mössbauer e microscopia ótica. Além disso, a largura integral do pico (012) da hematita aumenta linearmente com o aumento da quantidade de martita, permitindo, assim, uma estimativa dos teores de martita e especularita.
Palavras-chave: minério de ferro, magnetita, goetita,
martita, especularita.
Abstract
The quantification of goethite, magnetite, martite and specularite in iron ores was successfully achieved by a combination of wet chemical analysis and x-ray diffraction. It was found that the intensity of the goethite (111) peak is constant for a certain sample provided that the same sample holder is used. Calibration curves with a linear behavior have been derived using the areas of the above mentioned peak and the amounts of goethite obtained by Mössbauer spectroscopy and optical microscopy. In addition, the integral width of the hematite (012) line broadens linearly as the amount of martite increases, thus allowing an estimation of the amounts of martite and specularite.
Keywords: iron ores, magnetite, goethite, martite,
specularite.
Mineração
Artigo recebido em 16/09/2002 e aprovado em 12/11/2002.
Quantitative phase analysis of iron ore
concentrates
Geraldo Magela da Costa
Chemistry Department, Universidade Federal de Ouro Preto, Ouro Preto, MG, Brazil. Email: [email protected]Valdirene Gonzaga de Resende
Chemistry Department, Universidade Federal de Ouro Preto, Ouro Preto, MG, Brazil E-mail: [email protected]REM: R. Esc. Minas, Ouro Preto, 55(4): 263-266, out. dez. 2002 264
Introduction
The quantification of the main iron oxides and hydroxides present in most iron ores still is a subject of investigation. Besides the knowledge of the amounts of goethite, magnetite and hematite in the concentrates, it is also important for many processes to know the partition of hematite into martite and specularite.
In recent years the use of optical microscopy is becoming a usual technique to access the mineralogical composition of these ores. An experienced operator is able to identify by reflected light all the above mentioned phases, with an uncertainty of roughly 5% absolute. The quantification is done by counting at least 500 particles and then converting the volumetric percentage into weight using the theoretical densities of each phase (Ferreira 1993). This technique has some disadvantages, as for example a relatively long time for the analysis, about two-three hours per sample. Furthermore, the result is somehow dependent of sample preparation, operator, stereological effects, and also of the theoretical densities used to convert the volumetric percentages, which is not exactly known for martite. Another aspect that has to be considered is that there is no other technique that can be used to cross-check the results for martite and specularite, and hence the existence of systematic errors cannot be excluded.
Another analytical technique that is well appropriated to the study of iron compounds is Mössbauer spectroscopy, which can be used to identify and quantify all iron-bearing phases (Bancroft 1973). The identification is based upon the comparison of the derived hyperfine parameters with those listed in literature for well-characterized samples, whereas the quantification is based on the relative areas obtained for each component. The main advantage of this technique over optical microscopy is that there is no need to know the densities of the involved phases. On the other hand, it usually takes between 5-12 hours to obtain the spectrum, which makes this technique not adequate for
routine purposes. Recently we have undertaken a comparative study of the results obtained by both techniques above mentioned, and the general conclusion was that there is a relatively good agreement between both methods (de Sá et al. 1999, Toríbio et al. 2001). Another important conclusion from this study was that the room temperature Mössbauer spectrum does not show any significant differences for samples containing variable proportions of martite and specularite.
X-ray diffraction (XRD) is another technique that is widely used for purposes of identification, bur rarely used for quantification because many factors such as texture, stress and crystalline size can affect the intensities of the peaks (Jenkins and Snyder 1996). The Rietveld method can be used to quantify crystalline phases, but for samples presenting texture effects the procedure is not straightforward (Rietveld 1969, Pöllmann and Angélica 2002). In addition, the structural parameters of martite and specularite are the same and hence it is not possible to distinguish these phases. In spite of these shortcomings, we have conducted a careful XRD investigation of some previous well-characterized iron-ore samples, and we have found it possible to quantify magnetite, goethite, martite and specularite by combining the results of chemical analysis and x-ray diffraction.
Experimental
The iron-ore concentrates containing different proportions of magnetite, goethite and hematite were obtained in a pilot-plant using the ROM ore. Typical chemical analysis are: Fetotal = 63-68%; FeO = 0.2 – 4.7%; SiO2 = 0.9-1.6% and Al2O3 = 0.2-0.3 %. Total and ferrous iron were determined by titration with potassium dichromate, whereas the other elements were determined by ICP.
Mössbauer spectra were obtained in a spectrometer operating at constant acceleration and with a triangular signal. The relative areas were calculated considering that both ferrous and ferric ions have the same recoil fraction.
A light-reflected microscopy (Leica, model MPS30) with a magnification of 200 times was used for the particles counting. Fractions below and above 325 # were used, and at least 500 particles of each phase were identified and counted. The volumetric percentages were converted into weight percentages using the theoretical densities of each mineral (Ferreira 1993).
Powder x-ray diffractograms were obtained in a Shimadzu XRD 6000, using a cobalt tube and iron filter. Preliminary scans were done at 2º/min in the range of 20-60º (2θ), whereas the scans used to construct the calibration curves were done at 0.5º/min in the regions of 27-29º and 40-44º (2θ). The latter measurements were repeated three times for each sample, which were mounted in an aluminum holder of about 25 mm of diameter and 1 mm of depth. Peaks were fitted with a Pearson function after subtracting the background and stripping the Ka2 pattern. The overall time, including the measurement of the raw data and computer analysis, is about fifteen minutes.
Results and
Discussion
The most reliable and sensitive method to determine the amount of magnetite is certainly the wet chemical analysis, which can be used to detect amounts as low as 0.1 %. For the calculation it is assumed that there is no other source for Fe2+, and then the percentage of magnetite is simply given by the expression:
Magnetite (%) = 3.222.FeO(%).
265 REM: R. Esc. Minas, Ouro Preto, 55(4): 263-266, out. dez. 2002 centered at 42.8º (2θ) was more or less
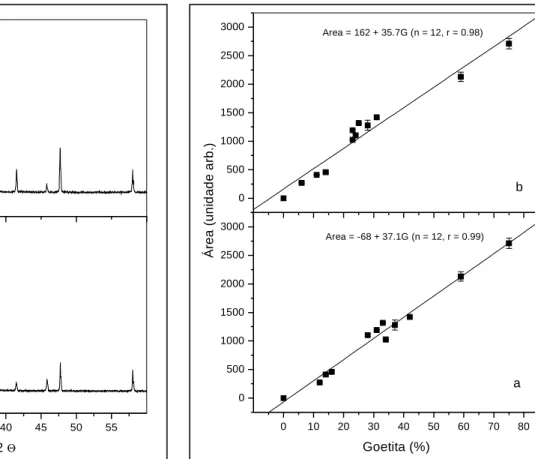
constant for a certain sample provided that the same sample holder was used. Furthermore, the intensity of this peak was found to have a clear linear correlation with the amount of goethite, as can be seen in Figure 2. These two plots were made using the integrated intensities of the peak at 42.8 degrees and the amounts of goethite as determined by Mössbauer spectroscopy (Figure 2a) and optical microscopy (Figure 2b). The differences in the amounts of goethite obtained by using the two equations given in Figure 2 is approximately 4% absolute. Thus, the amount of goethite in a unknown sample can be easily determined using one of these two plots.
Once the amounts of magnetite and goethite have been found, and if no other phases are present, the percentage of hematite can be calculated by the
equation: hematite (%) = [(Fetotal - 2.33.FeO - 0.628.G) . 1.43], where G is the percentage of goethite.
The next problem to be solved concerns the partition of hematite into martite and specularite. Taking into account that martite presents a more porous structure than specularite, and possibly more structural defects, it is possible that the presence in larger quantities of this phase could result in a broadening of the peaks. Indeed, a weak but still significant linear correlation was found to exist between the integral width
β (or full width at half maximum, FWHM) of the hematite (012) peak centered at 28.1 degrees and the amount of specularite (Figure 3). Pure specularite shows β of about 0.14º, whereas samples containing almost only martite show a line width of about 0.28º. Thus, this plot could be used to estimate the amounts of martite and specularite.
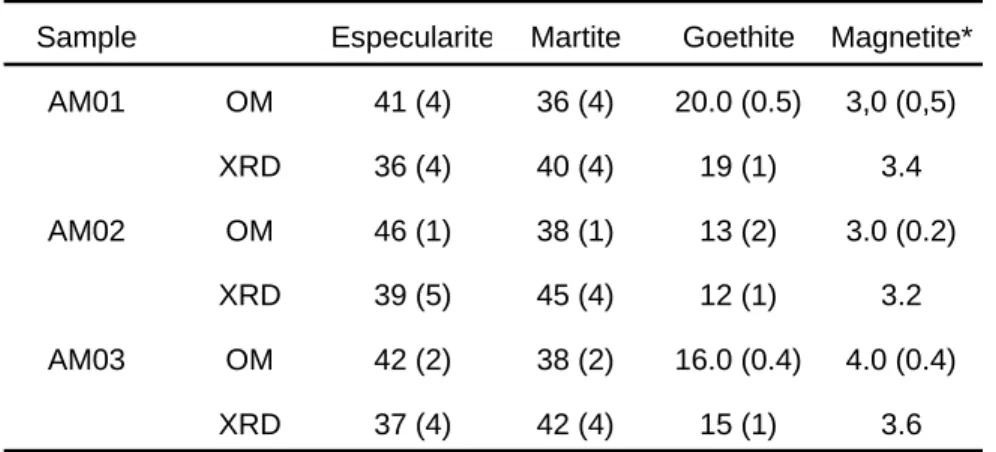
In order to access the average errors involved in the optical microscopy method we analyzed three samples which were given to three different technicians. These results, as well as those obtained by the present method (done four times for each sample) are listed in Table 1. The first observation is that for the predominant phases (martite and specularite) the differences between operators can be as large as 8% absolute (sample 1), whereas for goethite and magnetite this difference is of the order of 2% absolute. For goethite, there is a very good agreement between the amounts determined by both methods. The values for martite and specularite estimated by the xrd method are different from those obtained by optical microscopy, but can be considered to be within the experimental errors.
It is important to emphasize that all correlation’s found in this work should
Figure 1 - X-ray diffraction patterns of specularite showing
strong changes in the relative line-intensities depending on sample’s preparation.
25 30 35 40 45 50 55
0 2000 4000 6000 8000 0 2000 4000 6000
In
te
n
s
it
y
(a
rb
. u
n
it
s
)
2 Θ
In
te
n
s
it
y
(a
rb
. u
n
it
s
)
Figure 2 - Correlation between the area of the xrd peak centered
at 42.8º (Co tube) and the amount of goethite as determined by Mössbauer spectroscopy (a) and optical microscopy (b). Solid lines are the best linear fits to the data.
0 10 20 30 40 50 60 70 80
0 500 1000 1500 2000 2500 3000 0 500 1000 1500 2000 2500 3000
Area = -68 + 37.1G (n = 12, r = 0.99)
a
Á
re
a (
u
ni
da
de
ar
b
.)
Goetita (%)
Area = 162 + 35.7G (n = 12, r = 0.98)
REM: R. Esc. Minas, Ouro Preto, 55(4): 263-266, out. dez. 2002 266
not be used as calibration curves in other equipment’s because both the integrated intensities and line widths are characteristic of a particular instrument. However, once well-characterized samples are available, the calibration plots can be constructed using the above mentioned methodology.
Acknowledgments
This work was partially funded by Fapemig and CNPq.
References
BANCROFT, G.M. Mössbauer Spectroscopy:
an introduction for inorganic chemists and geochemists. John Wiley & Sons, 1973,
252 p.
DE SÁ, K.G., TORÍBIO, N.M., DA COSTA, G.M., VIEIRA, C.B. Caracterização mineralógica de minérios de ferro: um estudo comparativo. In: SIMPÓSIO BRASILEIRO DE MINÉRIO DE FERRO, 2. Anais... ABM, p.33-43, 1999. FERREIRA, C.M. Anais do Workshop em
Geologia e Estratigrafia de Minério de Ferro,
SBG Bol. n.12, p.374, 1993
JENKINS, R., SNYDER, R.L. Introduction to
X-ray Powder Diffractometry. John Wiley
& Sons, Inc., 1996. 403 p.
PÖLLMANN, U.K., ANGÉLICA, R.S. O refinamento de Rietveld como um método para o controle de qualidade de minérios de ferro. R. Esc. Minas, n.55, p.111-114, 2002.
RIETVELD, H.M. A profile refinement method for nuclear and magnetic structures.
J. Appl. Cryst. n.2, p.65-71, 1969
TORÍBIO, N.M., DA COSTA G.M., DE SÁ K.G., VIEIRA, C.B. Hyp. Interact. 134, p. 187-191, 2001.
Figure 3 - Effect of the amount of specularite on the integral width of the peak
centered at 28.1º (Co tube). Solid line is the best linear fit to the data.
0 20 40 60 80 100
0.16 0.20 0.24 0.28 0.32
β = 0.27 - 0.0014Esp ( n = 11, r = 0.86)
β (
2θ
)
Specularite (%)
Table 1 - Comparison of the amounts of iron-bearing phases as obtained by optical
microscopy (OM) and by a combination of chemical analysis and x-ray diffraction (XRD). Numbers between brackets are the standard deviations of three (OM) or four (xrd) measurements. All values in weight %.
Sample Especularite Martite Goethite Magnetite*
AM01 OM 41 (4) 36 (4) 20.0 (0.5) 3,0 (0,5)
XRD 36 (4) 40 (4) 19 (1) 3.4
AM02 OM 46 (1) 38 (1) 13 (2) 3.0 (0.2)
XRD 39 (5) 45 (4) 12 (1) 3.2
AM03 OM 42 (2) 38 (2) 16.0 (0.4) 4.0 (0.4)
XRD 37 (4) 42 (4) 15 (1) 3.6
* Results of only one chemical analysis.