Optimizing the Airport Check-In Counter Allocation Problem
Gerson E. Araujo; Hugo M. Repolho+
Pontifical Catholic University of Rio de Janeiro, Rio de Janeiro, Brazil
Article Info Abstract
Keywords: Airport Logistics
Check-in Counter Allocation Problem
Optimization Models Simulation
This paper presents a new methodology to optimize the Airport Check-in Counter Allocation Problem. The methodology combines optimization, simulation and adjacent resource scheduling and aims to determine the optimal number, location and schedule of check-in desks to open for departing flights, such that operational costs are minimized and a given service level is ensured. The methodology is composed of three steps. Step 1 uses optimization models to determine the optimal number of desks. Step 2 uses simulation to assess if the first step results meet the overall service level. Step 3 uses an optimization model to enforce the adjacent constraint. The paper focus then on Step 1, to which we present two new optimization models for common and dedicated check-in systems which include a service level constraint. Finally, these models are applied to a case study with actual data. We conclude the best time interval length should be 30 minutes or less and, as expected, the dedicated system requires, in general, more desks than the common system. Additionally, the results demonstrate the accuracy of the models to reach the trade-off between the operational costs and a given service level.
Submitted 28 Sep 2014;
received in revised form 10 Feb 2014; accepted 20 Apr 2015.
Licensed under Creative Commons CC-BY 3.0 BR.
+ Corresponding author. Pontifical Catholic University of Rio de Janeiro, R. Marquês de São Vicente, 225 - Gávea, Rio de Janeiro - RJ, 22451-900, Brazil. E-mail address: [email protected].
Introduction
This paper presents a new methodology to optimize the Airport Check-in Counter Allocation Problem (ACCAP). It determines the optimal number, location and schedule of check-in desks to open for departing flights, such that operational costs are minimized and a given service level is ensured. The methodology involves three steps. Step 1 uses optimization models to determine the optimal number of desks. Step 2 uses simulation to assess if the results of the first step meet the overall service level. Step 3 uses an optimization model to enforce the adjacent constraint. The combination of optimization, simulation and adjacent resource scheduling techniques in the same methodology is a novelty in the literature related to the ACCAP. Also, regarding Step 1, we present two new optimization models for the common and dedicated check-in systems. These models are tested by a case study with actual data in order to assess their reliability to face real applications.
The Brazilian air transport sector has been facing high growth rates over the last ten years benefiting from aviation liberation, economic development and from the organization of large international events such as 2014 FIFA Soccer World CUP and 2016 Olympic Games. Within the next years, air transportation in Brazil is expected to reach the same traffic levels as the ones existing in developed countries. Indeed, air travels are expected to go from 0.3 to 0.7 per person per year, in the medium term (MCKINSEY & COMPANY, 2010). In this context, it is crucial that airport infrastructure grows accordingly. Investments in expansion, modernization, new airports, and even efficient methods for using airport resources may be essential, if one aims to ensure adequate operational capacity and a given service level. Based on the latter option, identifying and reducing all superfluous operational processes and underuse equipment is mandatory. With this regard, the check-in counters are preponderant facilities where the embarking process starts and the passengers’ perception about the airport service level starts too. Moreover, usually check-in counters occupy a considerable area within the airport and an over dimensioning of counters is preventing the airport to allocate space to profitable activities such as retail areas. Then, efficiently using and allocating check-in counters may therefore contribute to reduce airport costs and raise the service level offered to customers. An efficient if not optimal planning of check-in capacities is therefore required at various levels.
Besides the predominantly application of simulation to face the ACCAP, it can be considered a novel problem in Operational Research literature, as few optimization approaches have been developed to deal with it. Chun and Mak (1999) introduced an Intelligent Resource Simulation System (IRSS) to predict on a daily basis how many check-in counters should be allocated to each departure flight while providing passengers with a given quality of service. A first attempt to solve a similar problem with a mathematical programming approach has been provided by Atkins et al. (2003). They presented a combined stochastic and deterministic approach to improve passenger flows and customer service at Vancouver International Airport. They used simulation to meet the service criterion (the simulation was run until the minimum staff level met the service criterion defined) and linear Programming to determine the optimal shift schedules. Yan et al. (2004) studied a deterministic scheduling problem to assign common check-in counters on a monthly basis with the objective of minimizing passengers walking distances. Based on the work of Atkins et al. (2003), Van Dijk & Van der Sluis (2006) deepen the check-in problem by proposing an integrated stochastic and deterministic approach. First, simulation was used to
determine minimal numbers of desks to meet a service level for each flight. Next, Integer Programming formulations were provided to minimize the total number of desks under the realistic constraint that desks for the same flight should be adjacent. Finally, Bruno & Genovese (2010) proposed new mathematical models for optimization the ACCAP.
In this paper, we further extend the use of optimization models to solve the ACCAP. Specifically, and based on the work of Bruno & Genovese (2010), we formulate a new optimization model to solve the common check-in system that includes a new service level constraint, and new equivalent model for the dedicated system. When tested by a real world application, the results evince the accuracy of the models to reach a trade-off between operational costs and a given service level. Therefore, the complete methodology demonstrates its reliability and accuracy to optimize the ACCAP.
This paper is structured as follows. Section 1 provides an insight on the problem terminology. Section 2 describes the ACCAP optimization methodology and the OR tools used in each step. Section 3 presents two optimization models to solve the ACCAP for common and dedicated check-in systems. Section 4 contains the case study and the results analysis. Finally, we take some conclusions about the work and identify future directions of research.
1. Terminology
We assume the following standard definitions based on the IATA-ADRM (2004):
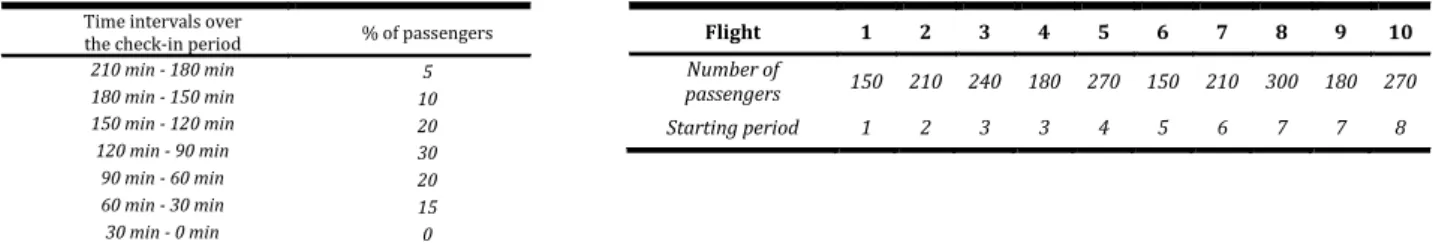
Arrival pattern: represents the proportion of passengers’ arrival for check-in process, distributed by fixed time intervals. The arrival pattern displayed in Table 1 exemplifies a realistic arrival pattern reference obtained from a case study carried out by Joustra & Van Dijk (2001) in the Amsterdam Airport Schiphol. Check-in period: period before flight departure during which passengers are allowed to register for the flight. It starts at Flight-open time and ends at Flight close-out time, after which the flight is said to be closed.
Departure flight schedule: departure flights information indicating the number of flights, the number of passengers and the starting time interval for each flight. Table 2 represents an example of a departure flight schedule based upon a flight realization at the Dutch airport Schiphol presented in a case study performed by Van Dijk & Van der Sluis (2006).
Table 1: Arrival pattern Source: (Joustra & Van Dijk 2001)
Table 2: Departure Flight Schedule Source: (Van Dijk & Van der Sluis 2006)
Common check-in system: passengers can check-in for their flights at any available desk during the check-in period. Dedicated check-in system: specific position desks are assigned for each flight during the check-in period.
Constant desks allocation policy: each flight is allocated to a constant number of desks during its check-in period. Variable desks allocation policy: each flight is allocated to a variable number of desks in each time interval (e.g. hour or
half an hour) during its check-in period.
Service level: the customer satisfaction in terms of waiting time or queues size, specially. The IATA-ADRM (2004) is a good reference for obtaining this data.
2. Methodology: Operational Research Tools
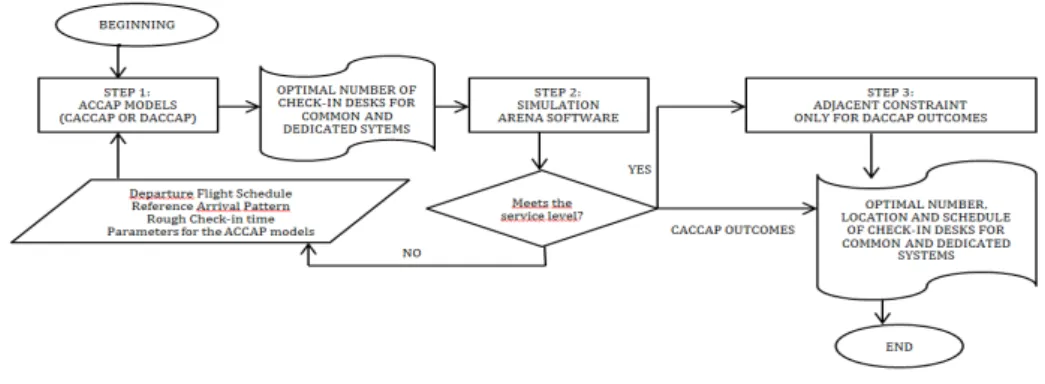
The methodology to optimize the Airport Check-in Counter Allocation Problem implies three steps: Step 1 – Optimization models for the ACCAP; Step 2 – Simulation; and Step 3 – Adjacency Resource Scheduling or adjacent constraint. A brief description of each step and a flow chart (Figure 1) about how works the methodology will be given in this section.
First, Step 1 is based on the proposal of Bruno & Genovese (2010) with modifications. Considering the variable allocation policy, we present two new optimization models, one for a common check-in system and the other for a dedicated. They aim to determine the minimum number of check-in desks to be opened by time interval, such that operational costs and the quality of service are balanced. These models present a new service level constraint. Step 1 is a deterministic scheduling problem based on the departure flight schedule, reference arrival pattern and a rough check-in time.
Second, Step 2 recurs to simulation (ARENA software) in order to assess if the results reached through Step 1 meet a given service level in terms of waiting and queue size when considering real uncertainty behavior. According to Joustra & Van Dijk (2001) a deterministic approach ignores stochastic aspects involved in the check-in process (passenger arrival and check-in times). So, they argue the importance of simulation in order to capture the non-steady behavior of the check-in process. In overall, the check-in process is studied considering the passenger arrival pattern for check-in service and how the passengers are served at the counters. In order to scrutinize the both passenger arrival and check-in time distributions, a set of scenarios are defined. The main scenarios to be tested are the common and dedicated check-in systems. According to Chun and Wak (1999), when the structure of the model is confirmed, testing sufficient replications for the same initial conditions and sampling passenger arrival and service distributions, the performance of the system described statistically is obtained. Statistics of interest have to do with the waiting time and queue size.
Third, in Step 3 once one has determined the required number of desks by time interval for each flight (dedicated system) it is possible to minimize the total number of desks under the adjacent constraint. This constraint stipulates that all desks for the same flight should be adjacent. Duin and Van der Sluis (2004), and Van Dijk and Van der Sluis (2006) explain clearly this theme, and state that without the adjacency constraint, the minimal number of desks could be found easily by the Earliest Release Date First rule (one of the Fixed Interval Scheduling). This would indicate the maximum of required
Time intervals over
the check-in period % of passengers
210 min - 180 min 5
180 min - 150 min 10
150 min - 120 min 20
120 min - 90 min 30
90 min - 60 min 20
60 min - 30 min 15
30 min - 0 min 0
Flight 1 2 3 4 5 6 7 8 9 10
Number of
passengers 150 210 240 180 270 150 210 300 180 270
desks at the busiest time interval but it does not guarantee an optimal solution satisfying the adjacency constraint. However, it is clear that is always the lower bound for the optimal number of required desks. In this way, mathematical models related with the adjacent constraint have to guarantee an optimal desk allocation with no more than
desks. With this regard, Van Dijk and Van der Sluis (2006) present an Integer Linear Program that it is the reference
for this step. Step 3 is a deterministic scheduling problem based on a given required number of desks for each flight with variable allocation policy.
Figure 1: Overview about the methodology to optimize the ACCAP
3. Mathematical Model for the Airport Check-In Counter Allocation Problem (ACCAP)
From a check-in desks management point of view, the objective is to determine the minimum number of check-in desks to be opened by time interval that ensures a given service level. The desk allocation can be made following a constant or a variable policy. With the latter, peak hours will have more desks while off-peak will have less. Thus, the variable policy seems more reasonable and can lead to a more optimized solution. We will therefore focus on the variable allocation policy. The ACCAP will be approached considering the two check-in systems, the common and the dedicated. The ACCAP model regarding to the common system will from now on be designated as CACCAP. In the same way, the DACCAP acronym is designated to the dedicated system. The CACCAP model is based on Bruno & Genovese (2010) and the DACCAP is a new approach. While the CACCAP model gives the number of desks per time interval, the DACCAP model gives the number of desks per flight per time interval. Both models (Integer Programming) can be classified as pure deterministic scheduling models as the departure flight schedule, passenger arrival pattern and a rough check-in time are known in advance. Both models are based on the following hypothesis:
Discrete time window: The time horizon (a day or some hours of a day) is divided in intervals with constant width . All parameters and variables are referred to each interval . On this basis, the problem becomes a discrete problem. Arrivals distribution: In order to simplify the problem, it is possible to forecast arrivals to a check-in desk through the
analysis of historical data, defining service demand as a parameter.
Desk service time: It represents the time needed to process and accept a passenger. This capacity has been assumed equal for each desk, and the value has been calculated based on real check-in processes analyses.
Desk opening cost: it represents the operational expenses for the airport administration in order to have an available check-in desk for assignment to departure flights.
3.1. Notation
: time window (usually a day or some hours of a day); : length of the considered time interval in minutes; : representative index of the single time interval; : representative index of the single flight;
: set of the time intervals in or the number of time intervals in ; : set of the flights scheduled in ;
: average desk service time for flight ;
: service demand from passengers of the flight at time interval ;
: number of passengers of flight waiting before desk opening;
: cost associated to have an available check-in desk at time interval ; : cost associated with the passenger in queue related to the flight ;
: JxM matrix; the coefficient is equal to 1 at time interval when passengers of flight cannot check-in and there is
no possible to leave passengers for check-in for the next time interval (case of the last opened time interval for each flight); and 0 in all other time intervals;
c: available time for check-in process by a desk within the time interval ;
: maximum percentage of the passengers in a queue at the end of each time interval ;
Furthermore, the models consider these sets of decision variables:
: number of passengers of the flight to be accepted in the time interval ; : number of desks to be assigned in each time interval ;
3.2. Integer Programming formulation for CACCAP:
∑ ∑ ( ) (1)
S.t. (2)
∑ (3)
(4)
∑ ∑ ∑ (5)
(6)
(7)
The objective function (1) minimizes the total cost given as the sum of two components: the costs associated with passengers in queue and the costs associated with opening a desk. Constraints (2) keep track of the passenger in the queue for each flight in each time interval. The number of passengers in a queue for flight at the end of a time interval is the sum of passengers in queue for flight from the previous time interval plus the number of passengers of flight arrived at the desk at time interval minus the number of passengers that completed the check-in process at this time interval . Constraints (3) represent capacity constraints. Constraints (4) express the fact that all passengers of a flight must be accepted within the check-in period. Constraints (5) can be considered the service level constraints. They state the most quantity of people that arrive in and can be processed at the time interval . Finally, constraints (6) and (7) define the domain of the decision variables. 3.3. Integer Programming formulation for DACCAP: ∑ ∑ ( ) (8)
S.t. (9)
(10)
(11)
(12)
(13)
(14)
The explanation of the objective function and the constraints from (8) to (14) has the equivalence with the explanation given from (1) to (7).
4. Case Study
The case study uses as inputs the arrival pattern shown in Table 1, the flight schedule shown in Table 2 and considers a check-in period for any flight of three hours (150 minutes for fulfilling the check-in process). Regarding the overall service level, 90% of all passengers must reach check-in desk within 10 minutes and nobody should wait more than 30 minutes. Regarding queue size, 90% of all passengers must stay inside the check-in area (at most there is space for 6 people waiting in front of each check-in desk). All model instances were solved using AIMMS 3.12 software with the LP-solver CPLEX 12.5 and a 1.7 GHz Core i3 computer in less than 10 seconds. Additional parameters and assumptions are detailed:
Discrete time window: Taking into account the flight schedule, the time window equals to ten intervals for the hourly time interval, and twenty for the half an hour;
Arrivals distribution: Taking into account the arrival pattern and the flight schedule, the parameter of demand ( ) or the number of passengers arriving for check-in is defined by flight and by time interval;
Desk service time ( ): A viable value can be assumed equal to 2 minutes per passenger;
Desk opening cost ( : A viable value can be assumed equal to USD 80 per hour (Parlar and Sharafali, 2008); Queue cost ( : A viable value can be assumed equal to USD 40 per passenger (Parlar and Sharafali, 2008); : 56 minutes for the hourly time interval and 28 for the half an hour;
: regarding to the given service level, a viable value can be assumed equal to 10%; All the passengers embarked in every flight were check-in at the counters;
The main parameters and assumptions for simulation are: time between arrivals (exponential distribution), check-in time (exponential distribution), queue configuration and discipline (common queue and FIFO), type of simulation to run (Terminating simulation), simulation duration (150 minutes for single flight and 600 minutes for complete departure flight schedule), warm-up period (60 minutes) and simulation experiment (trial of twenty replications).
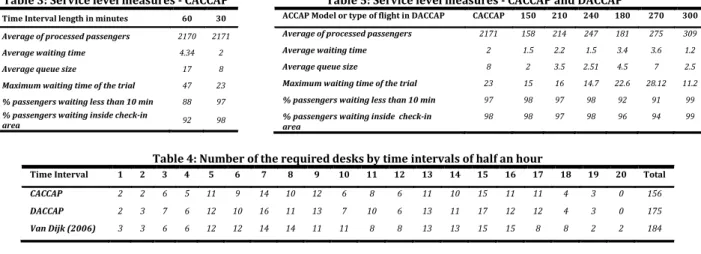
First, the analysis of the proper time interval length (between the hourly and the half an hour) to be used in the ACCAP models is developed. For this task, only the common check-in system was analyzed. The conclusion driven by the results can be extended to the dedicated system. After run the CACCAP for each time interval length and assess its outcomes by simulation, the main queue results (waiting time and queue size) and their general statistics were obtained such as shown in Table 3. Based on these results, we suggest 30 minutes to be the best time interval length as it provides better values of waiting time and queue size and meets the given service level at overall.
Finally, Table 4 also presents the result obtained by Van Dijk & Van der Sluis (2006) based on field work and simulation. In order to compare these proposals, the number of desks by time intervals of half an hour is considered as a reference. The comparison between the results obtained by CACCAP, DACCAP and Van Dijk & Van der Sluis (2006) evidence the accuracy of these models in order to get the minimal number of desks. At the same time, the given service level is meet such as show in Table 5. It is clear that the target of these three proposals searches to obtain the optimal number of check-in counters for flights in each time interval. But it is important to highlight that the two models proposed in this paper are based on optimization models supported by simulation with the additional target of balancing the service level and his related operative cost. Meanwhile the third proposal is based on simulation and only focuses in meeting a service level.
Table 3: Service level measures - CACCAP Table 5: Service level measures - CACCAP and DACCAP
Table 4: Number of the required desks by time intervals of half an hour
Conclusion
This paper proposes a methodology to optimize the ACCAP by minimizing operational costs such that a given service is ensured. It promotes the combination of optimization, simulation and adjacent resource scheduling techniques to face real world applications. Furthermore, we have proposed two new optimization models, which include a service level constraint. The first model is applied for a common check-in system while the second for a dedicated. Based on the results of the case study, the half an hour represents the right length of the time interval to discretize the problem. These results evince the reliability and accuracy of the models in order to reach the trade-off between the operational costs and a given service level. On the other hand, taking into account busiest airports, their hundreds of flights per day could bring some questions about the models performance. In this way, it is important to highlight that check-in problems can decomposed in smaller problems due to natural separations such as in domestic and international flights, and indeed, in airline consortia. However, further research in order to: identify the right time interval length according actual work timetable constraints and evaluate the fulfilling of service level in each time interval are required.
Finally, this work will serve to assess and improve the existing management check-in system of airports. Each, airport represents a particular situation and this methodology gives flexibility for fitting in any scenario. In this way, different options such as common or dedicated check-in systems and different features (such as the arrival pattern, service level, check-in time, time interval length and cost of airport resources) let this methodology to be useful in the ACCAP task. As future work, we intend to: test the models in different scenarios in Brazil and evaluate the parameters values according to the airport dimension; assess a general time interval according to actual constraints and the level of service in each time interval (not as overall). This paper promotes the combination of Linear Programming and Simulation as an Operational Research technique to optimize general planning and scheduling problems, that can be useful in other application areas such as: call centers, manufacturing, transportation, health service and logistics.
Acknowledgements
The authors express their gratitude for the support of Fundação Carlos Chagas Filho de Amparo, FAPERJ (scholarship E-26/112.0790/2013).
References
Atkins, D., Begen, M. A., Luczny, B., Parkinson, A., Puterman, M. L. (2003). Right on queue. OR/MS Today, 30(2).
Bruno, G., Gonovese, A. (2010). A Mathematical Model for the Optimization of the Airport Check-in Service Problem. Electronic Notes in Discrete Mathematics, 36(1), 703 – 710.
Chun, H., Mak, R. (1999). Intelligent Resource Simulation for an Airport Check-In Counter Allocation System. IEEE Transactions on Systems, Man and Cybernetics Part C: Applications and Reviews, 29(3), 325-335.
Duin, C., Van der Sluis, E. (2004). On the complexity of Adjacent Resource Scheduling. Institute of Acturarial Science & Econometrics, Report AE 6/2004 of University of Amsterdam.
IATA-ADRM (2004). Airport Development Reference Manual, 9th Edition. International Air Transport Association.
Joustra, P., Van Dijk, N. (2011). Simulation of check-in at airports. Proceedings of the 2001 Winter Simulation Conference, 1023 – 1028. McKinsey & Company (2010). Brazilian Air Transport Sector Study: Consolidated Report. National Bank for Social and Economic
Development, Rio de Janeiro.
Parlar, M., Sharafali, M. (2008). Dynamic allocation of airline check-in counters: a queueing optimization approach. Management Science. 54(8), 1410-1424.
Van Dijk, N. M., Van der Sluis, E. (2006). Check-in Computation and Optimization by IP and Simulation in Combination. European Journal of Operational Research, 171, 1152-1168.
Yan, S., Tang, C. H., Chen, M. (2004). A model and a solution algorithm for airport common use check-in counter assignments. Transportation Research Part A. 38, 101-125.
Time Interval length in minutes 60 30
Average of processed passengers 2170 2171
Average waiting time 4.34 2
Average queue size 17 8
Maximum waiting time of the trial 47 23
% passengers waiting less than 10 min 88 97
% passengers waiting inside check-in
area 92 98
ACCAP Model or type of flight in DACCAP CACCAP 150 210 240 180 270 300
Average of processed passengers 2171 158 214 247 181 275 309
Average waiting time 2 1.5 2.2 1.5 3.4 3.6 1.2
Average queue size 8 2 3.5 2.51 4.5 7 2.5
Maximum waiting time of the trial 23 15 16 14.7 22.6 28.12 11.2
% passengers waiting less than 10 min 97 98 97 98 92 91 99
% passengers waiting inside check-in area
98 98 97 98 96 94 99
Time Interval 1 2 3 4 5 6 7 8 9 10 11 12 13 14 15 16 17 18 19 20 Total
CACCAP 2 2 6 5 11 9 14 10 12 6 8 6 11 10 15 11 11 4 3 0 156
DACCAP 2 3 7 6 12 10 16 11 13 7 10 6 13 11 17 12 12 4 3 0 175