Assessing carriers’ logistical performance indicator by shippers in the São Paulo
Metropolitan Area
Denisson Pereira; José Geraldo Vidal Vieira+; João Eduardo A. Ramos da Silva; Elisangela F. S. Campana Possidônio Federal University of São Carlos, Sorocaba, Brazil
Article Info Abstract
Keywords:
road freight transportation, logistical performance indicator, non-parametric tests, sustainable practices, urban freight transportation
This paper aims to assess the logistics services provided by carriers in the São Paulo Metropolitan Area (SPMA) considering two perspectives: the efficiency of the operations and the adoption of sustainable measures. A survey was applied to the 15 main shippers working with the selected carrier in order to assess logistics performance indicators (on-time-in-full, relationship, lead time, service quality, etc.) as well as sustainability demands (disposal of oil, post-use tires, spare parts, etc.). A second survey was applied to 21 other shippers that hire similar services provided by other carriers in the SPMA. The results indicate that a good relationship between shippers and carriers positively impacts the evaluation of the carriers. Approximately 64% of the informants claim that gas emissions followed by disposal of lubricant, tires and spare parts are the major unsustainable practices to be avoided. This study makes two contributions: to show the most relevant sustainable and logistics aspects that carriers must consider for their services from the viewpoint of shippers and to analyse the influence of the relationship between the companies on the performance indicators.
Submitted 14 Oct 2014 received in revised form 3 Dec 2014 accepted 1 Apr 2015.
Licensed under Creative Commons CC-BY 3.0 BR.
+ Corresponding author. Universidade Federal de São Carlos, Campus Sorocaba. Rodovia João Leme dos Santos, km 110. CEP 18.052-780 - Sorocaba, SP - Brasil. E-mail [email protected].
Introduction
The aim of this work is to evaluate the logistics services provided by carriers in the São Paulo Metropolitan Area (SPMA) from the point of view of shippers and to identify the sustainable measures with the largest impact on the environment.
Operations managed by logistics services providers, either a Third-Party Logistics (3PL) or a carrier, have been expanding over the years, and their role in supply chain management has reached different dimensions according to the scope of the activities provided. In light of this, it is possible to observe a growing demand for lower fees and, at the same time, a demand for better quality in logistics operations (Vivaldini, Pires, & Souza, 2012) with the aim of reducing the commoditization of cargo transportation (Araujo, Bandeira, & Campos, 2014). Additionally, awareness of the level of service provided may help companies increase their logistics efficiency, reduce environmental externalities, optimize travels, increase occupancy rate of the vehicles, reduce gas emissions levels, and reduce the number of accidents, among others (Castro, 2013).
Once the carriers acknowledge the relevance of performance goals for quality and responsiveness, they can monitor the customer evaluations of the services, which would represent a distinguishing factor for attracting new customers. Thus, we define the research question as "What is the shippers' perception of the services and sustainable practices of the carriers?"
In our previous investigations, we have found that although the most significant indicators for carrier selection are the freight cost and the general quality of service, on a daily basis, the level of logistics service is measured by indicators referring only to quality, i.e., on-time-in-full (OTIF), relationship, responsiveness, lead time, damaged products, type of vehicle, appearance and cleanliness of vehicles, and the intrinsic quality of the operation. In this research, we noted that the indicator "relationship" had the lowest score; however, if the hiring companies invest in a good relationship with their suppliers, the level of service may significantly increase. The literature confirms this positive effect of a good relationship between companies on operational logistics performance among partners (Van der vaart & Van Donk, 2008; Fynes & Voss, 2002; Prajogo, Chowdhury, Yeung, & Cheng, 2012). However, there is little collaboration between the companies in urban freight transport (Lindholm & Behrends, 2012), contributing to lower logistics performance (Castro & Kuse, 2005) through delays in deliveries and service quality.
Furthermore, it is well known that vehicles are the biggest consumers of inputs such as fuel, tires, spare parts, and lubricants, among other items, for which use and disposal require special attention to avoid negative impacts on the environment or the creation of externalities (Guimarães, Leal, D' Agosto, Ferreira, & Oliveira, 2014; Castro, 2013). This study is comprehensive, as it explores not only the shippers' perception of the operational efficiency but also their perception of sustainable logistics related to impacting factors (gas emission, tires, post-use spare parts and accessories, lubricant oil) and their adequate disposal.
Therefore, the contribution of this study is to analyse the influence of the relationship between the companies on the performance indicators and relevant sustainable aspects, which has not been performed from the viewpoint of shippers in urban freight transport, especially in the SPMA.
Considering its relevance, urban freight transportation from the viewpoint of carrier performance is still sparsely explored in Brazilian literature, especially concerning the SPMA, where huge problems such as intense traffic and air pollution are concentrated. The literature has focused on public transportation and their externalities related to traffic, traffic accidents, and CO2 emissions, etc. (De Vasconcellos, 2005), urban mobility (Da Silva, Da Silva, & Macedo, 2008) and the comparative analysis of the performance between urban transportation and other modes. Other studies focused on infrastructure such as the localization of cargo terminals and distribution centres (Portugal, Morgado, & Lima, 2011; Marinov et al., 2014). However, our study focuses on the logistics performance and sustainable practices of the companies in urban freight transport.
1. Literature review
To measure the degree of satisfaction within the logistics services, the application of performance indicators is a common practice among companies. When opting for an increase in level logistics service, incorporating sustainable practices is a relevant aspect to consider in urban transport (Lindholm, 2013). Meng, Liang, Lin, & Chen (2010) showed that the level of transportation services increased as the collaboration among partners increased. Based on this information, we summarize the relevant studies related to logistical performance indicators and sustainable practices.
Conceição & Quintão (2004) proposed internal and external logistics performance indicators to assess the logistics performance of a beverage supply chain. The internal indicators included order and transportation fees, transported volume failures and turnover stock volume. Regarding external indicators, they assessed the partner's performance in relation to OTIF, reliability, and delivery return. Expanding the horizons of planning towards a supply chain perspective, Vieira & Coutinho (2008) analysed a set of logistics performance indicators established between a pharmaceutical distributor and its suppliers. They stressed the relevance of the overall logistics efficiency of the supply chain and showed that on-time delivery and collection services and constant information exchange are essential for good logistics planning. Fernandes, Vanti, Andrade, & Gomez (2008) developed a logistics performance model based on the following indicators: assets, total cost, reliability, responsibility, flexibility, satisfaction and technology. Their goal was to develop a model for addressing the uncertainties to which the organisations are subject in order to assist in decision making.
Using the same structure of internal and external indicators used by Conceição and Quintão (2004), Brito, Carbone, & Blanquart (2008) stress the need to improve sustainable performance using internal and external measures. Internal measures refer to reductions in carbon dioxide emissions and increases in recycling; external measures refer to collaborative planning, prediction and responsive replenishment, shared use of resources in transportation and storage, and delivery programming. In addition, Gallez, Hivert, & Polacchini (1998) state that poorly tuned vehicles may elevate consumption and contribute to an increase in pollutant gas emissions. Guimarães et al. (2014) also address these measures when analysing the aspects, attributes and indicators related to the eco-efficiency concept.
The literature review has revealed a set of important logistics performance indicators and sustainable practices in freight transportation; nevertheless, indicators such as "service quality", "responsiveness", "appearance and cleanliness" and others as "relationship" are less investigated. Furthermore, sustainable practices, for example, goals for gas emissions reduction and proper disposal of lubricants, tires and spare parts, are still occurring with regard to urban freight transport, particularly in developing countries where the transportation system is based on road transport (Chow et al., 2004).
2. Methodology
Our theoretical background was based on studies that describe logistics performance indicators and sustainable practices in freight transport (Castro, 2013; Prajogo et al., 2012; Guimaraes et al., 2014; Brito et al., 2008; Vieira and Coutinho, 2008). Other studies were also relevant due to their focus on urban freight transport (Castro and Kuse, 2005; Portugal et al. 20011; Lindholm, 2013; Lindholm and Behrends, 2012). These studies are importantbecause provide a group of logistics indicators in which our research is based on. Therefore, our study is related to carriers that operate in a large metropolitan area where huge problems hamper the logistics performance of the companies and also add environmental challenges, for example, air pollution (Chow et al., 2004; De Vasconcelos, 2005).
This is a descriptive paper based on Forza (2002). Initially, this research was conducted on one carrier company and its partners (shippers). The main companies hiring the carrier's services completed a questionnaire with the objective of assessing the logistics performance indicators and sustainable practices. The carrier, referred to as Alpha , had operated in the São Paulo Metropolitan Area (SPMA) for 21 years and employs 58 people; therefore, Alpha can be considered as a small-sized company (SEBRAE, 2013). In addition to the questionnaire applied to Alpha's customers, we applied the questionnaires to 21 other shippers hiring transportation services from other carriers with similar features. This part of the study assessed how carriers operate logistics services in the SPMA in comparison with Alpha.
2.1. Questionnaire
The questionnaire was built based on Churchill & Iacobucci (2004) and consists of three blocks: (1) characterization of the responding company (number of employees, job titles, use of information technology); (2) assessment of the logistics performance indicators considered relevant by the shippers; and (3) evaluation of the sustainable practices to reduce the impacts of logistics operations on the environment. The logistics indicators and sustainable practices will be presented in section 4. The questionnaires were conducted by the researchers during technical visits and previous contacts by phone in order to minimise mistakes and guarantee better data collection.
2.2. Universe, Sample and Data Analysis
sampling is finite and intentional. In the second survey, encompassing 21 shippers that hire similar services from other carriers, the sampling may be considered finite conducted by convenience. One limitation of this work is the representativeness of this sample, given the difficulty in determining the universe of operating carriers in the SPMA. The data obtained from the questionnaires were evaluated with descriptive statistical measures such as frequency, mean, median and mode, and standard deviation. The Wilcoxon nonparametric test (Pestana & Gageiro, 2004; p. 467) was used to verify the significant difference between the logistics performance indicators between Alpha and the other carriers. The Kruskal Wallis nonparametric test was used to determine the influence of the relationship between the companies on the performance indicators. In addition, we conducted a paired-samples t-test to confirm the differences between the two groups of shippers, i.e., to reaffirm the better perception produced by Alpha's services in comparison with its competitors.
3. Results
3.1. Relevant indicators for hiring logistics services
Among the informants, 60% claim to employ 100 or more people, suggesting medium- and large-size companies, according to the SEBRAE classification (2013), and to hire at least one logistics service operator. Approximately 45% of the shippers use Electronic Data Interchange (EDI) with the carriers. Only 28% of the companies that do not use EDI claim to employ more than 100 people, suggesting a smaller amount of investment in IT from smaller companies and a stronger relationship between shipping managers and carrier managers from the origin to the destination. Table 1 shows the most relevant indicators for hiring transportation services as defined by the shippers for both Alpha and the other carriers.
Table 1 - Indicators evaluated for hiring logistics services (Source: own calculations)
We note that the informants consider "freight fee" and "service quality" to be the most relevant aspects when selecting a carrier. It is well known that hiring companies hold the bargaining power and tend to pay less for freight services due to the high offer of such services. As revealed by Araújo et al. (2014), the prices for logistics services seem to be imposed by the hiring companies that tend to underpay their partners (carriers).
In addition to these indicators, clients of Alpha regarded "logistics structure" as more relevant, whereas clients of the other carriers regarded "responsiveness" and "OTIF" as the relevant indicators. This result may indicate that customers of the other carriers are willing to pay more for an urgent service, e.g., deliveries in a high-demand period such as the end of the month and urgent deliveries for replenishment. Most of the companies stated that the expenses for carriers encompass 10 to 20% of company revenue, and therefore, freight fee is highly relevant. Those clients declaring a higher share of their revenue spent on carriers gave lower scores to lead time. On the other hand, it is believed that a high demand for these services makes delivery scheduling requests a strategy that forces carriers to offer dedicated trucks or overtime deliveries to important clients. However, these indicators are not the most relevant in the assessment of daily operations. In the following section, we analyse the indicators of level of daily service.
3.2. Evaluation of transportation services
To measure the service levels of Alpha and other carriers in a comparative way, we analysed the average scores of the indicators (Table 2). Each indicator received a score on a 0-10 scale.
Table 2 – Daily measurement indicators of carriers service level (Source: own calculations)
Alpha had a higher average score for most of the indicators. For instance, for the variable "Relationship", Alpha had a score of 8.1, while the other carriers scored 7.8. We also stress "Responsiveness": its score presented the largest difference among the indicators between Alpha and the competition (with 1.2 points), but according to the Wilcoxon test, there was no statistically significant difference at the 5% significance level.
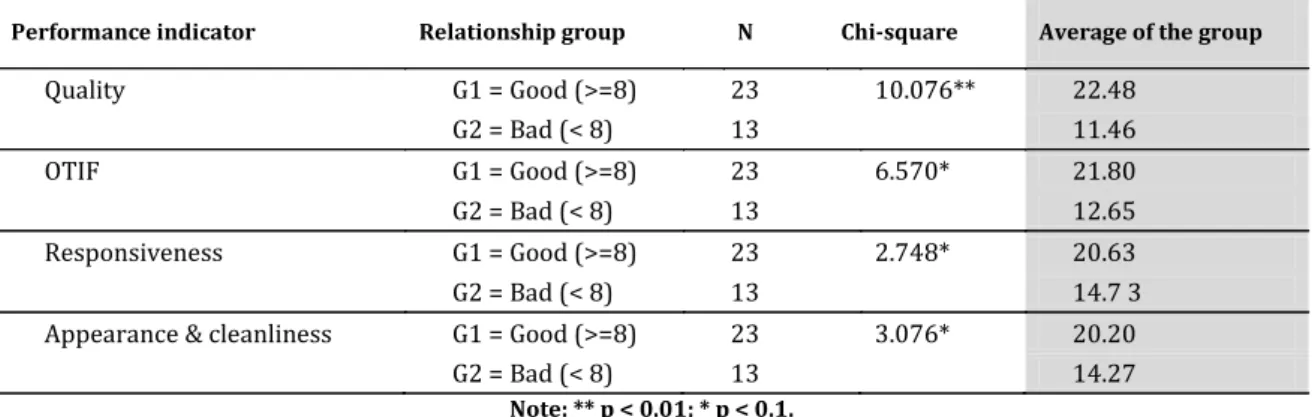
From the results, we note that "Relationship", "OTIF", "Quality", "Responsiveness", and "Lead Time" are areas for improvement because they had lower average scores among the evaluated indicators. For a more thorough analysis of the indicators compounding the "less efficient" group, we checked whether the "relationship history" influences "Quality", "OTIF", "Responsiveness", and the "Appearance & cleanliness" of the vehicles . "Relationship" measures the extent to which the company is inclined to accept the changes implied in the evaluation of the level of daily service. If there is a good and frequent relationship between the partners, it may manifest as an improvement in the other indicators. Table 3 shows the indicators obtained for Alpha (G1) and the other carriers (G2), comparatively. According to the Kruskal Wallis
nonparametric test for small samples, the null hypothesis is, The relationship history has no effects on the average values of these indicators.
Table 3 shows that a good relationship history between the companies (shippers and Alpha) contributes to a significant increase in the average scores for "Quality", "OTIF", "Responsiveness", and "Appearance and cleanliness". The results suggest that improving relationships may lead/contribute to a significant improvement in Alpha's quality of service in the areas of general quality, OTIF, responsiveness to increasing demands, and vehicle appearance and cleanliness. The statistical analysis suggests a better performance of Alpha's indicators in comparison with the competitors.
Indicators for hiring Freight fee Responsiveness OTIF Logistics structure Service quality
Alpha 43.3% 10% 3.3% 18.2% 36.7%
Other carriers 33.3% 19% 14.3% 9.5% 23.8%
Service level indicators
Relationship Quality OTIF Responsiveness Type of vehicle
Appearance & cleanliness
Damaged delivery
Lead time
Alpha 8.1 8.3 8.5 8.4 8.9 9.4 9.5 8.1
Table 3 –Kruskal-Wallis test for the impact of relationship history on indicators (Source: own calculations)
Note: ** p < 0.01; * p < 0.1.
3.3. Perception of sustainable practices in transportation according to shippers
The analysis of the requirements for sustainable practices in transportation was conducted on the group of shippers as a whole. Most of the informants claim it is "possible to profit in transportation and still respect the environment." Table 4 shows that at least 50% of informants completely agree with this statement. Regarding the contribution of the transport industry to greenhouse gas emissions, the hypothesis mentioned is confirmed, although with larger variability (Table 4).
Table 4 - Shippers' perception of the impact of transportation on the environment (Source: own calculations)
The acknowledgement of the relevance of the environment and sustainable practices in transportation points towards changes, albeit small. As an example, the informants reported a lack of control and regulation and complained that the applicable laws are too soft to enforce gas emissions control. Nearly 58,3% of informants claim that "the lack of awareness regarding these practices by the collaborators" is the main barrier. According to one company interviewed, "The lack of knowledge about good environmental practices impacts the mechanical wear and the gas emissions of poorly driven vehicles." Some interviewees also indicate a lack of training and planning of the carrier companies, which are usually not aware of the good practices in transportation. Among the factors negatively affecting the environment, 64% of the interviewed shippers believe "Gas Emissions" is the most critical, followed by lubricants, tires and spare parts disposal (Table 5). Guimarães et al. (2014) also stress these factors as eco-efficiency indicators.
Table 5 - Most impactful factors on the environment (Source: own calculations)
Additionally, 71% of the interviewed companies suggested adequate disposal of lubricant oil and post-use tires and the frequent servicing of injection nozzles and pumps (Table 6) as low-environmental impact improvements. The improvements suggested in Table 6 are to be incorporated into the operational routine of the carriers because they are the key points for the maintenance of an outstanding position in the market and even their very existence in the future. This is also relevant given that lubricant oil companies require evidence of proper post-use disposal in order to keep the contract.
Table 6 - Improvements for lower impact logistics (Source: own calculations)
Conclusion
The study showed the perception of shippers regarding the logistics services of carriers in the SPMR, especially pertaining to operations and sustainability issues as highlighted previously. Particularly, it depicted customer views of a specific carrier selected for this case report in comparison with other carriers regarding their services.
Performance indicator Relationship group N Chi-square Average of the group
Quality G1 = Good (>=8) 23 10.076** 22.48
G2 = Bad (< 8) 13 11.46
OTIF G1 = Good (>=8) 23 6.570* 21.80
G2 = Bad (< 8) 13 12.65
Responsiveness G1 = Good (>=8) 23 2.748* 20.63
G2 = Bad (< 8) 13 14.7 3
Appearance & cleanliness G1 = Good (>=8) 23 3.076* 20.20
G2 = Bad (< 8) 13 14.27
Factor Average Standard
deviation First quartile Median
Profit vs environment respect 9.14 1.25 8 10
Transport industry contribution to gas emissions 8.11 1.85 7 8
Impacting factors Percentage Observations Num. Observations
Gas emissions 64% 23
Lubricant oil 28% 10
Tires 6% 2
Post-use spare parts 3% 1
Post-use accessories 0% 0
Total 100% 36
Improvement Num. Citations Percentage
Adequate disposal of post-use lubricant oil 29 27%
Adequate disposal of post-use tires 25 23%
Frequent servicing of the vehicles and motor nozzles and pumps 23 21%
Correct regulation of the vehicles nozzles and pumps 13 12%
Preventive maintenance of bearings, suspension, clutch and brakes 10 9%
Adequate disposal of post-use spare parts and accessories 6 6%
Frequent calibration of tires (reduces the friction force between tires and pavement) 2 2%
Our results showed that although the most relevant indicators for the selection of a carrier are the freight fees and the quality of service, and the quality indicators are the priority in the daily evaluation. This is justifiable by the fact that the carriers set the price within the agreement for a certain period during which they will be evaluated. In addition, the "relationship" indicator seems to correlate with the other indicators, which are better evaluated when that factor is improved. Given that nearly 55% of the shippers do not use EDI in their interaction with carriers, this result offers a motivation for the companies to invest in a daily relationship with their partners through interactions between teams, meetings to align indicators, availability of information regarding number of vehicles, and a communication flow in the event of delivery occurrences.
The limitation of this work is the size of the sample, which allows us to apply only nonparametric tests. However, our research provides suitable statistical results and an investigation of relevant sustainable and logistics aspects in urban freight transport. The answers regarding sustainability gathered in the questionnaires indicate a growing awareness of the interface between logistics and environment, an aspect recognized by the managers of this area. The vehicles were identified as the source of greenhouse gas emissions, and the disposal of supplies (lubricants, tires, spare parts, etc.) has become a relevant concern among the interviewees. The reports indicate that some companies actually refrain from hiring logistics operators that do not comply with good environmental practices.
With this acknowledgement, the study contributes to the identification of measures to reduce the environmental impact of the transport industry that must be put into practice, particularly the proper disposal of lubricant oil and post-use tires and the consistent servicing of the injection system (pumps, nozzles and motors) that may increase emissions if not properly tuned. Thus, given the new operational requirements of conformity with environment-related issues, sustainability-related qualifying criteria may be required in the near future as conditions to operate in cargo transportation. For future works, since the transport industry influences the environment, we believe that studies to quantify disposed supplies (tires, lubricants, spare parts) and to map their path until its final proper destination are of increasing relevance.
Acknowledgements
CNPq supported this work (Process 301140/2013-8).
References
Araújo, M. P. S., Bandeira, R. A. M., & Campos, V. B. G. (2014). Custos e fretes praticados no transporte rodoviário de cargas: uma análise comparativa entre autônomos e empresas. Journal of Transport Literature, 8(4), 187-226.
Brito, P. M., Carbone, V., & Blanquart, M. C. (2008). Towards a sustainable fashion retail supply chain in Europe: Organization and performance. International Journal of Production Economics, 114(2), 534-553.
Castro, N. (2013). Mensuração de externalidades do transporte de carga brasileiro. Journal of Transport Literature, 7(1), 163-181.
Castro, J. T., & Kuse, H. (2005). Impacts of large truck restrictions in freight carrier operations in metro manila. Journal of the Eastern Asia Society for Transportation Studies, 6, 2947–2962.
Chow, J. C., Watson, J. G., Shah, J. J., Kiang, C. S., Loh, C., Lev-On, M., & Molina, L. T. (2004). Critical review discussion: Megacities and atmospheric pollution. J. Air Waste Manage. Assoc, 54(10), 1226-1235.
Conceição, S. V. & Quintão, R. T. (2004). Avaliação do desempenho logístico da cadeia brasileira de suprimentos de refrigerantes. Gestão e Produção, 11(3), 441-453.
Churchill, G. A., & Iacobucci, D. (2009). Marketing research: methodological foundations, Cengage Learning.
Da Silva, A. N. R., da Silva Costa, M., & Macedo, M. H. (2008). Multiple views of sustainable urban mobility: The case of Brazil. Transport Policy, 15(6), 350–360. doi:10.1016/j.tranpol.2008.12.003
De Vasconcellos, E. A. (2005). Transport metabolism, social diversity and equity: The case of São Paulo, Brazil. Journal of Transport Geography, 13(4), 329–339. doi:10.1016/j.jtrangeo.2004.10.007.
Fernandez, A. M. P., Vanti, A. A., Andrade, R. A. E., & Gomez, J. M.. (2008). Proposta de um modelo de medição de desempenho logístico apoiado pela lógica difusa: o caso de uma indústria de motores. Revista Ibérica de Sistemas e Tecnologias de Informação.
Forza, C. (2002). Survey research in operations management: a process-based perspective. International Journal of Operations & Production Management, 22(2), 152–194.
Fynes, B., & Voss, C. (2002). The moderating effect of buyer-supplier relationships on quality practices and performance. International Journal of Operations & Production Management, 22(6), 589-613.
Gallez, C., Hivert, L., & Polacchini, A. (1998). Environment energy budget of trips (EEBT): a new approach to assess the environmental impacts of urban mobility., International Journal of Vehicle Design. 20, 326 - 334.
Guimarães, V. A., Leal Jr., ). C., D’Agosto, M. A., Ferreira, A. F., & Oliveira, C. M. 4 . Desempenho ambiental de polos geradores de viagem de carga. Journal of Transport Literature, 8(3), 250-269.
Lindholm, M., & Behrends, S. (2012). Challenges in urban freight transport planning – a review in the Baltic Sea Region. Journal of Transport Geography, 22, 129–136. doi:10.1016/j.jtrangeo.2012.01.001.
Lindholm, M. (2013). Urban freight transport from a local authority perspective – a literature review. European Transport \ Trasporti Europei, (54), 1–37.
Marinov, M., Giovanni, L., Bellisai, G., Clevermann, J., Mastellou, A., Victόria, D., & Deleva, L. 4 . Analysis of rail yard and terminal performances. Journal of Transport Literature, 8(2), 178-200.
Meng, S., Liang, G., Lin, k., & Chen, S. (2010, Sep). Criteria for services of air cargo logistics providers: How do they relate to client satisfaction? Journal of Air Transport Management, 16(5), 284-286.
Pestana, M. H., & Gageiro, J. (2005) Análise de Dados para Ciências Sociais - A complementaridade do SPSS. 4ª ed. Lisboa.
Prajogo, D., Chowdhury, M., Yeung, A., & Cheng, E. (2012). The relationship between supplier management and firm performance: a multi-dimensional perspective. International Journal of Production Economics, 136(1), 123-130.
Portugal, L. S., Morgado, A. V., & Lima, O. (2011). Location of cargo terminals in metropolitan areas of developing countries : the Brazilian case. Journal of Transport Geography, 19(4), 900–910. doi:10.1016/j.jtrangeo.2010.11.005
Sebrae (2013). Critérios de classificação de empresas: EI – ME – EPP. Available at:<www.sebrae-sc.com.br/leis/default.asp?vcdtexto=4154> Accessed 2nd June 2013.
Van der Vaart, T.; & Van Donk, D.P. (2008). A critical review of survey-based research in supply chain integration. International Journal of Production Economics, 111(1), 42-55.
Vieira, J. G. V., & Coutinho, D. P. (2008). Avaliação da Colaboração Logística entre uma Distribuidora e seus Fornecedores., Revista Eletrônica Produção e Engenharia, 1, 53-68.