DO:
D 10.1590/S1516-14392011005000088
Mix Design of High-performance Concrete
Aminul Islam Laskar*
National Institute of Technology, Silchar-788010, India
Received: July 28, 2008; Revised: August 19, 2011
A mix design procedure for high-performance concrete mixes has been presented in this paper. Since rheological parameters and compressive strength are fundamental properties of concrete in two different stages of production, the correlation between rheological parameters and compressive strength has been used instead of using water-cement ratio versus compressive strength relationship. Water-cement ratio and aggregate volume to paste volume ratio has also been determined from rheological behavior and used in the mix design. On the proposed method, the designer is able to estimate rheological parameters like yield stress and plastic viscosity at the design stage for a given target strength, in addition to ingredients of concrete.
Keywords: rheology, yield stress, plastic viscosity, mix design, high-performance concrete
*e-mail: [email protected]
1. Introduction
The primary aim of a mix design method is to obtain proportions of concrete ingredients that can be used for a irst trial batch to produce a certain concrete for a particular strength, long term qualities and performance. A mix design provides a starting mix proportions that will have to be more or less modiied to meet the desired concrete characteristics. High-performance concrete (HPC) does not necessarily require high strength but the mix proportioning should be such that permeability is as low as possible for the particular use. Mix design of high performance concrete is different from that of usual concrete because water-binder ratio is very low and it may contain mineral admixtures which change the properties of fresh and hardened concrete1. Moreover, slump or compaction factor can
be adjusted using high range water reducing admixture (HRWRA) without altering water content.
HPC requires dense, void free mass with full contact with reinforcing bars. Workability has to be compatible with these fundamental needs to achieve high performance concrete. To do so, mix should be such it is easy to vibrate and it is luid enough to pass through congested reinforcement. HPC possesses three characteristics: high strength, high durability and high workability2.
A minimum slump of 100 mm is therefore preferred3. Durability is
related to low permeability. High strength and low permeability are linked to one another because high strength requires low volume of pores, although these two are not necessarily related. Thus, remaining two characteristics that need careful control and monitoring at the production stage are high strength and high workability.
The single-point workability tests nowadays are considered as incapable of providing an adequate characterization of workability of today’s much more advanced concrete mixtures4,5. Researchers treat
fresh concrete as luid and use luid rheology methods to describe concrete behavior6-8. Concrete as a luid is most often assumed to
behave like a Bingham luid with good accuracy4,5. On Bingham
model, low is deined by two parameters: yield stress and plastic viscosity. Yield stress and plastic viscosity are considered to be fundamental parameters of fresh concrete rheology. On existing mix design methods, there is no provision to have an idea of estimating rheological parameters like yield stress and plastic viscosity.
Mix design of HPC is complicated by the fact aggregate strength or the strength of the cement-aggregate bond, are often the strength controlling factors and the role of water-cement ratio is less clear. The water-cement ratio is a poor predictor of compressive strength in high strength concrete9.
There are methods of mix design of HPC such as method proposed by Aitcin1, Mehta and Aitcin2, Ondian Standards mix design method10
among other methods. Most commonly, purely empirical procedures based on trial mixes are used. According to Canadian Portland Cement Association, the trial mix approach is the best for selecting proportions for HPC9. On this paper, a new method of mix design procedure has
been discussed for design of high strength HPC. The method uses the relationship between design parameters and rheological properties. The designer is able to estimate fresh concrete rheological properties at the design stage in addition to mix proportions for target strength.
2. Materials
The cement used throughout the experiment was Drdinary Portland Cement (OPC). The 28 day compressive strength and speciic gravity of cement were 50.2 N.mm–2 and 3.10 respectively determined
as per OS: 12269-198711. Locally available alluvial sand (medium;
speciic gravity = 2.6) inside the laboratory was used throughout the experimental investigation unless otherwise mentioned. Particle size distribution of aggregates is presented in Table 1 and 2. Crushed stone aggregates (speciic gravity = 2.6) of nominal maximum size 16 mm were used as coarse aggregate. The physical properties of aggregates were determined as per OS: 2386-199712. Drdinary tap water was used
for all the mixes to prepare fresh concrete. Poly-Carboxylic Polymer (PC) with set retarding effect was used as high range water reducing admixtures (HRWRA).
3. Mixing
Concrete was mixed in a tilting mixer (laboratory type). The following mixing sequence was adopted:
0
125.75T= τ +0.08Nµ (2)
The above Equation 2 is in Bingham’s form. Comparing Equation 2 with Bingham’s equation, total shear stress (Pa) in terms of torque (N.m) can be expressed as
125.75T
τ = (3)
The overall shear strain rate (per second) in terms of rotational frequency (rpm) can be written as
0.08N
γ = (4)
Both the quantities γ. and τ can be observed during the experiment. By plotting the values of (γ., τ), one has the low curve from which τ0 and µ can be obtained.
After the rheological tests were over, fresh concrete mixes were transferred to the concrete mixer again. Balance concrete and mortar left in the cylindrical container were cleaned manually and transferred to the mixer. The concrete mixes were then mixed for two minutes and transferred to the bucket. Concrete was placed in cube mould in three layers; each layer compacted by 16 mm rod 25 times. Final compaction was achieved by vibration table in a standard manner. Between 1-2 hours of casting, when the surface of concrete in cube • Stop mixing for one minute;
• Add HRWRA to the mix and mix for 3 minutes; • Pour the concrete mix.
4. Experimental Program
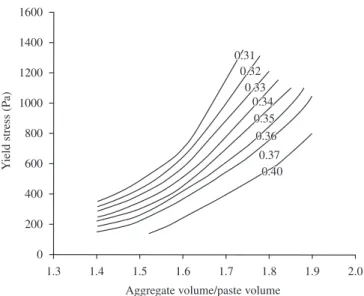
A large number of high-performance concrete mixtures were prepared in the laboratory for the present study. Rheological tests were carried out to investigate the effect of percentage sand, sand zones such as coarse, medium and ine, nominal size of coarse aggregate and aggregate volume-paste volume ratio. For the determination of rheological parameters, average of three readings was taken.
Rheological tests were performed with a rheometer fabricated in the laboratory (Figure 1). It consists of a 150 mm diameter lat circular vane plate driven by a motor through a gearbox. Vane plate is mounted coaxially with a cylindrical container (effective diameter = 270 mm) with sleeve and bearing arrangement to ensure accurate alignment. The cylindrical container is provided with vertical ribs of 20 mm projection at a pitch of 60 mm along the circumference. Ribs are also welded at the bottom of the cylinder. The effective gap between the bottom and the shearing surface is 75 mm. The effective concrete height above the vane plate is also 75 mm. The no-slip condition at top of the cylinder is achieved by providing 20 mm high mesh of blades. The blade mesh can be detached as and when necessary. The torque of the motor and hence the vane plate is controlled by varying input voltage with a 10 ampere AC variac. The number of revolution of the vane plate is measured with a non-contact infrared digital tachometer, by focusing at the retro-relective tape glued to the spindle. The spindle has a pulley welded to it that is used for calibration purpose only. The torque provided by the rheometer was calibrated in terms of input AC voltage by rotor blocking method. A spring balance anchored to a ixed object is itted to the pulley of the spindle. When the motor is switched on, the spring balance blocks its rotor and the spring balance reading is noted. This arrangement gives the braking torques at different voltages. On the present study, concrete was sheared at each step for 30 seconds. Stepwise increasing shear stress sequence followed by a decreasing shear stress was used and the down curve was taken to draw the low curve. Calibration of torque was validated by testing a magneto-rheological luid (MRF 132DG) and comparing the data with measurement made by RS1 rheometer. The MR Fluid (magneto-rheological luid) is a suspension of micron sized magnetizable particles in a carrier luid (density = 2980-3180 kg/cu.m; solid content by weight = 80.98%; operating temperature = –40 to +130 °C). The luid can be used in a shear mode. It responds to an applied magnetic ield with a change in rheological behavior. This property enables MR luid to ind its use in various control devices such as brakes and clutches, dampers, shock absorbers etc. On many engineering applications, Bingham model can be effectively used to describe essential luid properties. Ot was observed that both the readings agreed reasonably well. The detail of the set up was presented elsewhere13. The expression for the
total torque in the present rheometer is given by
(
)
0 2
2
2
120 2
2
3
2 3
h t d
T h g Nd
d
d d h t
h t
+
+
π
= τ + µ
π + + + +
(1)
In the present equipment, d (diameter of the vane plate) = 0.270 m; h (effective gap between bottom of the vane plate and the bottom of the cylinder) = 0.075 m; t (height of the ribs of vane plate) = 0.025 m and g (effective gap of the annulus) = 0.060 m. Substituting these in Equation 1, one has the following equation
Table 1. Sieve analysis of sand.
Sieve size (mm) % Passing
4.75 98.2
2.36 96.5
1.70 94.6
1.18 91.2
0.60 66.3
0.30 20.3
0.15 1.6
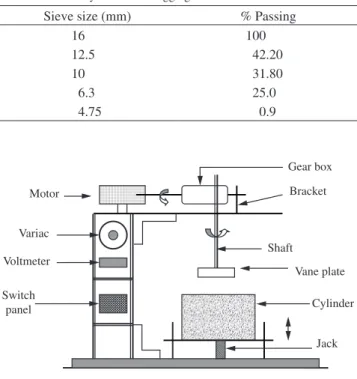
Table 2. Sieve analysis of coarse aggregate.
Sieve size (mm) % Passing
16 100
12.5 42.20
10 31.80
6.3 25.0
4.75 0.9
moulds became dry, wax based curing compound was sprayed on the surface of concrete. After 24 hours of casting, concrete cubes were cured in a curing tank for 28 days. Compressive strength was determined after 28 days and the average of three readings were reported as the required strength.
5. Proposed Method of Mix Design Procedure
Proposed method of mix design is a combination of empirical results and mathematical calculations based on absolute volume method. The water content is assumed to be inclusive of HRWRA content. The procedure is initiated by selecting different mix characteristics or material proportions in the following sequence:
5.1. Estimation of yield stress and plastic viscosity
On a mix design procedure, trial batches are prepared in the laboratory and workability is measured after arriving at all the ingredients of concrete. If the workability criterion is satisied, cubes or cylinders are cast for compressive strength test. Of desired level of workability is not obtained, adjustments of the constituents of concrete are again made and trial batch is prepared. The fact that rheological parameters are fundamental properties of fresh concrete and compressive strength is the most important hardened property of concrete, the correlation curves between rheological properties and compressive strength of concrete was used in the mix design. The correlation graphs are presented in Figure 2 and 3. The details of the correlation may be found elsewhere14.
5.2. HRWRA dose, sand content
Ot was observed that optimum dose of high range water reducing admixtures (HRWRA) is around 1.5% by weight of cement beyond which it does not signiicantly reduce yield stress and plastic viscosity. For yield stress, the optimum sand content is 30% for minimum yield strength; between 30-40% sand, plastic viscosity is minimum. IS code also assumes sand content equal to 28% when zone 2 (medium) sand is used.
5.3. Water cement ratio and aggregate-paste volume ratio
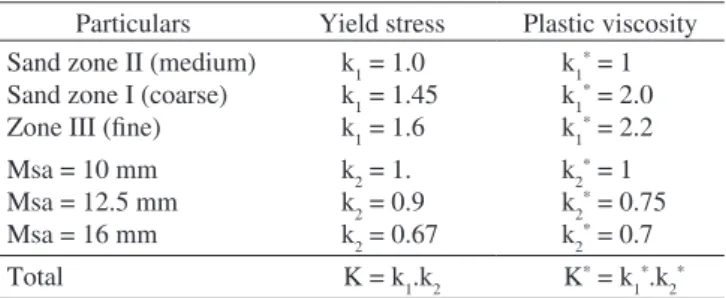
Since water-cement ratio is not a good predictor of strength in case of HPC, relationship between water-cement ratio and compressive strength has not been used. On fact, there may be various combinations of water-cement ratio and paste volume to aggregate volume ratio. The water-cement ratio can be obtained from Figure 4 for a given target strength. Extrapolation may be done to obtain values not presented in the igure.
5.4. Aggregate content
Coarse aggregate content depends on the particle shape. The coarse aggregate content may be determined from Aitcin1.
5.5. Cement content
Cement content may simply be calculated once aggregate volume-paste volume ratio and water-cement ratio is known. Water content here is the free water content including HRWRA.
5.6. Correction factors
Corrections are to be made in the mix design for different zones of sand and maximum size of coarse aggregates. To do this, a reference mix as per OS: 10262-1982 has been considered and rheological parameters of this reference mix were obtained with the present rheometer. The reference mix is follows:
• 53 grade OPC = 571 kg/cu.m;
Figure 3. Variation of compressive strength with plastic viscosity. Figure 2. Variation of compressive strength with yield stress.
Figure 4. Variation of aggregate volume/paste volume ratio with yield stress.
• Indian Standard zone II sand = 436 kg/cu.m;
• Coarse aggregate of nominal size 10 mm = 1083 kg/cu.m; • Water = 200 L/cu. m inclusive of HRWRA;
• PC as HRWRA = 7.7 kg/cu.m; • Water-cement ratio = 0.35; • Percentage sand = 28%.
With the above mix proportion, rheological test was carried out and compressive strength (cube strength) was determined after 28 days of moist curing. Prior to curing by water, wax based curing compound was used after 2 hours from casting up to 24 hours. The laboratory results were as follows:
• τ0 = 235 Pa; µ = 74 Pa.s; Slump = 170 mm and 28 day cube strength = 71.5 MPa.
Example 2: Data:
i) Cement: OPC, sp gr = 3.1, 53 grade as per IS: 12269-1987. ii) Sand: zone III as per IS: 2386-1963, sp gr = 2.6
iii) Coarse aggregate: crushed, 16 mm msa, sp gr = 2.6 iv) HRWRA: Poly-carboxylic ether polymer, no mineral
admixtures.
To design a mix for target strength = 60 MPa.
As illustrated in example 1 above, estimated yield stress = 230 Pa and plastic viscosity = 59 Pa.s. Assuming coarse aggregate = 1085 kg/cu.m and sand = 29%, the inal mix proportions are as follows:
• Cement = 559; • Sand = 444;
• Coarse aggregate = 1085 kg/cu.m;
• Water = 200.7 kg/cu.m including HRWRA; • HRWRA = 7.2 kg/cu.m; Water/cement ratio = 0.36. The laboratory results were as follows:
• τ0 =289 Pa; µ = 56 Pa.s; Slump = 180 mm and 28 day cube strength = 62.6 MPa.
Example 3: Data:
i) Cement: OPC, sp gr = 3.1, 53 grade as per IS: 12269-1987. ii) Sand: zone III as per IS: 2386-1963, sp gr = 2.6
iii) Coarse aggregate: crushed, 16 mm msa, sp gr = 2.6 iv) HRWRA: Poly-carboxylic ether polymer, no mineral
admixtures.
To design a mix for target strength = 45 MPa.
Estimated yield stress = 110 Pa and plastic viscosity = 41 Pa.s. Assuming coarse aggregate = 1035 kg/cu.m and sand = 33%, the inal mix proportions are as follows:
• Cement = 545; Sand = 516; • Coarse aggregate = 1035 kg/cu.m; • Water = 207 kg/cu.m including HRWRA; • HRWRA = 8.2 kg/cu.m;
• Water/cement ratio = 0.38.
The laboratory results were as follows:
• τ0 = 160 Pa; µ = 49 Pa.s; Slump = 170 mm and 28 day cube strength = 46.2 MPa.
Ot may be mentioned that above mix proportion has been arrived at on the assumption that aggregates are saturated and surface dry. For any deviation from this condition, correction has to be applied on quantity of water as well as to the aggregate. The calculated mix proportions shall be checked by means of trial batches. A minor adjustment in aggregate quantity may be made to improve the inishing quality or freedom from segregation and bleeding.
7. Conclusion
A mix design procedure for HPC has been suggested. The proposed mix design procedure takes rheological parameters in to account to determine compressive strength, water cement ratio and aggregate volume to paste volume ratio. Onstead of using water-cement ratio and compressive strength relationship, relationship between compressive strength, paste volume-aggregate volume ratio, physical properties of aggregates and rheological parameters were used in mix design. Correlation charts for rheological parameters and compressive strength was developed based on cube test results of several trial mixes whose rheological parameters have also been found by the present experimental results of the variation of rheological parameters with
sand gradation and maximum size of coarse aggregates. The steps of present mix design procedure are as follows: • Assume sand = 28% and take air content as follows: • For 10 mm nominal maximum size of aggregate (Msa):
air = 3%
• 12.5 and 16 mm: air = 2.5% • 20 mm: air = 2%.
These are as per the provisions of OS: 10262-1982. • Assume HRWRA dose = 1.5% by weight of cement. • From Figure 2 and Figure 3, read τ0, µ for target given strength. • Calculate correction factors: K = k1k2, K* = k
1 * k
2
* from Table 3.
• Corresponding to Kτ0, obtain aggregate volume- paste volume
ratio from Figure 4 and choose water-cement ratio.
• Assume quantities of coarse aggregate from Aitcin1, depending
on particle shape.
• Calculate cement and water content.
6. Examples of Mix Design of HPC Using Proposed
Method
Example 1: Data:
i) Cement: OPC, sp gravity = 3.1, 53 grade as per IS: 12269-1987. ii) Sand: zone II as per IS: 2386-1963, sp gr = 2.6
iii) Coarse aggregate: crushed, 10 mm msa, sp gr = 2.6 iv) HRWRA: Poly-carboxylic ether polymer, no mineral
admixtures.
To design a mix for target strength = 70 MPa. a) Assume air content = 3.0 %, PC = 1.5% bwc,
b) From Figure 2 and Figure 3, obtain values of yield stress and plastic viscosity for 70 MPa as τ0 = 310 Pa; µ = 60 Pa.s. c) Calculate Kτ0 = 1.0 × 1.0 × 310 = 310 Pa,
K*µ = 1.0 × 1.0 × 60 = 60 Pa.s from Table 3.
d) Refer Figure 4, take w/c ratio = 0.35;
Aggregate-paste volume ratio at w/c ratio = 0.35 and Kτ0 = 310 Pa is approximately equal to 1.52.
e) Assume coarse aggregate content = 1085 kg/cu.m and sand = 435 kg/cu.m so that sand = 28%.
f) Substitute sand and coarse aggregate content in the following expression:
1.52
fine coarse
cement water air
V V
V V V
+
=
+ + (5)
The inal proportions of the ingredients (kg/cu.m) are as follows: • Cement = 573;
• Sand = 435;
• Coarse aggregate = 1085 kg/cu.m;
• Water = 200.5 kg/cu.m including HRWRA; • HRWRA = 8.6 kg/cu.m
• Water/cement ratio = 0.35. Table 3. Correction factors for τ0 and µ.
Particulars Yield stress Plastic viscosity Sand zone OO (medium)
Sand zone O (coarse) Zone III (ine)
k1 = 1.0 k1 = 1.45 k1 = 1.6
k1* = 1
k1* = 2.0
k1* = 2.2
Msa = 10 mm Msa = 12.5 mm Msa = 16 mm
k2 = 1. k2 = 0.9 k2 = 0.67
k2* = 1
k2* = 0.75
k2* = 0.7
Total K = k1.k2 K* = k
1 *.k
4. Tattersall GH. Workability and Quality Control of Concrete. London: E&FN Spon; 1991.
5. Tattersall GH and Banfill PFG. The Rheology of Fresh Concrete.
Marshield: Pitman Publishing; 1983.
6. Tattersall GH. The Workability of concrete. Portland Cement Association; 1976.
7. de Larrard F, Szitkar F, Hu JC and Joly M. Design of a Rheometer for
fluid concrete, Special Concrete-Workability and Mixing. ROLEM; 1993.
p. 201-208.
8. Beaupre B. Rheology of High Performance Shotcrete. [Tese]. Vancouver: University of British Columbia; 1994.
9. Shah SP and Ahmad SH. High performance concrete: Properties and application. McGraw Hill Onc.; 1994.
10. Ondian Standard - OS. IS 10262-1982: Code of Practice for Mix design of Concrete. New Delhi: OS; 1982.
11. Ondian Standard - OS. IS 12269-1987: Speciications for 53 Grade Ordinary
Portland Cement. New Delhi: OS; 1987.
12. Ondian Standard - OS. IS 2386-1997: Methods of Tests for Aggregates for Concrete. New Delhi: OS; 1997.
13. Laskar AO and Talukdar S. Design of a new rheometer for concrete. Journal of ASTM International, American Institute of Physics. 2008; 5(1).
http://dx.doi.org/10.1520/JAI101096
14. Laskar AO and Talukdar S. Correlation between Compressive Strength and Rheological Parameters of High-Performance Concrete. Research
Letters in Material Science. 2007; 2007. Article ID 45869. http://dx.doi.
org/doi:10.1155/2007/45869 rheometer. The ranges of Bingham parameters and compressive
strength studied in the present investigation are as follows: • Yield stress: 40- 820 Pa;
• Plastic viscosity: 15- 120 Pa.s;
• Compressive strength (28 day): 40-90 MPa.
It is to be mentioned that it is always dificult to develop a mix design method that can be used universally because same properties of fresh and hardened concrete can be achieved in different ways from same materials. Since materials from different sources can vary widely in their composition and physical characteristics, a trend drawn from data for a single material source should not be extended to all material sources. On fact, a broad range of data from various sources is desirable for drawing general conclusions. The method discussed in this paper is related to calculation of the composition of concrete containing poly-carboxylic ether polymer as HRWRA without incorporating any mineral admixture.
References
1. Aitcin PC. High Performance Concrete. London: E & FN Spon; 1988.
2. Mehta PK and Aitcin PC. Microstructural basis of selection of materials and mix proportion for high strength concrete. On: Proceedings of the 2th
International Sym on High Strength Concrete; 1990; Detroit. American
Concrete Onstitute; 1990. p. 265-286.