DOI: http://dx.doi.org/10.1590/1980-5373-MR-2016-0766
Rheological Characterization of Bentonite Dispersions with Xanthan for Oil Well
Drilling Fluids
Gabriel Sahade de Souzaa*, Samuel Luporinib, Isabel Cristina Rigolic
Received: October 10, 2016; Revised: April 11, 2017; Accepted: May 21, 2017
Shear tests using a coaxial cylinders viscometer were performed in order to determine the rheological and thixotropic properties of xanthan gum dispersions with sodium bentonite in the presence of high salt
concentrations of sodium and calcium chlorides. The dispersions rheology with diferent temperatures
and concentrations of NaCl, CaCl2 and xanthan gum were prepared by ixing the bentonite concentration
of 1%. The dispersions showed a good it to power law model through linear regressions with the lowest coeicient of determination value of 0,98. A screening was made initially to decide which independent variables potentially afect the rheological and thixotropic parameters. The independent variables were
temperature, the xanthan gum and sodium and calcium chlorides concentrations. Then a full factorial design in duplicate with the remaining variables on the same tracks was performed. The results eliminated calcium chloride as an independent variable and revealed a strong dependence of the rheological and thixotropic parameters with temperature and xanthan gum and NaCl concentrations.
Keywords: Rheology, Xanthan gum, Drilling luids
* e-mail: [email protected]
1. Introduction
The well drilling is a process that aims not only to
produce oil and gas, but also the injection of luids to assist
in the recovery of hydrocarbons.
In the current national scene, most of the oil and gas
discovered can only be accessed by drilling ofshore wells. The drilling luid has a critical role in achieving this goal,
so that it should meet operational, environmental and economic demands.
Drilling luids are complex mixtures of solids, liquids,
chemicals, and sometimes even gases. From a chemical
point of view, drilling luids can assume aspects of colloidal
dispersion or emulsion, depending on the physical state of its components1. They are traditionally classiied according to their base, which may be aqueous, non-aqueous, or gaseous.
Nowadays drilling luids have been the subject of several
discussions between researchers, oil industry companies and environmental agencies. The main point of discussion
is to ind solutions to problems caused by environmental
contamination and geological formations bearing oil or
water (aquifers). Aqueous luids are generally much less aggressive to the environment than non-aqueous, usually discarded into the sea, when drilling ofshore wells.
The primary functions of drilling luids are removing and carrying the drilled rock fragments (cuttings), controling
formation pressures and maintaining well stability. The
rheological and thixotropic properties of drilling luids are very important for them to perform efectively their functions2.
Bentonite is a clay used in aqueous based drilling luids in order to control their rheological and iltration properties. An increase in viscosity of the drilling luid is closely related to
a good transport downhole cuttings to the surface. However,
the use of bentonite as viscosiier should be done with caution.
High concentrations of this additive may cause problems,
such as increasing column prison chances and torque of the
drilling string due to friction3. To increase the viscosity of the luid without increasing the concentration of bentonite,
other viscosifying polymer additives are used as well. One of the major polymers used in conjunction with bentonite is xanthan gum.
Xanthan gum is a biopolymer used in the petroleum industry whose main objective is to increase the viscosity
of aqueous based drilling luids. Its high eiciency under
conditions of high temperatures and salinity makes this polymer one of the most commonly used viscosifying agent
in drilling luids4.
Rheology is the study of deformation and low of materials.
The rheological model used in this study to characterize
the luid low was power law model, shown in Equation 1 a Universidade Petrobras, Petróleo Brasileiro S.A. 41850-903, Salvador, BA, Brazil
b Laboratory of Polymer Engineering (Lepol), Chemical Engineering Department, Universidade
Federal da Bahia - UFBA, 40210-630, Salvador, BA, Brazil
c Physical Chemistry Department,Chemistry Institute, Universidade Federal da Bahia - UFBA,
40170-115, Salvador, BA, Brazil
.
( )
k
n1
x
=
c
o
Where “τ” is the shear stress, “k” is the low consistency
Thixotropy is the phenomenon of gelation of the luid
when left for a certain period of static and its return to its
luid state when subjected to shear stress. The two main
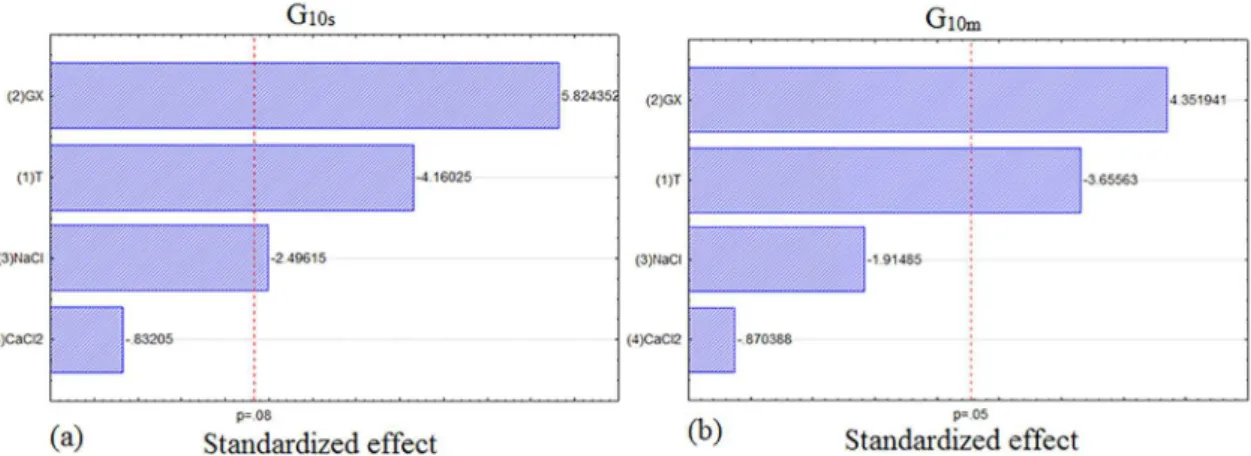
thixotropic parameters used in the petroleum industry are the initial gel strength (G10s) and the inal gel strength (G10m) representing, respectively, the magnitudes of gelation forces
the luid undergoes within a period of ten seconds and ten
minutes5. This property is important for drilling luids because
it prevents cuttings decantation downhole in static periods1. The current study aims to investigate the efects of
temperature and concentrations of monovalent and divalent ions in the rheological (“k” and “n”) and thixotropic (G10s and G10m) parameters of xanthan gum with bentonite dispersions
in order to use this polymer as a viscosifying agent in aqueous based drilling luids.
2. Materials and Methods
Xanthan gum (Sigma-Aldrich, USA), sodium chloride (Quimis with 99% PA), calcium chloride dihydrate (Quimis with 99% PA), sodium bentonite (DRESCON SA) and deionized
water were used as raw materials to prepare the samples. The physical and chemical characteristics of xanthan gum and sodium bentonite are shown in Tables 1 and 2, respectively.
The screening step was a fractional factorial design 2(4-1) with a center point. The screening input variables were the
concentrations of xanthan gum (XG), sodium (NaCl) and
calcium (CaCl2) chlorides and the temperature (T). The
output variables were the low consistency (k) and low
behavior (n) indexes (rheological parameters) and the initial
and inal gels forces (thixotropic parameters). This process
was made in order to minimize the number of complete analysis experiments7.
With the result of the screening stage, it was made a full factorial design 2³ with the remaining variables with two center points. Table 3 shows the real and coded variables
(temperature and mass concentrations) for both performed
plans. STATISTICA 7.0® was used in both designs.
Table 1. Characteristics of xanthan gum.
Characteristic Values
Molecular Weight estimated (g.gmol-1) 4 x 10⁶
Acetate content (%) 3,53
Pyruvate content (%) 0,9
Viscosity (Brookield @ 1%) (cP) 800 - 1200
Table 2. Characteristics of sodium bentonite.
Characteristic Values
Humidity (%) 10
Granulometry 200 Mesh (%) 5 - 9
pH 9 - 10
The Fann 35A viscometer was used for measurement of rheological and thixotropic parameters. Samples were
prepared in Hammilton Beach stirrer model 936 with 13000
rpm for 5 minutes each addition of components6. After
preparation the dispersions were stored at approximately 3ºC for a period of 24 hours before use.
During the preparation of samples both xanthan gum
as bentonite were dispersed in aqueous medium prior to
placement of the salts in the system in order to facilitate hydration of the viscosifying agents.
The methodology of this study is divided into two parts.
A sorting step and, subsequently, a thorough planning.
Table 3. Factorial design variables and levels, where (-1) is the lower level; (0), the midpoint; and (+1), the upper one.
Level GX (%) T (ºC) NaCl (%) CaCl2 (%)
-1 0,39 25 11,58 0,373
0 0,43 50 12,86 0,414
+1 0,47 75 14,14 0,455
The chosen ranges of independent variables were selected
according to the drilling luids composition usually found in the ield during drilling operations. The concentration
of bentonite was kept constant at 1% as suggested by the literature. Fluids with bentonite concentrations greater than
1% present signiicant yield shear stress, which changes the
power law model used4.
The codiied mathematical model for the 2³ factorial design is displayed in Equation 2, where Y is the response (rheological or thixotropic parameter), xi are the input
variables, b0is the global mean and bi and bijare regression
coeicients.
The variance analysis (ANOVA) was performed to determine the signiicance at a 95% conidence limit for each
parameter (k, n, G10s and G10m) and the the response surface methodology was used in order to evaluate the thixotropic and reological parameters behaviours7.
Analysis of Variances (ANOVA) is a statistical method that is used for assessing relationships and diferences among the means of two or several data sets. The signiicant level
of the data sets is determined by evaluating the F-Statistic and comparing it to the F- critical value for the samples. If
the F-Statistic (F) is larger than F-critical, in other words,
the ratio F/F-critical is greater than 1.0, then the variation
between the groups is statistically signiicant. The level of signiicance (α) used in this research was 0.05.
( )
Y
b
b
b
b
b
b
b
2
0 1 1 2 2 3 3
12 1 2 13 1 3 23 2 3
\
\
\
\ \
\ \
\ \
=
+
+
+
+
3. Results and Discussions
The fractional factorial design 2(4-1) with one center point and its measures are shown in Table 4 below. As can be seen
by Pareto charts in Figures 1 and 2, both rheological and thixotropic parameters are not inluenced by the concentration of calcium chloride at a conidence level of 95%. Therefore, the
calcium chloride concentration was ignored in the next step.
After calcium chloride elimination as an independent variable, a complete factorial design 2³ in duplicate with two central points was performed. Its results are shown in Table 5.
For a complete study, an analysis of variance (ANOVA)
for each of the output variables was made. As displayed in Table 6, in the case of variance analysis of temperature, the ratio F/F-critical is greater than 1.0 and also, the p-value is
smaller than the assumed value (α) of 0.05. The same can
Table 4. Fraction factorial design 2(4-1).
T GX NaCl CaCl2 n k (Pa.sn) G
10s (Pa) G10m (Pa)
-1 -1 -1 -1 0,324 1,180 4,0 6,0
+1 -1 -1 +1 0,345 0,882 3,0 4,5
-1 +1 -1 +1 0,290 2,169 6,0 10,0
+1 +1 -1 -1 0,269 1,629 4,5 7,0
-1 -1 +1 +1 0,353 0,866 3,0 4,5
+1 -1 +1 -1 0,386 0,578 2,5 3,5
-1 +1 +1 -1 0,294 1,897 5,5 9,5
+1 +1 +1 +1 0,342 1,003 3,5 4,5
0 0 0 0 0,319 1,293 4,5 6,0
Figure 1. Pareto charts for low consistency (a) and low behavior (b) indexes with a conidence level of 95%.
Table 6. ANOVA analysis of low index (n).
Source of variation SS df MS F/F-critical p-value
Temperature (T) 0.003 1 0.003 11.9 0.000
Xanthan Gum (XG) 0.008 1 0.008 27.2 0.000
NaCl 0.004 1 0.004 12.7 0.000
T x XG 0.000 1 0.000 0.0 0.959
T x NaCl 0.001 1 0.001 2.0 0.033
XG x NaCl 0.000 1 0.000 0.9 0.128
Error 0.001 11 0.000 R²
Total 0.017 17 - 0.937
Table 5. Complete factorial design 2 with two center points.
T GX NaCl n k (Pa.sn) G10s (Pa) G10m (Pa)
-1 -1 -1 0,324 1,180 4,0 6,0
+1 -1 -1 0,345 0,882 3,0 4,5
-1 +1 -1 0,290 2,169 6,0 10,0
+1 +1 -1 0,269 1,629 4,5 7,0
-1 -1 +1 0,353 0,866 3,0 4,5
+1 -1 +1 0,386 0,578 2,5 3,5
-1 +1 +1 0,294 1,897 5,5 9,5
+1 +1 +1 0,342 1,003 3,5 4,5
0 0 0 0,319 1,293 4,5 6,0
-1 -1 -1 0,323 1,167 4,0 5,5
+1 -1 -1 0,349 0,878 3,0 4,5
-1 +1 -1 0,304 2,034 6,5 10,0
+1 +1 -1 0,293 1,534 4,5 6,5
-1 -1 +1 0,307 1,210 3,5 4,5
+1 -1 +1 0,340 0,710 2,5 4,0
-1 +1 +1 0,306 1,860 6,0 9,5
+1 +1 +1 0,348 0,996 4,0 5,0
0 0 0 0,330 1,250 5,0 6,5
be seen for xanthan gum and NaCl concentrations and the interaction of temperature with NaCl concentration. In the case of variance analysis of interactions of xanthan gum concentration with temperature and NaCl concentration, the ratios F/F-critical are smaller than 1.0 and also, the
p-values are higher than the assumed value (α). It can be concluded that the efects of temperature, xanthan gum and
NaCl concentrations and the interaction of temperature with
NaCl concentration are signiicant, whereas the interactions
of xanthan gum concentration with temperature and NaCl
concentration have no signiicance on “n”.
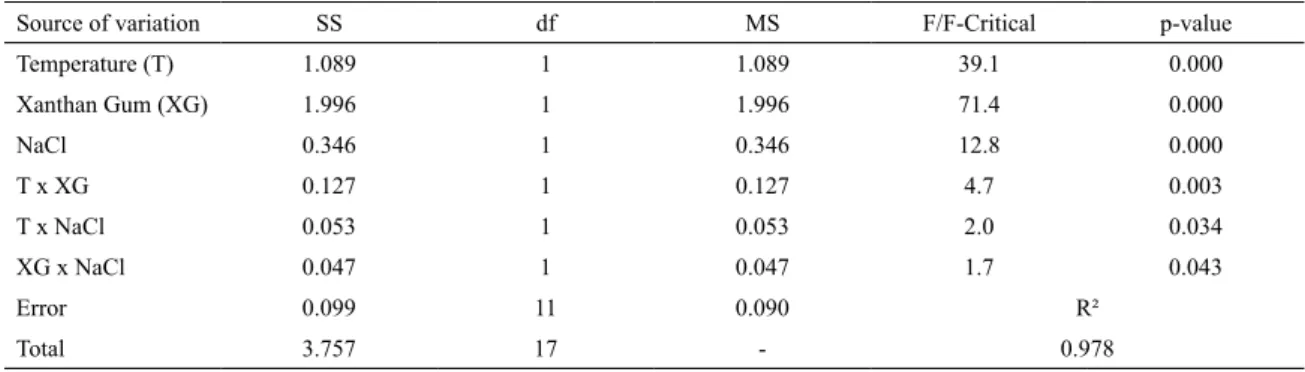
Tables 7-9 present the analysis of low consistency index, initial and inal gel strenghts, respectively. From multivariate
regressions, we can generate analytical expressions that
quantitatively correlates input variables encoded (temperature, xanthan gum and NaCl concentrations) with the output
variables (n, k, G10s and G10m), such as Equations 3, 4, 5 and 6.
,
,
.
,
.
,
.
,
. .
( )
n
T
GX
NaCl
T NaCl
0 325
0 014
0 022
0 015
0 006
3
=
+
-
+
+
,
,
.
,
.
,
.
,
. .
( )
,
. .
,
.
.
k
T
XG
NaCl
T XG
T NaCl
XG NaCl
1 287
0 261
0 353
0 147
0 089
4
0 058
0 054
=
-
+
--
-,
,
.
,
.
,
.
,
. .
( )
G
T
GX
NaCl
T GX
8 389
1 375
1 875
0 625
0 500
5
S
10
+
-
+
-,
,
.
,
.
,
.
,
. .
( )
G
T
GX
NaCl
T GX
12 389
2 500
3 125
1 125
1 500
6
m
10
=
-
+
-As seen in Tables 6-9, the correlation coeicients values were greater than 0.937 for all output variables, indicating that there is a good it for all models. Not all efects were signiicant for all parameters at a conidence level of 95%.
As discussed before, not all efects were signiicant for low behavior index at a signiicance level of 95%.
Interactions of xanthan gum concentration with temperature
Table 7. ANOVA analysis of low consistency index (k).
Source of variation SS df MS F/F-Critical p-value
Temperature (T) 1.089 1 1.089 39.1 0.000
Xanthan Gum (XG) 1.996 1 1.996 71.4 0.000
NaCl 0.346 1 0.346 12.8 0.000
T x XG 0.127 1 0.127 4.7 0.003
T x NaCl 0.053 1 0.053 2.0 0.034
XG x NaCl 0.047 1 0.047 1.7 0.043
Error 0.099 11 0.090 R²
Total 3.757 17 - 0.978
Table 8. ANOVA analysis of initial gel strenght (G10s).
Source of variation SS df MS F/F-critical p-value
Temperature (T) 30.250 1 30.250 20.1 0.000
Xanthan Gum (XG) 56.250 1 56.250 37.3 0.000
NaCl 6.250 1 6.250 4.1 0.005
T x XG 4.000 1 4.000 2.7 0.017
T x NaCl 0.000 1 0.000 0.0 1.000
XG x NaCl 0.000 1 0.000 0.0 1.000
Error 5.528 11 0.503 R²
Total 102.278 17 - 0.946
Table 9. ANOVA analysis of inal gel strenght (G10m).
Source of variation SS df MS F/F-critical p-value
Temperature (T) 100.000 1 100.000 56.1 0.000
Xanthan Gum (XG) 156.250 1 156.250 87.8 0.000
NaCl 20.250 1 20.250 11.3 0.000
T x XG 36.000 1 36.000 20.3 0.000
T x NaCl 1.000 1 1.000 0.5 0.221
XG x NaCl 0.250 1 0.250 0.3 0.523
Temperature (T) 6.528 11 0.593 R²
Total 320.278 17 - 0.980
Thus, these sources of variation did not appear in the inal generated model (Equation 3). As shown in Figure 3, “n”
increases with decreasing xanthan gum concentration and with increasing temperature and NaCl concentration.
It is reported that the pseudoplastic behavior of the macromolecule solution could be ascribed to the disentanglement of its long chain molecules, which reduces the intermolecular
resistance to low under shear conditions8.
When there is aggregation of the particles in a colloidal system, an increase in shear rate tends to result in fragmentation of these aggregates, resulting in a decrease in apparent viscosity. An increase in temperature causes the kinetic energy of the molecules to increase, hindering the formation of these aggregates and decreasing therefore the
luid pseudoplasticity.
With the increase of ionic strength on the system from increasing electrolytes concentration (Na+), there is a decrease in hydrodynamic volume of xanthan gum. Since there is a
smaller volume of polymer for intermolecular interactions, the molecular clusters formed at low shear rates are weaker, decreasing the dispersion pseudoplasticity9.
According to p-values and F/F-critical ratios shown in
Table 7, all efects were signiicant at a signiicance level of 95%. Therefore, all variables inluence “k” and were taken into account in the generated model, as seen in Equation 4.
A xanthan gum concentration increase causes a gain
in the low consistency index value as shown in Figure 4. This parameter indicates the degree of luid low resistance.
The higher the value of “k”, the higher the viscosity of the
luid10,11. As a viscosifying agent, an increase in the polymer
concentration favors the intermolecular and cross link
interactions due to the efective increase in the macromolecule
dimensions and molar mass12.
charges on the polymer chain. The extended coniguration of
xanthan gum chains are closely related with some rheological properties of solutions with this polymer. In xantham gum solutions with NaCl, the addition of counter ions allows the chain of xanthan gum to order and assume a smaller, more compact structure. The degree of shrinkage depends on the chain rigidity. In these solutions, the compact polymer
chains lead to a reduction in the resistance to low, ie, the
consistency index and apparent viscosity13.
As in the low behavior index analysis, not all efects were signiicant at the 95% conidence level for the thixotropic parameters (tables 8 and 9). This means that not all efects were
taken into account in the generated models for the initial and
inal gel strength as shown in Equations 5 and 6 respectively.
As can be seen in Figures 5 and 6, the two thixotropic parameters increase with increasing xanthan gum concentration and decreases with increasing temperature and NaCl concentration.
Figure 3. Response surfaces for "n" by setting the NaCl concentration (a), xanthan gum concentration (b) and temperature (c).
Figure 4. Response surfaces for "k" by setting the NaCl concentration (a), xanthan gum concentration (b) and temperature (c).
Figure 6. Response surfaces for "G10m" by setting the NaCl concentration(a), xanthan gum concentration (b) and temperature (c).
Increasing the salinity solution reduces the thixotropic parameters of xanthan gum. This reduction depends on the type of salt and the type of polymer microorganism producer.
Increasing the salt concentration in solution modiies the
gel-like structure formed during the static period. For the
concentration range examined, this modiication reduces
gel formation14.
The bentonite interactions with electrolytes is another reason why there is a variation of these parameters. The thixotropy reduction due to presence of bentonite is attributed to clay particles aggregation in order to buid gel structures. The electrolyte addition causes a change in these structures due to compression of the electrical double layer due to the presence of Na+ ions. The addition of salt leads to a decrease of the shear stress for a given range of shear rate15.
Once the electric double layer forces are related to gel structure formations, a change in the electric double layer
relects in changes in the luid behavior. The reduction of the
shear stresses is attributed to compression of the double layer that supports the entire bentonite clay particles structure5.
4. Conclusion
The screening step results showed that the calcium
chloride does not inluence signiicantly neither thixotropic
nor rheological parameters.
After selection of variables, a full factorial design 2³
showed that both consistency and low behavior indexes are inluenced by temperature, xanthan gum and sodium chloride concentrations, as well as some of their irst order
interactions. The increase of temperature and sodium chloride concentration resulted in an increase in “n”, reducing the luid pseudoplasticity and caused a decrease in “k”. Increasing
xanthan gum concentration caused the opposite efect: a
reduction in “n” and a increasing in “k”.
In the same design, the thixotropic parameters also showed dependence of the three independent variables. The increase of temperature and sodium chloride concentration led
to a decrease in the thixotropic parameters while increasing xanthan gum concentration caused an increase on them.
5. Acknowledgment
The authors would like to acknowledge Universidade Federal da Bahia for their support and encouragements.
6. References
1. Thomas JE. Fundamentos de Engenharia de Petróleo. Rio de Janeiro: Interciência; 2004.
2. Petrobras. Manual de Fluidos. Rio de Janeiro: Petrobras; 2011.
3. Amorin LV, Farias KV, Barbosa MIR, Pereira E, França KB, Lira HL, et al. Fluidos de perfuração de base água. Parte I: Efeitos de aditivações poliméricas nas propriedades reológicas.
Cerâmica. 2005;51(318):128-138. DOI:
10.1590/S0366-69132005000200010
4. M-I SWACO. Engineering Drilling Fluids Manual. Houston: Schlumberger; 2001.
5. Gray GR, Darley H. Fluidos de perfuração e completação. Rio
de Janeiro: Elsevier; 2014.
6. American Petroleum Institute. API 13B1: Recommended Practice
for Field Testing Water-based Drilling Fluids. Washington:
American Petroleum Institute; 2014.
7. Box G, Hunter W, Hunter JS. Statistics for experimenters:
An introduction to design, data analysis and model building.
Hobboken: John Wiley & Sons; 1978.
8. Wang B, Wang LJ, Li D, Özkan N, Li SJ, Mao ZH. Rheological
properties of waxy maize starch and xanthan gum mixtures in the presence of sucrose. Carbohydrate Polymers.
2009;77(3):472-481. DOI: 10.1016/j.carbpol.2009.01.017
9. Heyman B, De Hertogh D, der Meeren PV, Depypere F, Dewettinck K. Inluence of xanthan transition on the rheological properties
of waxy starches. Carbohydrate Polymers. 2013;96(2):568-577. DOI: 10.1016/j.carbpol.2012.10.077
10. Borges CD, Vendruscolo CT, Martins AL, Lomba RFT.
Comportamento reológico de xantana produzida por Xanthomonas
de poços de petróleo. Polímeros. 2009;19(2):160-165. DOI: 10.1590/S0104-14282009000200015
11. Assis DJ. Inluência da aeração e agitação nas propriedades
das gomas xantana produzidas por Xanthomonas campestris mangiferaeindicae 2103 com glicerina residual do biodiesel: otimização e cinética do bioprocesso. [Master’s dissertation]. Salvador: Universidade Federal da Bahia; 2013.
12. Xu L, Xu G, Liu T, Chen Y, Gong H. The comparison of rheological properties of aqueous welan gum and xanthan gum
solutions. Carbohydrate Polymers. 2013;92(1):516-522. DOI:
10.1016/j.carbpol.2012.09.082
13. Hong CH, Choi HJ, Zhang K, Renou F, Crisel M. Efect of salt
on turbulent drag reduction of xanthan gum. Carbohydrate
Polymers. 2015;121:342-347. DOI: 10.1016/j.carbpol.2014.12.015
14. Achayuthakan P, Suphantharika M. Pasting and rheological properties of waxy corn starch as afected by guar gum and
xanthan gum. Carbohydrate Polymers. 2008;71(1):9-17. DOI: 10.1016/j.carbpol.2007.05.006
15. Souza GS. Caracterização reológica de dispersões argilosas
com goma xantana para luidos de perfuração de poços de petróleo: inluência de sais monovalentes, bivalentes e da
temperatura. [Master’s dissertation]. Salvador: Universidade