ISSN 0104-6632 Printed in Brazil
Brazilian Journal
of Chemical
Engineering
Vol. 21, No. 01, pp. 83 - 91, January - March 2004
TREATMENT OF MILK INDUSTRY EFFLUENT BY
DISSOLVED AIR FLOTATION
H. J .B. Couto, M. V. Melo, and G. Massarani
*Programa de Engenharia Química / COPPE, Universidade Federal do Rio de Janeiro, Cidade Universitária, Cx.P. 68502, 21945-970, Phone: +55 (21) 2562-8345,
Fax: +55 (21) 2290-6626, Rio de Janeiro - RJ, Brazil. E-mail: gmassa@peq.coppe.ufrj.br
(Received: April 15, 2003 ; Accepted: July 7, 2003)
Abstract- In this work, the application of the flotation technique by dissolved air (FAD) to the treatment of milk industry effluent (milky effluent) is analyzed. Initially, batch studies were carried out in a column built of acrylic with an external diameter of 2.5 cm and 50 cm in height. Afterwards, the performance of a flotation tank with a 5.5 L capacity in the treatment of the milky effluent was addressed. In continuous mode of operation, separation efficiencies up to 90% were obtained for the experiments carried out at a saturation pressure of 4 atm and having a ratio of feed flow rate (Qa) to saturated liquid flow rate equal to 1. The separation efficiency for
flocculated milk was estimated from the overall mass balance for the flotation tank. Separation efficiencies obtained agreed very well with the experimental results collected for Qa/QLs ratios lower than 1.
Keywords: dissolved air flotation, effluent treatment, modeling.
INTRODUCTION
In the past several decades, environmental legislation has reflected the growing concern with the general disposal of liquid effluents. Within this context, flotation, a well-known technique for concentration of phases in the mineral processing industries, has aroused great interest for the treatment of liquid effluents, especially of those in which the difference between the phase densities is small. Flotation by dissolved air (FAD) is a process whereby all or part of the effluent to be treated has been previously saturated with air in a tank under pressure. Next, the liquid effluent saturated with air is discharged into the flotation equipment through a valve, where it undergoes sudden decompression, giving rise to small air bubbles (in the range of 10-120 µm) and producing the flotation process (Richter, 1976).
In FAD processes, the air bubbles generated have average diameters smaller than those obtained by the flotation by induced air (FAI) technique. This fact is of great interest in flotation, since smaller average
diameters produce higher bubble-particle collision efficiency, resulting in a mores efficient in the flotation process.
Therefore, in this work an evaluation of the FAD technique in the treatment of liquid effluent from the milk industry (milky effluent) is proposed. Initially, experimental work is conducted in a batch flotation column built of acrylic (external diameter of 2.5 cm and 50 cm in height) and then the continuos operation of a flotation tank (with capacity of 5.5 L) for milky effluent is studied.
MATERIALS AND METHODS
Pressurization System
pressure regulating valve (DOVER, model number 014RPE000). The saturated water is discharged through a needle valve into the flotation equipment, undergoing sudden decompression and producing micro air bubbles. The saturated liquid is then sent to the flotation column or tank, where the micro air bubbles formed produce the flotation process.
Batch Operation Unit
The initial work on the effluent treatment was
carried out batchwise, using a flotation column built of acrylic as shown in Figure 2.
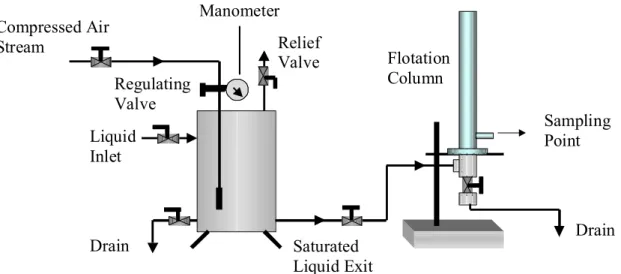
The column has been previously loaded with the effluent from the top. Next, the liquid saturated with air from the tank is discharged into the column, producing the flotation process. After 5 minutes of operation, the time necessary to complete the flotation process, samples of treated (clarified) effluent are collected for analysis by spectrophotomety.
Li quid Inlet
Ball Valve
Drain Compressed Air Stream
Manometer
Relief Valve
Saturated Liquid Exit Regulating
Valve
Porous Distributor
Needle Valve
Figure 1: Pressurization tank (40cm in height and diameter of 16cm).
Compressed Air Stream
Manometer
Relief Valve Regulating
Valve
Liquid Inlet
Drain Saturated
Liquid Exit
Flotation Column
Sampling Point
Drain
Continuous Operation Unit
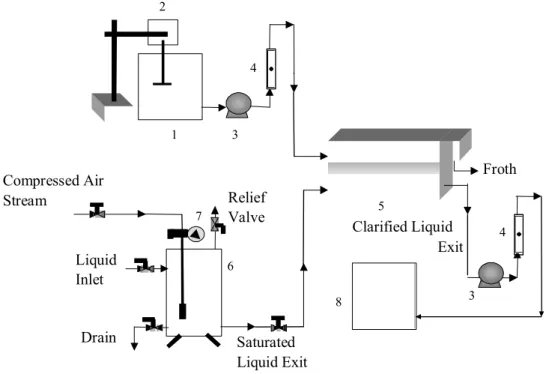
Figure 3 illustrates the experimental unit using a flotation tank for the continuous treatment of milky effluent. The unit is basically composed of a feed tank, a tank for treated effluent, a stirrer (QUIMIS), two peristaltic pumps (Cole & Parmer), pressurization system, two rotameters (AALBORG Instruments) to measure feed and clarified effluent flow rates, and a flotation tank with a capacity of 5.5 L.
The unit is started up batchwise and operated continuously until a suitable clarified effluent concentration is obtained. Next, the peristaltic pumps start up so that a saturated liquid flow rate is kept constant until the end of the experiment. Samples of clarified effluent are taken during the experiment until steady state is reached. The sum of the saturated
liquid flow rate and the feed flow rate are kept constant so that during process start up the volume in the tank also remains constant.
Preparation of the Milky Effluent
The synthetic milky effluent used in this work is prepared by adding milk powder to water under mechanical stirring in order to obtain a homogeneous concentration suspension of 0.1% w/v. The precipitation of milk proteins and fat (lipids) is achieved through the slow addition of a diluted aqueous solution of hydrogen chloride (1:10 volumetric basis) until the hydrogen potential for the isoelectric point is attained (pH ≈ 4.6). Table 1 provides the average composition of the milk powder used in this work.
1 2
4
4
3 3
5
6 7
8 Compressed Air
Stream Relief
Valve
Liquid Inlet
Drain Saturated
Liquid Exit
Froth
Clarified Liquid Exit
Figure 3: Continuous flotation unit (1 - Feed tank; 2 - Stirrer; 3 - Peristaltic pumps; 4 - Rotameters; 5 - Flotation tank; 6 - Pressurizing tank; 7 - Manometer; 8 - Treated effluent tank).
Table 1: Specifications of milk powder ELEGÊ ALIMENTOS S.A., Teutônia - RS, Brazil.
Average composition per 100g of milk powder
Lipids 26.0g
Proteins 26.0g
Glicids 38.0g
Ash 7.0g
Experimental Methodology
a) Characterization of the Flocks in the Effluent Characterization of the flocks formed by precipitation of the effluent milk proteins and fat follows the procedure presented by Puget et al. (2001), since they used the same milky effluent in their research.
b) Determination of the Average Bubble Diameter
Average bubble diameter (Db) was estimated from the fluid dynamics correlations, according to the work presented by Couto et al. at ENEMP (2002).
c) Determination of the Milk Concentration
The milk concentration is determined using a spectrophotometer (Micronal B380) at a wavelength of 600 nm, by means of prior calibration of the equipment with standard milk concentrations, which in turn have specific absorbances. It is worth mentioning that, for the measurement of absorbances of flocculent milk suspensions, vigorous stirring is necessary in order to completely break up the flocks.
d) Determination of Flow Rate
The feed and clarified liquid (exit) flow rates in the continuous flotation tank were determined directly using rotameters. The saturated liquid flow rate was determined by consecutive measurements of the volume discharged with time.
Separation Efficiency (η)
This parameter is calculated as a function of the milk concentration in the feed and clarified effluent flow streams and the effluent volume in the flotation chamber both at the beginning and at the end of the experiment. Equation 1 defines the separation efficiency:
a o C V
(%) 1 100
C V
⋅
η = − ⋅
⋅
(1)
where Ca and C represent the milk concentration in the feed and clarified effluent flow streams, respectively, and Vo and V represent effluent volumes in the flotation chamber, at both the beginning and the end of the experiment, respectively. The V/Vo ratio is used to correct the change in efficiency, due to the dilution of effluent,
which is caused by the introduction of water saturated with air into the flotation chamber.
In the batch experiments, the amount of water saturated with air discharged into the flotation chamber in relation to the initial volume of effluent in the chamber is quantified. On a laboratory scale, this can be achieved with the recycle ratio RR(%), given by Equation 2 (Zouboulis and Avranas, 2000; Al-Shamrani et al., 2001):
o o V V
RR (%) 100
V
−
= ⋅
(2)
The larger the amount of water saturated with air discharged into the flotation chamber, i.e., the higher the values of RR(%), the more diluted the effluent, resulting in lower values of efficiency, obtained only by the flotation process. For the treatment of milky effluent, the ideal value for RR was found to be 25%.
Flotation Kinetics
Flotation kinetics plays an important role in the process, since it can determine the feasibility of the process as well as establish design equations for scaling up the equipment. In the literature (e.g. Santos, 1996), several approaches may be found for determination of flotation kinetics. In the simplest and most frequently used approach, flotation is compared to a chemical reaction of the following type:
k
aX (particles) bY (bubbles)
cZ (flotable aggregate) +
→
where the rate of “particle consumption” by flotation for a nth reaction order is given by the following equation:
(
)
nd C V
k V C dt
⋅
= − ⋅ ⋅ (3)
where C is the concentration of particles in the flotation chamber, V is the volume of the flotation chamber, and k is the kinetic constant for removal.
Modeling of the Flotation Operation
[
]
no Ls
a i
d C ( t ) V ( t )
k V ( t ) C ( t ) dt
V ( t ) V Q t
t 0, C (0) C , 0 t t
⋅
= − ⋅ ⋅
= + ⋅
= = ≤ ≤
c
(4)
and for continuous operation the following equation holds:
n
a a s
ic ic
ic ic ic
s Ls a ic o Ls ic
Q C Q C(t)
dC(t)
k C(t)
dt V V
t t , C(t ) C
Q Q Q , V V Q t
⋅ ⋅
= − − ⋅
= =
= + = + ⋅
(5)
where Ca and Qa are the feed concentration and flow rate, k is the flotation kinetic constant, and V(t) is the change in volume in the tank with time during fed-batch operation. The initial fed-fed-batch operation ends at time tic, when continuous operation is started up. At this moment, the tank has a milk concentration of Cic and a volume of Vic. The treated effluent exit flow rate (QS) is constant and equal to the sum of the feed and saturated liquid flow rates. For each experimental run, Ca, Vo, QLS, Qa, Vic, and Cic are held constant.
RESULTS AND DISCUSSION
Average Bubble Diameter
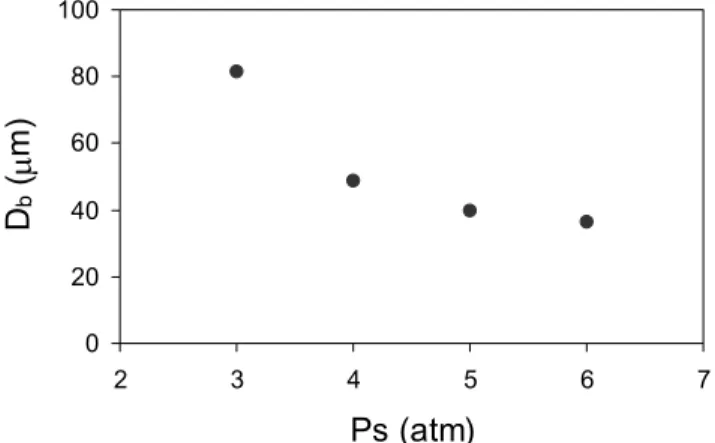
Using the procedure described by Couto et al. (2002), the average bubble diameter was estimated for different pressure values in the saturation tank. At least five replicates of each estimation procedure for each saturation pressure of air were carried out. The average results are presented in Figure 4.
It may be observed that average bubble diameter decreases as saturation pressure increases and remains practically unaltered for pressures higher than 5 atm. This result confirms those obtained
previously by Edzwald (1995) and Burns et al. (1997), who used a photographic technique to obtain average bubble diameter.
Batch Studies Using the Flotation Column
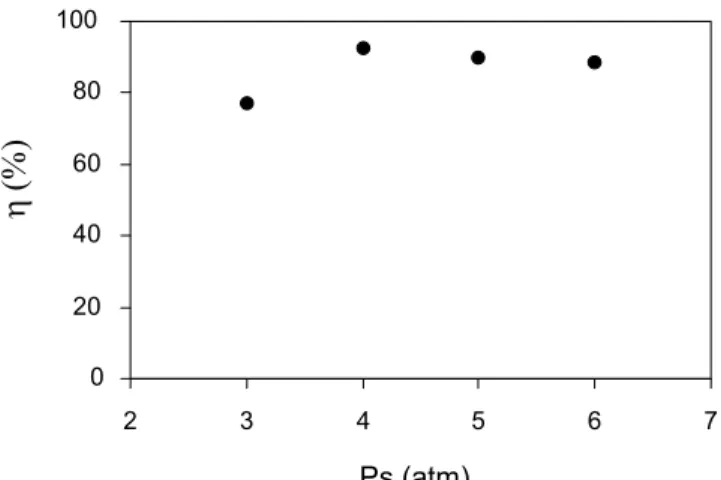
In order to evaluate the efficiency of the FAD technique, the role played by saturation pressure in the treatment of synthetic milky effluent was studied, using the flotation column illustrated in Figure 2.
As shown in Figure 5, separation efficiency was lower when the saturation pressure was 3 atm and higher for saturation pressures over 4 atm. This result is probably related to the fact that pressures over 4 atm result in smaller bubble diameters, thus leading to greater separation efficiency. This pressure was used during the continuous experiments in the flotation tank.
Continuous Flotation Experiments
Using the experimental unit illustrated in Figure 3, continuous flotation experimental runs were carried out for several values of the ratio between effluent feed and saturated liquid flow rates (Qa/QLs). Figure 6 shows the flocculated milk separation efficiencies with time for Qa/QLs ratio ranging from 0.5 to 3.3.
It may be observed that the larger the Qa/QLs ratio, the lower the separation efficiency of the flotation process. This result was expected, since the higher the feed flow rate, the shorter the residence time of flocculated milk in the flotation tank, which results in shorter contact times between air bubbles and flocculated milk particles, thus hindering the flotation process.
It may be observed that separation efficiency does not increase significantly for Qa/QLs ratios less than 1, showing that this value is ideal for continuous operation, since it is able to remove up to 90% of the flocculated milk effluent.
0 20 40 60 80 100
2 3 4 5 6 7
Ps (atm)
Db (µ
m)
0 20 40 60 80 100
2 3 4 5 6 7
Ps (atm)
η
(%)
Figure 5: Separation efficiency as a function of saturation pressure (RR = 25%, t = 5min).
0 20 40 60 80 100
0 5 10 15 20 25
T ime (min)
η
(%
)
Q a/Q ls = 0.52 Q a/Q ls = 0.61 Q a/Q ls = 0.74 Q a/Q ls = 0.95 Q a/Q ls = 1.96 Q a/Q ls = 3.33
Figure 6: Separation efficiency as a function of time for several values of the Qa/QLs ratio (Ps = 4atm, Ca ≈ 1g/L).
Estimation of Flotation Tank Efficiency
From the modeling equations for the flotation operation (cf. Equations 7 and 8), it was possible to estimate the separation efficiency of flocculated milk in the flotation tank. By assuming that the particle removal rate obeys first-order flotation kinetics (n=1), the variation in milk concentration with time during the initial fed-batch operation is given by the
analytical solution of Equation 4:
a o
o Ls C V exp(-k t) C(t) =
V +Q t
⋅ ⋅ ⋅
⋅
(6)
For continuous operation, the concentration of milk as a function of time is given by the analytical solution in Equation 5:
− ⋅ ⋅ − ⋅ ⋅ + ⋅ ⋅ ⋅ ⋅ ic V ic t ) ic V k + a Q + Ls (Q exp ic V t ) ic V k + a Q + Ls (Q .exp ic C ic V k + a Q + Ls Q a C a Q -+ ic V k + a Q + Ls Q a C a Q =
The kinetic constant k was estimated using the Statistica computational package and the experimental data obtained from the fed-batch runs. During simulation of the continuous process, the kinetic constant obtained from the fed-batch data was used, by assuming that it is dependent solely upon the saturated liquid flow rate.
Figure 7 contains a comparison between the experimental results for separation efficiency and those obtained with the estimation procedure, using the Qa/QLs=1 ratio. It can be observed that the estimated flocculated milk separation efficiencies obtained from the mass balance in the flotation tank described the experimental data very well.
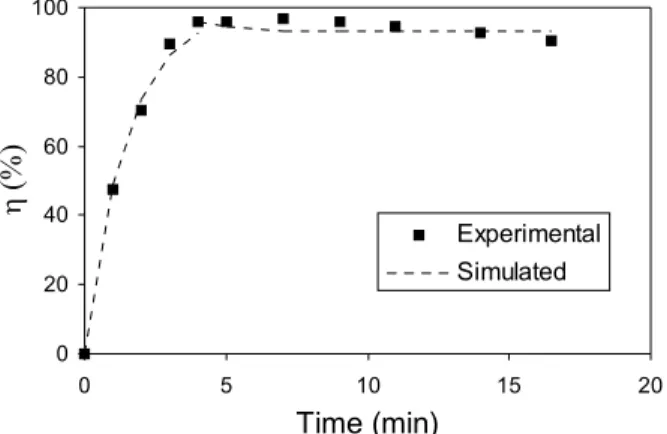
Using the Qa/QLs=0.5 ratio, it can be observed in Figure 8 that the estimated results also satisfactorily represented the experimental data, in which separation efficiencies of about 96% of all material in suspension were achieved.
For Qa/QLs ratios equal to 0.5 and 1, the kinetic
constant obtained from the fed-batch experimental data was used successfully during simulation of the continuous process. This shows that for this range of variation in Qa/QLs, the flotation kinetic constant does not depend on the feed flow rate.
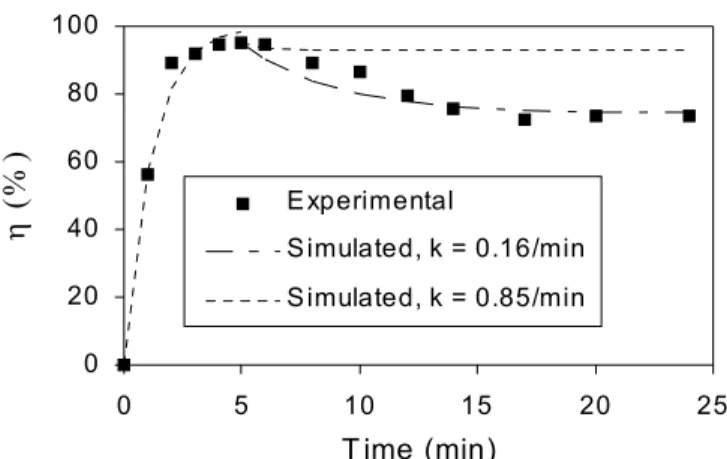
For the case in which the feed flow rate is twice the value of the saturated liquid flow rate (i.e., Qa/QLs=2), the value of k obtained from the fed-batch experiments and used in the model did not satisfactorily describe the separation efficiencies for flocculated milk in continuous operation, as depicted in Figure 9.
This result is probably related to the fact that when the feed flow rate is higher than the saturated liquid flow rate, the kinetic constant not only depends on the saturated liquid flow rate, but also on the feed flow rate. For k = 0.16 min-1, better agreement between the separation efficiencies from the experimental data and the simulation results was achieved.
0 20 40 60 80 100
0 5 10 15 20
Time (min)
η (%)
Experimental Simulated
Figure 7: Comparison between the separation efficiency obtained experimentally and that obtained through simulation for Qa/QLs = 1 (Ps = 4atm, QLs = 0.28L/min,
Qa = 0.28L/min, tic = 4min, Vo = 4.5L, Ca = 0.8g/L, k = 0.61min-1).
0 20 40 60 80 100
0 4 8 12 16 20
Time (min)
η (%)
Experimental Simulated
Figure 8: Comparison between the separation efficiency obtained experimentally and that obtained through simulation for Qa/QLs = 0.5 (Ps = 4atm, QLs = 0.29L/min,
0 20 40 60 80 100
0 5 10 15 20 25
T ime (min)
η
(%
)
E xperimental
S imulated, k = 0.16/min
S imulated, k = 0.85/min
Figure 9: Comparison between the separation efficiency obtained experimentally and that obtained through simulation for Qa/QLs = 2 (Ps = 4atm, QLs = 0.19L/min,
Qa = 0.37L/min, tic = 5min, Vo = 4.6L, Ca = 0.8g/L).
CONCLUSIONS
1) The use of fluid dynamic correlations was found to be a satisfactory procedure to estimate average bubble diameter, since it shows the tendency for this parameter to decrease with an increase in air saturation pressure, which is in accordance with the results of Edzwald (1995) and Burns et al. (1997).
2) According to the batch flotation column results, it was possible to obtain separation efficiencies for flocculated milk of as high as 98.5% within an operation times of 5 minutes and at a saturation pressure of 4 atm.
3) Air saturation pressures over 4 atm did not improve flotation efficiency, this being the reason why this pressure was used during the continuous experiments in the flotation tank.
4) In the continuous operation in the flotation tank it was possible to obtain suspended particle separation efficiencies as high as 90% for an air saturation pressure of 4 atm and a ratio of Qa/QLs=1.
5) For ratios of Qa/QLs<1, estimation of the separation efficiency for flocculated milk showed very good agreement with experimental data for continuous flotation, using the kinetic constant obtained from the fed-batch experimental results. On the other hand, for ratios of Qa/QLs>1, the efficiency results obtained from the simulation did not show satisfactory agreement with the experimental data, which shows that in this case, the flotation kinetic constant does not depend only upon the saturated liquid flow rate but also upon the feed flow rate.
ACKNOWLEDGEMENTS
This work is part of the CNPQ project #470016/01-9, entitled “Projeto e Análise do Desempenho de Sistemas de Flotação para o Tratamento de Efluentes Líquidos e Separação de Biomassa”.
NOMENCLATURE
C Clarified liquid milk concentration [M/L3] Ca Feed milk concentration [M/L3] Cic Concentration of milk in the tank at the
beginning of the continuous flotation process [M/L3] Db Average bubbles diameter [L] k Flotation kinetic constant [θ-1] Qa Liquid feed flow rate [L3/θ] QLs Flow rate of liquid saturated with air [L3/θ] t Time [θ] tic End of fed-batch operation time [θ] V Final volume in the flotation chamber [L3] Vo Initial volume in the flotation chamber [L3] Vic Volume in the tank at the beginning of
continuous operation [L3] Ps Manometric pressure in the pressurization tank [M/L. θ2] RR Recycle ratio [-] n Flotation “reaction” order [-]
REFERENCES
Al-Shamrani, A.A., James, A., and Xiao, H., Separation of Oil from Water by Dissolved Air Flotation, Colloids and Surfaces A: PEA, vol. 209, no. 1, pp. 15-26 (2001).
Burns, S.E., Yaicoumi, S., and Tsouris C., Microbubble Generation for Environmental and Industrial Separations, Separation and Purification Technology, vol. 11, no. 3, pp. 221-232 (1997).
Couto, H. J. B., Melo, M.V., and Massarani, G., Tratamento de Efluentes da Indústria Láctea Através da Flotação por Ar Dissolvido, Proceedings of XXX ENEMP – Congresso Brasileiro de Sistemas Particulados (in press), São Carlos-SP, October, 9 p (2002).
Edzwald, J.K., Principles and Applications of
Dissolved Air Flotation, Water Science Technology, vol. 31, no. 3-4, pp. 1-23 (1995). Puget, F.P., Melo, M.V., and Massarani, G., Análise
do Desempenho de Coluna de Flotação para o Tratamento de Efluentes da Industria Láctea, Proceedings of XXVIII ENEMP – Congresso Brasileiro de Sistemas Particulados, Electronic edition, São João Del Rei, Minas Gerais (2001). Richter, H., Flotation: A Modern Process for
Wastewater Treatment, International Chemical Engineering, vol. 16, no. 4, pp. 614-619 (1976). Santos, L.C., Simulação da Flotação em Coluna,
M.Sc. thesis, Federal University of Minas Gerais, Belo Horizonte, Brazil (1996).