regional committee
PAN AMERICAN
HEALTH
ORGANIZATION
O]
XXXV Meeting
Washington, D.C. September 1991
WORLD
HEALTH
RGANIZATION
XLIII MeetingIc
c5)
CD35/INF/2 (Eng.) 16 August 1991
ORIGINAL: SPANISH
STATUS OF MALARIA PROGRAMS IN THE AMERICAS XXXIX REPORT
INTRODUCTION . . . .
I. STATUS OF MALARIA IN THE WORLD . . . .
A. Population at risk . . . .
B. Reports of malaria cases to WHO . . . . .
C. World trends . . . .
II. STATUS OF MALARIA IN THE AMERICAS, 1990
III. CURRENT SITUATION OF MALARIA PROGRAMS IN
THE AMERICAS . . . .
A. General Information . . . .
M6xico, Central America, Belize and Panama
Caribbean Area . . . .
Andean Area . . . .
Amazon Region . . . .
B. Status of Malaria in countries with
Transmission of the Disease . . . .
Field Operations . . . .
Problems in the Implementation of Malaria Programs
Country Information . . . .
IV. PROBLEMS HINDERING MALARIA PREVENTION AND
CONTROL IN THE AMERICAS . . . .
A. Socioeconomic Problems in Vector Control of
Malaria and Management of Man-Vector Contact . . .
B. Use of Residual Spraying . . . .
C. Use of Mosquito Nets, and Metal Curtains and Screens ...
i
. . . . . . . 1
... . 1
... . 1
... 1.
. . . 2
... 11
... ... 11
. .. . . 12
. . . 16
17
41
· 107
. 107
. 107
D. Environmental Management and Community
Participation in Vector Control . . . .
E. Problems in Surveillance and Control of
Malaria Parasites in the Human Reservoir . . . .
F. Economic development projects and
infra-structure projects and their impact on malaria
G. Environmental Degradation and Malaria
Problems . . . .
H. Malaria Problems in an International
Context . . . .
V. ADVANCES IN MALARIA RESEARCH . . . .
A. Epidemiology ...
B. Social and Economic Research . . . .
C. Diagnosis ...
D. Immunology ...
E. Chemotherapy . . . .
F. Entomology ...
VI. PERSONNEL TRAINING ...
Tables
1. Number of Malaria cases reported in the world . . .
2. Population of malarious areas, 1958-1990 . . . .
3. Malariometric rates of 21 countries of the Americas
4. Malariometric rates, by geographical regions . . . .
5. Status of Malaria Programs in the Americas, by population ...
6. Status of Malaria Programs in the Americas, by area ...
ii
Paqe
. . 109
* . 109
. .110
. 111
·
. 111
. . 112
·
. 112
·
. 114
·
. 117
· .117
·
. 122
·
. 122
·
. 126
. . . 5 . . . 6 . . . 7
.. . 9
18
. . 19
7. Malaria Morbidity in the Americas, 1958-1990 . . . . 8. Number of blood slides examined and with
plamodia, by geographical subregions
and by phases of the programs, 1990 . . . .
9. Slides examined and positives, by specie
of plamodium - Non-malarious areas, 1990 . . . . .
10. Epidemiological situation of 21 countries
with active malaria programs, 1990 . . . .
11. Malaria cases registered in the Region of
the Americas, 1987-1990 . . . .
12. Comparative results of active and passive case detection under malaria programs in the Americas
13. Sprayings with residual insecticides applied
1989-1990 . . . .
14. Insecticidas used in 1990 by the malaria programs
an estimate for 1991 . . . .
15. Number of intradomiciliary sprayings with residual
insecticides, 1987-1990 . . . .
16. Consumption of antimalarial drugs in 21
countries with active malaria programs, 1986-1990 17. Use of antimalarial drugs in 1989 and
requirements for 1990 . . . .
18. Personnel employed in malaria programs in
the Americas, 1989-1990 . . . .
19. Areas with technical and administrative problems
in the control of malaria in the American Region
20. Funds from country and international agencies for
malaria research in the American Region
1985-1990 . . . .
iii
Page
20
21
23
25
. . 29
. . 30
31
32
33
34
35
37
38
Maps
Paqe
1. World malaria situation, 1989 . . . ... 4
2. Countries with no evidence of transmission . . . 22
3. Mexico, Central America, Belize, Panama, Haiti
and Dominican Republic . . . ... 26
4. Brazil and Guianas ... 27
5. Andean Area and Southern Cone . . . ... 28
Figures
1. Population of the world, 1989, exposed to malaria risk . . 5
2. Malariometric rates in 21 countries, 1960-1990 . . . 8
3. Malariometric rates of 21 countries of the Americas
ABER and APIS ... . 10
4. Percentage of malaria cases, American Region, 1990 . . . 24
5. Distribution of 2,150 students in 1990
by specialty/core topic . . . 128
6. Distribution of students by country: Mexico,
El Salvador, Panama, and Paraguay . . . ... 129
INTRODUCTION
This document is the XXXIX Report on the Status of Malaria published by PAHO. It outlines the malaria situation in the Region
during 1990, summarizing the information obtained from the
Governments in response to the questionnaire sent to them annually.
The section on the status of malaria in the world refers to
1989. The information was taken from publications of the World
Health Organization.1
I. STATUS OF MALARIA IN THE WORLD
A. Population at Risk
More than 40% of the world's population, i.e., more than two billion people, continues to be at some degree of risk for contracting malaria in approximately 100 countries and territories
(Map 1). Of a total world population of some 5.16 billion, 1.4
billion (27%) live in regions where there has never been malaria or where it disappeared with no antimalarial intervention; 1.65 billion (32%) live in regions where malaria has been eradicated through malaria campaigns and has not recrudesced; 1.62 billion (31%) inhabit areas where endemic malaria had been considerably reduced or even eradicated, but transmission has begun again, and
the situation is currently unstable or deteriorating. These
regions include areas where malaria poses a major problem as a
result of significant ecological and social changes. Such areas
encompass only 1% of the world's population. Areas where
endemicity remains practically unchanged, where there is intense transmission in many areas, and where antimalarial programs have not been fully implemented, are inhabited by 490 million people
(almost 10% of the world population). This situation is
encountered primarily in tropical Africa (Figure 1).
B. Reports of Malaria Cases to WHO
Every year WHO receives information from the Member States on the number of malaria cases registered by national surveillance
programs. These cases are usually defined as those that require
treatment and those that have been confirmed by microscopic
examination; however, in countries that lack microscopic
examination services at the peripheral level, most cases are diagnosed by clinical signs.
It is estimated that worldwide incidence of malaria comes to some 110 million clinical cases per year, and that approximately
280 million people are carriers of the parasite. These figures
should be considered approximate in view of the difficulty of
obtaining precise information. Reporting is quite erratic and
1 WHO. Weekly Epidem Rec 22:157-163, 1991 and 23:167-170,
incomplete in the highly endemic regions. For example, the countries of tropical Africa, which are estimated to account for .approximately 80% of all clinical cases and more than 90% of all parasite carriers, report only 2% to 6% of the estimated world total.
Excluding Africa, in 1989, 5.2 million cases were reported to WHO; 95% came from just 25 of the more than 100 countries or
territories with endemic malaria. Half of all cases were
registered in India (39%) and Brazil (11%), while approximately one fourth were reported from Thailand, Sri Lanka, Afghanistan, Vietnam, China, and Myanmar (in decreasing order).
A general description of the malaria situation may tend to obscure the large variations between and within countries; this is the case with the information provided by India and Brazil, whose
data account for half of all registered cases. In India, with 2
million cases reported in 1989, nearly 55% of all cases are from 3
states: Gujarat (599,000), Orissa (261,000), and Madhya Pradesh
(253,000). In the Americas, where the incidence of malaria
increased from 270,000 cases in 1974 to 1,100,000 in 1989, Brazil accounted for 52% of the total. Within Brazil, the Amazon region accounted for 97% of all cases, the majority in three states. Even
in these states, the cases were concentrated in specific areas.
C. World Trends
From 1975 to 1979, there was a reduction in the number of reported cases of malaria, owing largely to the control measures implemented in India in response to an outbreak of the disease. Since 1985, the number of reported cases in India has stabilized,
although it is currently showing an upward trend. Malaria
incidence in China has continued to decline as a result of successful integration of the malaria campaign into the primary health care system. Excluding India and China, it appears that the
malaria situation is deteriorating. Among the areas where this
deterioration has been particularly marked are the "peripheral
regions" of Southeast Asia and South America. The situation has
not changed a great deal in the highly endemic areas of Africa, but large-scale epidemics have been reported in areas with less endemicity (see Table 1).
II. STATUS OF MALARIA IN THE AMERICAS,
In 1990 it was estimated that 278 million people in the Region of the Americas were living in malarious areas. Morbidity from malaria was 149.67 per 100,000 population, while in 1974 morbidity had been only 49.37 per 100,000 inhabitants. As can be seen from Table 2, during the last four years more than one million cases have been registered in the Region. This figure is an indication
of how the problem has worsened in the Region.
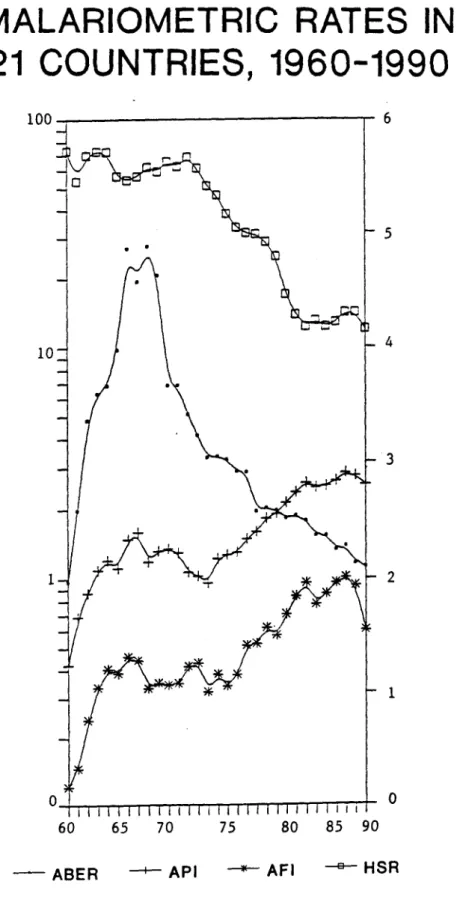
In the 21 countries with active malaria control programs, 1,042,817 cases had been confirmed as of the end of the year, with an Annual Parasite Incidence of 2.53 per 1,000 population, as described in Table 3 and Figure 2.
French Guiana continues to have the highest annual parasite incidence, as it has since 1987; in 1990, the API was 64.23 per 1,000 population; Guyana and Belize had an API of 21.81 per 1,000 and 16.57 per 1,000 respectively. The annual blood examination
rate (ABER) was highest in French Guiana and Belize. The
malariometric rates of 21 countries in the last five years are shown in Table 4; the regional total for the last 30 years is shown in Figure 3.
cOZ
v.,o
co
'-Ccc
4
i
~~~I I
; 1
i,
i i - :
FIGURE 1
POPULATION OF THE WORLD, 1989
EXPOSED TO MALARIA RISK
NEVER MALARIOUS
~mmn 27%
NOT PROTECTED 10%
WITH MAL. PROGRAMS 31%
FREED FROM MALARIA 32%
Table 1
NUMBER OF MALARIA CASES REPORTED (In thousands)
1985-1989 (a)
IN THE WORLD
WHO REGIONS 1985 1986 1987 1988 1989
AFRICA - AFRO 3,373 3,046 3,309 3,285 7
AMERICAS - AMRO 911 951 1,019 1,120 1,114
SOUTH-EAST ASIA
- (SEARO) 2,521 2,689 2,823 2,719 2,810
EUROPA - EURO 32 45 28 24 21
EASTERN MEDITERRANEO 391 610 566 602 531
- (EMRO) WESTERN PACIFIC
- (WPRO) 1,066 786 830 704 709
TOTAL (Excl. Africa) 4,921 5,081 5,266 5,169 5,185
(a) Source: "WHO Wkly Epid. Rec. 22: 1991.
Table 2
POPULATION OF MALARIOUS AREAS 1958 - 1990
(In thousands)
Number of inhabitants in originally malarious areas
Year Mainte- Consoli- Attack Prep. phase or
nance dation Program not
started 52.866 52,856 54,363 56,979 59,299 56.546 57.414 60,975 69,760 70,720 72,441 72,757 80,770 81,306 86,634 87.969 91,527 99,405 101,068 104,567 105,611 113,092 114,620 117,042 118,338 119,175 124,408 124,086 116, 143 117,310 124,250 126,666 120,980 1,996 9,349 10,101 17,879 30,424 33,901 32,277 34,731 36,128 41,581 45,812 46,987 40,518 43,644 42,016 45,535 46,042 44,633 48,813 50,610 59,734 57,280 58,087 59,962 62,028 66,970 68,372 67,092 43,717 42,334 46,048 45,309 47,481 46,196 56,292 53,400 39,021 49,276 31,910 34.426 38,575 43,369 44,766 56.234 56,375 59,807 60,396 61,645 61,915 63,130 61,834 61,205 60,373 54,808 55,989 58,659 62,256 64,941 63,182 64,496 68,659 103,500 108,633 109,927 113,419 110,139
Jul/30/91 (hs)
34,351 27,423 25,722 33,413 14,743 29,664 34,525 12,108 17,212 12,834 217 206 162 146 153 109 56
--- Total
Population Total (In thousands)
Table 3
MALARIOMETRIC RATES OF 21 COUNTRIES OF THE AMERICAS WITH ACTIVE MALARIA PROGRAMS
Blood slides examined Sprayings
Total
---Year population P.falc. Number of
Number ABER Positive API & Assoc. AFI sprayings HSR
(a) (b) (c) (d) (a) (f) (9) (h) (i)
…_________________________________________________________________________________________________ 1959 1960 1961 1962 1963 1964 1965 1966 1967 1968 1969 1970 1971 1972 1973 1974 1975 1976 1977 1978 1979 1980 1981 1982 1983 1984 1985 1986 1987 1988 1989 1990 a) b) c) d) e) f) 9) h) i) 183,870 187,952 193 493 199,273 205,362 210,859 216,906 222,629 228,762 235,068 241,652 250.465 257,600 264,763 271,756 279,501 290,670 298,120 305,675 313,364 320,522 328,435 333,333 335,382 352,619 360,847 369,556 378,861 386,252 394,720 403,267 411,811 2,531,566 3,713,353 5,019,034 6,703,183 7,388,147 7,737,428 8,635,009 10,813,817 10,464,355 11,473,186 11,178,193 9,184,108 9,449,291 9,036,489 8,778,033 8,500,069 8,863,987 9,005,812 8,929,851 9,143,761 8,280,680 8,576,170 8,622,478 8,453,319 8,969,388 9,006,858 8,781 ,416 8,992,835 8,675,128 8,990,281 8,595,096 8,647,095 1.38 1.98 2.59 3.36 3.60 3.67 3.98 4.86 4.57 4.88 4.63 3.67 3.67 3.41 3.23 3.04 3.05 3.02 2.92 2.92 2.58 2.61 2.59 2.52 2.54 2.50 2.38 2.37 2.25 2.28 2.13 2.10 71,138 79,048 133,161 173,570 225,731 255,130 243,259 332,599 366,346 280,063 320,383 339,825 335,290 284,180 280,044 268,700 356,196 378,651 398,290 468,038 514,110 599,959 635,877 713,878 829,546 929,891 909,162 948,906 1,016,327 1,118,132 1,111,732 1,042,817 0.39 0.42 0.69 0.87 1.10 1.21 1.12 1.49 1.60 1.19 1.33 1.36 1.30 1.07 1.03 0.96 1.23 1.27 1.30 1.49 1.60 1.83 1.91 2.13 2.35 2.58 2.46 2.50 2.63 2.83 2.76 2.53 19,879 22,668 28,240 47,909 68,785 85,362 84,161 101 965 101 216 78,373 84,851 86,066 90,027 109,762 116,180 89,411 110,961 101 260 116,238 160,478 166,581 201,260 188,658 235,017 295,253 345,622 285,319 325,438 370,818 398,609 376,187 245,232 0.11 0.12 0.15 0.24 0.33 0.40 0.39 0.46 0.44 0.33 0.35 0.34 0.35 0.41 0.43 0.32 0.38 0.34 0.38 0.51 0.52 0.61 0.57 0.70 0.84 0.96 0.77 0.86 0.96 1.01 0.93 0.60 13,148,306 13,726,707 10,377,938 13,897,489 14,901,921 15,214,265 12,255,286 12,037,910 12,836,614 14,503,758 14,260,457 16,354,814 15,942,166 18,095,931 16,523,538 14,220,717 13,428,977 11,415,514 10,151,758 9,813,592 9,905,425 9,406,537 8,275,938 5,679,929 4,886,234 4,417,500 4,808,740 4,636,776 4,940,182 5,568,710 5,689,129 4,930,362 71.51 73.03 53.63 69.74 72.56 72.15 56.50 54.07 56.11 61.70 59.01 65.30 61.89 68.35 60.80 50.88 46.20 38.29 33.21 31.32 30.90 28.64 24.83 16.94 13.86 12.24 13.01 12.24 12.79 14.11 14.11 11.97
Estimated population in thoudsnf of inhabitants. Number thick blood fimls examined during the year.
ABER = Annual Blood Examination Rate, per 100 inhabitants.
Number of positive slides, i.e.,showing Plasmodium in at least 100 microscopic fields. API = Annual Parasite Incidence, per 1000 inhabitantes.
Number of slides showing P. falciparum and other associated plasmodia. AFI = Annual P. falciparum Incidence during the year, per 1000 inhabitants Number of house sprayings during the year, regardless of cycles and insecticides. HSR = House spraying rate, per 1000 inhabitants.
FIGURE 2
MALARIOMETRIC RATES IN
21 COUNTRIES, 1960-1990
100
10
60 65 70 75 80 85 90
ABER : API AFI ° HE
8
6
5
4
3
2
1
0
SR
-MALRIOMETRIC RATES, BY GEOGRAPHICAL REGIONS a)
Countries Total ABER API HSR
(by geographical population---sub-regions) 1990 a) 1986 1987 1988 1989 1990 1986 1987 1988 1989 1990 1986 1987 1988 1989 1990
= = . . . = = = = = = = = = = = = = = = = = = = = = = = = = = = = = = = = = = = = = = = = = = = = = = = _ = = = = _ = = = = = _ = = = = = = = = = = = = _ _ = = = _ = = = = = _ = = = = = = = = = = = _ _ _ _ = = = = = = = = = = _ ==.-...
1.52 1.54 163.00 1.71 1.70 1.61 1.24 1.37 1.17 0.50 7.54 11.17 14.36 18.25 20.97
CENTRAL AMERICA
Belize 183 12.49 13.02 12.88 11.13 9.40 16.64 19.16 15.66 18.46 16.57 218.28 172.49 156.11 137.42 133.66
Costa Rica 3,015 4.19 3.71 3.72 3.69 3.75 0.29 0.32 0.35 0.24 0.38 6.47 4.62 6.53 6.69 4.22
El Salvador 5,252 3.77 4.07 4.25 3.72 4.38 4.95 2.60 1.81 1.87 2.76 9.85 18.42 15.43 15.12 30.29
Guatemala 9,197 5.53 6.06 4.76 3.71 3.32 5.20 6.84 6.06 4.75 4.54 15.82 20.77 26.69 29.18 32.34
Honduras 5,138 9.07 8.30 8.73 7.85 8.15 6.43 4.08 6.16 9.22 10.33 46.62 33.84 30.79 27.02 24.13
Nicaragua 3,871 15.08 12.80 13.53 13.98 12.03 6.00 4.86 9.12 12.28 9.24 22.87 26.72 14.98 28.16 17.86
Panama 2,418 17.44 17.74 17.41 14.28 13.04 0.48 0.53 0.43 0.18 0.16 18.14 12.77 7.91 8.17 5.77
CARIBBEAN AREA
Haiti b) 6,504 4.35 3.47 0.64 1.00 0.21 2.38 1.97 1.96 3.64 0.74 32.25 37.07 0.00 32.37 0.00
Dominican Rep. 7,170 6.51 5.83 5.24 4.18 4.15 0.21 0.18 0.16 0.18 0.06 ... ... 7.96 1.96 2.42
BRAZIL 150,368 2.43 2.15 2.34 2.29 2.19 3.20 3.60 3.87 3.92 3.73 15.82 15.04 18.19 15.82 10.16
GUIANAS
French Guiana 92 7.66 35.77 29.71 39.99 53.47 11.65 25.83 36.23 69.82 64.23 ... ... ... 755.56 0.00
Guyana 1,040 8.73 16.71 18.00 14.04 13.01 16.88 34.52 35.26 20.35 21.81 7.39 10.79 7.92 4.39 0.00
Suriname 403 13.41 7.61 8.56 5.87 4.61 3.46 5.30 6.86 4.28 3.99 12.61 0.00 1.86 0.44 9.82
ANDEAN AREA
Bolivia 7,314 1.56 1.72 1.52 1.59 1.66 3.21 3.70 3.22 3.57 2.69 16.79 12.57 12.92 14.01 13.67
Colombia 31,819 1.63 1.45 1.67 1.79 1.56 3.04 3.01 3.30 3.21 3.13 12.36 9.59 7.47 6.85 7.45
Ecuador 10,782 2.86 3.30 3.27 1.38 3.37 5.33 6.40 5.25 2.22 6.65 5.93 6.81 22.96 13.76 18.94
Peru 22,332 0.91 0.73 0.59 ... 0.40 c) 1.82 1.89 1.52 1.47 1.29 c) 10.72 9.75 6.95 ... 1.86 c)
Venezuela 19,736 1.63 1.70 1.85 1.83 1.40 d) 0.81 0.98 2.44 2.25 1.78 d) 14.48 19.69 17.53 16.74 10.58 d)
SOUTHERN CONE
Argentina 32,322 0.08 0.07 0.06 0.07 0.07 0.06 0.05 0.02 0.05 0.05 0.52 0.49 0.48 0.26 0.86
Paraguay 4,277 2.70 2.49 1.91 2.15 2.30 1.14 0.95 0.71 1.26 0.39 12.29 10.36 9.70 13.29 6.79
M EX ICO
-ABER = Annual Blood Examination Rate, per 100 inhabitants. API = Annual Parasite Incidence, per 1000 inhabitants.
HSR = House Spraying Ratem per 1000 inhabitants.
Based on the total population of the country, in thousands of inhabitants.
Information of 1988 Is incomplete. c) Information up to October. d) Information up to September.
Aug/27/90 (hs)
MEXICO 88,598
FIGURE 3
10
MALARIOMETRIC RATES OF 21 COUNTRIS OF THE AMERICAS, ABER AND API
ABER (By 100 Inhab. API (By 1000 Inhab.) 6
2 . 70.. .
1
60 66 70 75 eo 85 so
YEARS
_
III. CURRENT SITUATION OF MALARIA PROGRAMS IN THE AMERICAS
A. General Information
In 1990 it was estimated that the population of the Americas was 698,199,000, of which 278,600,000 people were living in areas
originally considered malarious, i.e., 39.8% of the total
population and 50.60% of the total area of the Hemisphere (see Tables 5, 6, and 7).
During the year there were 1,045,808 cases of malaria in 36
countries of the Americas. Of this total, 7,221 cases were
detected in areas considered non-malarious and 29,550 in areas where transmission has existed or has been interrupted for more than three years (maintenance phase), for a total of 36,771 cases (i.e. 3.51% of the total) diagnosed in areas without permanent transmission of malaria (see Table 8).
These figures reflect the constant threat of transmission in
still vulnerable areas. In these areas, institutions for social
protection are still insufficiently developed, which makes it difficult to detect epidemics. Usually, these vulnerable areas are characterized by either organized or spontaneous influxes of migrants or migratory traffic from areas with ongoing malaria transmission.
In 1990, the transmission of epidemics due to P. vivax in vulnerable areas of Brazil (Foz do Iguacu and Manaus) and Mexico (Guerrero, Michoacdn, and Oaxaca) was controlled through the implementation of integrated control measures. These actions were
adapted to the particular characteristics of these areas,
reinforcing the idea that malaria transmission should be approached as a focal problem, and successful and solutions and intervention measures must be planned and executed at the local level, as
described below in the individual country descriptions.
The countries used different epidemiological surveillance
systems. In Cuba, for example, 801,946 blood samples from
travelers who entered the country were examined, and 462 cases were detected. In the United States of America, where detection depends on spontaneous demand, 877 cases were found (Table 8 and Map 2). Of the 7,221 cases registered in non-malarious areas, 378 cases were detected in the Bahamas (4), Barbados (3), Bermuda (3), and Canada (368), while 6,843 cases were found in other countries with originally non-malarious areas (Table 9).
Among the 21 countries of the Region of the Americas where transmission of malaria now occurs, 1,044,069 malaria cases were
registered in 1990 (see Table 9 and Figure 4). Based on the
situation during that year, the 21 countries with active malaria programs can be divided into the following subregions:
Mexico, Central America, Belize, and Panama.
This subregion, which includes the eight contiguous countries of Middle America--Belize, Costa Rica, El Salvador, Guatemala, Honduras, Mexico, Nicaragua, and Panama--has 59,990,000-inhabitants living in originally malarious areas, i.e., 54.80% of a total
population of 109,482,000 inhabitants. In Mexico, 49.3% of the
population lives in malarious areas. In the other seven countries, 19,990,000 individuals, or 70.3% of the total population, live in such areas (Tables 10 and 11).
Nonetheless, if the annual parasitic incidence (API) is taken as an indicator of the magnitude of the malaria problem, it is apparent that the risk to these population groups of becoming ill from malaria in these countries ranges from 0.16 cases per 1,000
exposed population in Panama to 16.57 per 1,000 in Belize. In
addition, the distribution of risk varies from country to country (see Map 3).
In 1990 Belize recorded the highest annual parasitic incidence for the subregion, with areas such as the Cayo district having an
API of 45 per 1,000 inhabitants. Despite the recognized flow of
population from El Peten, Guatemala to Chiapas, Mexico by way of Belize, 98.5% of the cases diagnosed have been due to P. vivax
infections.
In Costa Rica, 1,146 P. vivax infections were registered, as
were five cases due to P. falciparum. The malarious area of the
country encompasses 69.6% of the national territory; but the transmission of malaria is concentrated in three provinces, where
85% of the cases were detected. Costa Rica has attained a high
degree of control over the -endemic disease, reflecting the country's high level of social development.
In El Salvador the trend toward control of malaria that began in the 1980s has been maintained following implementation of an
approach based on epidemiological stratification and the
integration of diagnostic, treatment, and epidemiological
surveillance services. Of the 9,269 cases registered during the
year, 80% were detected in 62 of the country's 262 municipios, which are considered to constitute the hyper-endemic area.
Guatemala has reported the diagnosis of 41,711 cases of
malaria (97.6% P. vivax). Even though the distribution of risk is
well-known (i.e. five of the country's 22 departments accounted for 65% of all cases registered), very little progress has been made in controlling the endemic disease.
Honduras, with 288 municipios, has reported the diagnosis of
53,095 cases (98.8% P. vivax) in 64 municipios located in six
departments. Honduras continues to use universal spraying and
medication with antimalarial drugs, but has been unable to make any
significant headway in controlling the endemic disease. Although efforts to analyze the malaria problem were stepped up in 1990, as yet no changes have been made in the country's intervention strategies.
In Mexico the epidemiological situation improved
significantly, with a turnaround in the trend toward uncontrolled spread of P. vivax transmission, which began in 1983. The reduced magnitude of the malaria problem, from an API of 1.17 per 1,000 population in 1989 to 4 per 1,000 in 1990, reflects an intense mobilization of resources aimed at strengthening the technical capability of states with transmission and those where tourism is
important. However, the epidemiological conditions of southern
Mexico continue to generate foci of transmission, and P. falciparum persists in the rain forest (logging) region of the border with Guatemala and Belize.
Nicaragua reported 35,785 cases of malaria (95.6% P. vivax) in 1990, maintaining an API of 9.24 cases per 1,000 population. In 49 of the country's 143 municipios, where 29.3% of the population lives, the risk of becoming infected with malaria is three times greater than in the rest of the country.
There are some noteworthy operational contrasts in Nicaragua. The municipality of Le6n, through the efforts of the local health authority, reduced malaria transmission by 80% from 1988 to 1990. This achievement came about through a careful study of the local stratification of transmission and a precise definition of the risk factors associated with the case-generating area. In a context of municipal intersectoral actions, progress has been made in draining
vast, previously unrecognized breeding sites. In other smaller
breeding sites, traditional cleaning treatments and application of larvicides have been used. In the municipio of El Viejo, a cotton-and sugarcane-producing area characterized by considerable use of pesticides, the national control program continues to employ traditional measures--house spraying of insecticides and active
detection and treatment of cases. Despite these measures, the
municipio still had the highest API in the country during 1990 (71.7 per 1,000 population).
In Panama, cases continue to be generated in three areas: the province of Darien, the San Blas comarca, and the Bayano region. These areas account for 32.3% of the national territory and 3.4% of the country's population. There are 72 case-generating localities, representing 0.74% of all localities in the country. Despite the low number of total cases, 27.56% of the infections are due to P. falciparum (Table 6).
Caribbean Area*
In the Caribbean region, the island of Hispaniola (Haiti and the Dominican Republic) continues to constitute an area of
transmission by P. falciparum. Haiti launched a program aimed specifically at the integrated control of malaria. Details on this program are included in the section on specific countries.
In the Dominican Republic epidemiological surveillance has been maintained. A total of 297,599 blood slides were examined, with positive results in 356 cases; 22 were due to P. vivax and were probably imported.
Andean Area
In the Andean subregion, Bolivia, Colombia, Ecuador, Peru,- and
Venezuela reported 254,803 cases of malaria among a population of
54,339,000 in the original malarious area, i.e., 58.3% of the total
population in the malarious areas. These cases represented an
increase of 13.54%, bringing the annual parasitic incidence in the subregion to 4.7 cases per 1,000 population (see Maps 4 and 5).
In view of the fact that in Colombia, Ecuador, and Venezuela more than one-fourth of the cases registered were P. falciparum
infections, the situation should be considered serious.
Infections due to P. falciparum in Colombia (35,490) and Ecuador (21,871) showed a proportional distribution that deviated
from the classical epidemiological picture. In Colombia, the
concentration of cases shifted from the northeast (Sarare Region) to the west (Pacific Coast), while the situation in the Magdalena
Medio region remained relatively unchanged. In Ecuador, four
provinces (Esmeraldas, Manabi, Guayas, and Los Rios) accounted for 92.45% of registered cases of P. falciparum infection (19,081), showing the same pattern as in Colombia. This contrasts with the classical Ecuadorian distribution of P. falciparum in the valleys of the Putumayo along the border with Colombia and the valley of the Napo river in the Amazon region.
In Venezuela the highest proportion of infections due to P. falciparum continued to occur in jungle areas of its Amazon region (federal territory of Amazonas and the state of Bolivar).
(See description under Amazon Region together with Brazil and the Guianas.)
Bolivia registered 19,680 cases and Peru 28,882 (as of October
1990), of which 3.31% and 0.45%, respectively, were diagnosed as
P. falciparum infections. This situation is characterized by
apparent endemic stability. The relative increase in the diagnosis of cases due to P. falciparum in Peru, from zero in 1988 to 131 in
1990, has occurred mainly in the region of Piura, Tumbes. This
region has a recognized focus in San Lorenzo, which was resistant to efforts aimed at interrupting transmission in Peru during the eradication period. This resurgence of P. falciparum infection in a country that had maintained complete interruption of transmission for many years is a discouraging development.
Amazon Region
For purposes of the present report, this region is considered to include the Amazon macroregion which encompasses parts of Brazil, French Guiana, Guyana, Suriname, and-the area south of the Orinoco River Basin in Venezuela (state of Bolivar and federal
territory of Amazonas). (See Map 4.)
This region is considered an "unreachable" area in terms of
traditional eradication strategy. In these areas traditional
control measures such as household spraying and case detection and treatment have not achieved the same results as in areas with greater population density with higher basic indicators for social
and economic development.
However, in this region the last decade has seen the opening of "great frontiers" in the context of a model of economic development has failed to assign sufficient importance to the
development and social protection of man. There has been a
tremendous volume of human traffic into and out of these frontiers of economic development, aided by the opening of roads and the ease of air and river transport, and this has created serious ecological
imbalances. The situation has been exacerbated by an increase in
the number of susceptible persons due to expansion of the parasite reservoir, as well as growth in vector population density as a result of ecological changes.
In this context of deficient social protection, traditional control programs have proven inadequate and the malaria ::control
measures employed have been inappropriate for the region-; There
has been a lack of concrete possibilities for the implementation of intersectoral measures of social protection, sometimes owing to the absence of institutions in the area and other times due to the lack of a technical strategy for generating new, broader social measures.
This Amazon region has reported the diagnosis of 622,160 cases of malaria, of which, 278,421 were infections due to P. falciparum. They originated mainly in the jungles of the Amazon area, which account for 80.6% of all diagnosed cases of P. falciparum infection
in the Region of the Americas.
Southern Cone
This area, which comprises mainly Paraguay and Argentina, is strongly affected in certain areas by the influx of population from
southern Brazil through Paraguay (see Map 5).
These two countries, with a population in malarious areas of 7,947,000 inhabitants, registered 4,572 malaria cases (API of 0.39 per 1,000 and 0.79 per 1,000 population, respectively).
The traditional reservoir of cases in Paraguay (Amambay) has expanded considerably due to agricultural development, particularly since the creation of the Itaipd reservoir, which has forced the country to reactivate "attack" areas as part of its eradication strategy. Furthermore, the reservoirs and dams.being.constructed
along the border with Argentina merit special attention.
Engineering projects should seek to minimize the creation of conditions that are optimal for the expansion of vector density, which is favored by the increase in relative humidity of the air
around the water reservoir.
B. Status of Malaria in Countries with Transmission of the
Disease
Table 12 shows a comparison between the passive and active
case-finding in each of the countries. In general the largest
numbers of malaria patients continue to be detected through passive methods. However, seven countries have yet to change their system for detecting malaria cases. These countries--Argentina, Bolivia,
Costa Rica, Panama, the Dominican Republic, Paraguay, and
Venezuela--continue to employ active case-finding methods even though fewer cases are discovered this way than through passive case-detection. In 1990, the total of 861,733 blood samples taken by these countries through active case-finding, will all the efforts and costs that this implied, produced only 15,721 positive
slides, yielding a slide positivity rate (SPR) of 1.8%. By
contrast, the examination of 414,431 blood samples taken through passive case-detection (half the number obtained through active detection) revealed 45,501 positive cases--three times more than those discovered through active case-finding.
Field Operations
Use of insecticides continues to be the principal control
measure. Table 13 shows the number of insecticide sprayings in
malaria programs during 1989 and 1990. Table 14 shows insecticide use in each country during 1990 and estimates for 1991. Table 15
reflects the quantities used from 1987 to 1990. DDT is still the
most commonly used insecticide, although in several countries, especially in Central America, it is no longer used.
Antimalarial drugs are used for ongoing presumptive treatment in most of the countries. Table 16 shows the quantities utilized, country by country, for 1990 and the estimated figures for 1991. Table 17 shows data on the total quantities of drugs consumed from 1986 to 1990.
Table 18 contains information on personnel engaged in malaria programs during 1989 and 1990.
Problems in the Implementation of Malaria Programs
The problems encountered in connection with the
implementation of malaria programs are summarized in Table 19. Although information is lacking on five countries that have both technical and administrative problems, the table shows the population, area, insecticides used, number of cases registered, principal vectors, and causes of the problem. In the 13 countries for which information is included in the table, 621,722 cases were diagnosed, i.e. 59.6% of all cases registered in the 21 malarious
countries of the Americas.
Table 5
STATUS OF MALARIA PROGRAM IN THE AMERICAS, BY POPULATION, 1990
Countries (by geographical
sub-region)
Total
---Population Total Mal. area
Population of originally malarious areas
Maintenance Consolidation Attack
a) Total % Total X Total X Total X
======== =============== _=================================================================== =====
Anguilla 7 b)
-Antigua 86 b) - -
-Netherland Antilles 195 b) - -
-Bahamas 262 b) - -
-Barbados 261 b) - - -
-Bermuda 58 b) - - -
-Canada 26,525 b) .
-Cuba 10,603 3,608 c) 34.03 3,608 d) 100.00
Chile 13,173 b) 325 c) 2.47 325 100.00
Dominica 78 17 c) 21.79 17 d) 100.00
United States of Amer. 226,575 64,166 c) 28.32 64,166 d) 100.00
Grenada 100 39 39.00 39 d) 100.00
Guadalupe 340 b) 333 c) 97.94 333 d) 100.00
Cayman Islands 21 b - - -
-Falkland Islands 2 b) - - -
-Turks and Caicos Islands 9 b) - - -
-Virgin Islands (USA) 96 96 100.00 96 d) 100.00
Virgin Islands (UK) 14 b) - - - -
-Jamaica 2,400 2,041 c) 85.04 2,041 d) 100.00
-Martinica 331 b) 207 c) 62.54 207 d) 100.00
-Montserrat 13 b) - - - -
-Puerto Rico 3,186 3,186 c) 100.00 3,186 d) 100.00
-St. Kitts-Nevis 50 b) - - -
-St. Peter & Miquelon 6 b) - - -
-St. Vincent 112 b) - - -
-Saint Lucia 136 bo 117 c) 84.78 117 d)
-Trinidad and Tobago 1,234 1,178 c) 95.46 1,178 d) 100.00
Uruguay 3,128 b - - -
-Mexico 81,141 40,0nO 49.30 - - - - 40,000 100.00
Belize 183 183 100.00 - - - - 183 100.00
Costa Oica 3,015 835 27.69 - - 719 86.11 116 13.89
El Salvador 5,252 4,727 90.00 - - - - 4,727 100.00
Guatemala 8,425 3,429 40.70 - - - - 3,429 100.00
Honduras 5,177 4,620 89.24 - - - - 4,620 100.00
Nicaragua 3.871 3,871 100.00 - - - - 3,871 100.00
Panama 2,418 2,325 96.15 - - 1,940 83.44 385 16.56
Haiti 6,000 5,360 89.33 - - 5,360 100.00
Rep. Dominicana 7,170 7,127 99.40 6,979 97.92 52 0.73 96 1.35
French Guiana 112 112 100.00 41 36.61 62 55.36 9 8.04
Guyana 768 e) 768 c) 100.00 639 83.20 - - 129 16.80
Suriname 420 302 71.90 267 88.41 6 1.99 29 9.60
Brazil 154,236 67,342 43.66 17,704 26.29 25,789 38.30 23,649 35.41
Bolivia 6,798 2,645 38.91 - - - - 2,645 100.00
Colombia 33,547 22,555 67.23 - - 17,265 76.55 5,290 23.45
Ecuador 10,782 6,250 57.97 - - - - 6,250 100.00
Peru 22,332 7,370 33.00 - - 7,370 100.00
Venezuela 19,735 15,519 78.64 14,850 f) 95.69 - 669 4.31
Argentina 34,079 4,241 12.44 4,136 97.52 - 105 ' 2.48
Paraguay 4,277 3,706 86.65 1,051 28.36 1,648 44.47 1,007 27.17
7 o t a 1 698,741 278,600 39.87 120,980 43.42 47,481 17.04 110,139 39.53
....---....---.---n--.. ---...
a) Pcpulation in tnousands. b) Midyear population estimated Dy PAHO. c) Pop. living in areas where malaria eradication has been registered by PAHO/WHO. d) Includes an area of
-eradication -has -been- -registered-by PAHO/WHO. 18
11,425,915 inhabitants where malaria
---Table 6
STATUS OF MALARIA PROGRAMS IN THE AMERICAS, BY AREA, 1990 (Area in Km2)
________________________________________________________________________________________________________ _-____-_ ___
Countries (by geographical
sub-region)
Total
area
Originally malarious areas
Total Mal. area Maintenance Consolidation Attack
...---...----...--- ___---_________________ _ ________
Total % Total % Total % Total X
Antigua
Netherlands Antilles Bahamas Barbados Bermuda Canada Cuba Chile Dominica
United States of America Grenada
GuadaluDe Cayman Islands Falklan Islancs Turks and Caicos Virgin Islanas (USA) Virgin Islanos (Un) Jamaica
Martinica Montserrat Puerto Rico
St. Christopher and Nevis San Pierre and Miquelon
St. Vincent Saint Lucia
Trinidad and Tobago Uruguay 280 961 11,396 430 53 221,016 110,860 741,767 765 9.365,604 344 1.950 183 11,961 522 345 174 10,991 1,080 84 8,896 396 240 389 620 5,128 186,926
37,502 a) 33.83 55,287 7.45 164 a) 21.44 2.309,876 a) 24.66 103 ai 29.94 1,244 63.79
345 a) 100.00
10,028 a) 91.24 300 a) 27.78
37,502 b) 55,287
164 b)
2,309,876 b) 103 b
1,244 O)
345 O)
10,028 b)
300 b) 100.( 100.( 100.) 100.( 100.) 100.( 100.( 100.( 100.x
8,896 100.00 8,896 b)
510
4,963 a) a) 96.7882.26
510
4,963 b) 100.(b) 100A.
D0 D0
00 -
-00
20 -
-00
20 -
-0 0 -
-20 -
-20 -
-00 -
-Mexico 1,967,183 1,150,000 58.46 - 1,150,000 100.0C
Haiti 27,750 24,938 89.87 - - - - 24,938 100.00
Dominican Rep. 48,442 47,562 98.18 44,281 93.10 1,096 2.30 2,185 4.59
Belize 22.965 22.965 100.00 - - - - 22,965 100.00
Costa Rica 50,900 35,446 69.64 - - 27,832 78.52 7,614 21.48
El Salvador 21,041 19,153 91.03 - - - - 19,153 100.00
Guatemala 108,889 80,350 73.79 - - - - 80,350 100.00
Honduras 112,088 100,079 89.29 - - - - 100,079 100.00
Nicaragua 127,358 118,358 92.93 - - 118,358 100.00
Panama 75,517 69,707 92.31 - - 34,890 50.05 34,817 49.95
French Guiana 90,000 90,000 100.00 50 0.06 82,350 91.50 7,600 8.44
Guyana 215,025 215,025 100.00 61,175 28.45 - - 153,850 71.55
Suriname 163.820 163,670 99.91 21,620 13.21 12,050 7.36 130,000 79.43
Brazil 8,511,965 6,898.045 81.04 190,469 2.76 1,226,413 17.78 5,481,163 79.46
Bolivia 1.098,581 821,346 74.76 - - - - 821,346 100.00
Colombia 1,138,914 970,849 85.24 - - 156,863 16.16 813,986 83.84
Ecuador 291,906 175,462 60.11 - - - - 175,462 100.00
Peru 1,285,215 961,171 74.79 - - - - 961,171 100.00
Venezuela 915,741 600,000 65.52 460,054 c) 76.68 343 0.06 139,603 23.27
Argentina 3,761,274 349,051 9.28 337,776 96.77 - - 11,275 3.23
Paraguay 406,752 406,552 99.95 271,010 66.66 80,749 19.86 54,793 13.48
T o t a 1 31,124,687 15,748,947 50.60 3,815,653 24.23 1,622,586 10.30 10,310,708 65.47
a) Estimated. b) Areas where malaria eradication has been certified by PAHO/WHO.
ci Includes an area of 407,945 km2 where malaria eradication has been certified by PAHO/WHO
Table 7
MALARIA MORBIDITY IN THE AMERICAS 1958 - 1990
Population
(Thousands) Blood Slides
Morbidity per 100,000 inhabitants
Total Malarious Examined Positives % Total Malarious
country Area country area
…__ _ _ _ _ _ _ _ _ _ _ _ _ _ _ __ _ _ _ _ = = = = = _ = = = = = = = = = = = = _ = _…__ 387,276 394,606 400,500 416,008 427,919 434,950 447,666 455,527 463,649 474,868 484,664 491,483 505,819 513,544 524,774 535,109 544,865 555,676 565,249 576,942 587,704 600,263 610,021 627,375 635,954 639,212 659,535 665,777 662,983 672,941 703,370 715,994 698,741 135,409 145,920 143,586 147,292 153,742 152,021 158,642 146,389 166,469 169,901 174,704 176,325 181,257 185,492 190,448 195,528 200,755 205,872 211,086 215,550 220,153 226,361 231,366 239,260 245,307 249,327 257,276 259,838 263,371 268,217 280,758 285,394 278,600 1,716,103 2,749,117 3,955,149 5,341,004 7,221,367 7,903,156 8,156,290 9,069,950 11,797,983 11,609,228 12,522,696 12,179,190 9,925,162 10,134,212 9,695,953 9,400,682 8,997,318 9,276,878 9,352,775 9,274,480 9,493,751 8,630,653 8,943,369 9,100,529 8,826,418 9,113,611 9,422,827 9,485,203 10,070,388 9,764,285 10,092,472 9,638,847 9,459,912 56,705 75,612 79,998 99,639 177,089 227,026 254,572 241,462 333,280 369,388 282,773 323,782 344,170 338,416 284,813 280,276 269,003 356,692 379,364 398,925 468,923 515,271 602,836 629,629 715,177 830,700 931,356 910,917 950,570 1,018,864 1,120,040 1,113,764 1,045,808 3.30 2.75 2.02 1.87 2.45 2.87 3.12 2.66 2.82 3.18 2.26 2.66 3.47 3.34 2.94 2.98 2.99 3.84 4.06 4.30 4.94 5.97 6.74 6.92 8.10 9.11 9.88 9.60 9.44 10.43 11.10 11.55 11.06 14.64 19.16 19.97 23.95 41.38 52.20 56.87 53.01 71.88 77.79 58.34 65.88 68.04 65.90 54.27 52.38 49.37 64.19 67.11 69.14 79.79 84.47 98.82 100.36 112.46 129.96 141.21 136.82 143.38 151.40 159.24 155.55 149.67 41.88 51.82 55.71 67.65 115.19 149.34 160.47 164.95 200.21 217.41 161.86 183.63 189.88 182.44 149.55 143.34 134.00 173.26 179.72 185.07 213.00 227.63 260.56 263.16 291.54 333.18 362.01 350.57 360.92 379.87 398.93 390.25 375.38 a) The information of some countries is provisional
Jul/29/91 (hs)
---NUMBER OF BLOOD SLIDES EXAMINED AND WITH PLASMODIA, BY GEOGRAPHICAL SUB-REGIONS
AND BY PHASES OF THE PROGRAMS, 1990
Country (by geographical
sub-region) *
Tot a l Maintenance Consolidation Attack phase Non-malarious areas
Blood slides Blood slides Blood slides Blood slides Blood slides
...
Examined Positive Examined Positive Exam. Posit. Exam Posit. Exam. Posit.
Bahamas a) Barbados a) Bermuda a) Canada a) Cuba Chile Dominica United States Grenada Guadeloupe Caiman Islands Jamaica Martinique Saint Lucia Trinidad & Tabago
801,946 0 0 43 281 229 8,217 4 3 3 368 462 0 0 877 0 0 12 4 6 801,946 0 0 43 281 229 8,217
... 4 ... 3 ... 3 ... 368 462 0 0 877 0 0 12 4 6
Mexico 1,503,208 44,513 - - - 1,503,208 44,513 -
-Bel1ze 17.204 3,033 - - - - 17,204 3,033
-Costa Rica 113,167 1,151 - - 62,363 923 50,334 132 470 96
El Salvador 230,246 9,269 - - - - 230,246 9,269 -
-Guatemala 305,791 41,711 - - - - 305,791 41,711 -
-Honduras 418,513 53,095 - - - - 418,513 53,095 -
-Nicaragua 465,830 35,785 - - - - 465,830 35,785 -
-Panama 315,359 381 - - 136,593 27 178,766 354 -
-Haiti 13,743 4,806 - - - - 13,743 4,806 -
-Dominican Rep. 297,599 356 247,231 261 14,560 41 35,753 54 55 0
French Guiana 49,192 5,909 7,691 663 19,987 2,613 21,514 2,633 -
-Guyana 135,260 22,681 - - -
-Suriname 18,594 1,608 5,176 261 - 2,200 424 11,218 923
Brazil 3,294,234 560,396 62,097 2,020 504,153 5,760 2,699,502 547,658 28,482 4,958
Bolivia 121,743 19,680 - - - - 121,743 19,680
-Colombia 496,087 99,489 - - 119,309 5,299 376,778 94,190 -
-Ecuador 363,080 71,670 - - - - 362,351 71,502 729 168
Peru b) 90,040 28,882 - - - 90,040 28,882 -
-Venezuela c) 277,164 35,082 193,214 24,642 - 82,221 9,789 1,729 651
Argentina 24,725 1,660 12,145 335 - 12,552 1,297 28 28
Paraguay 98,417 2,912 4,112 7 39,807 138 54,344 2,748 154 19
T 0 T A L 9,459,912 1,045,808 1,342,382 29,550 896,772 14,801 7,042,633 971,555 42,865 7,221
MAP 2
COUNTRIES WITH NO EVIDENCE OF TRANSMISSION
Population Registered malaria cases
Countries or 1990 a)
territories originally
malarious 1987 1988 1989 1990
area
Bahamas 262 b) 18 c) 17 c) 5 d) 4 c)
Barbados 261 b) 1 c) 1 1 d) 3 c)
Bermuda 58 b) 0 1 d) 3 c)
Canada 26,525 b) 327 c) 184 e) 195 e) 368 e)
Cuba 3,608 290 824 762 462
Chile 325 2 0 0 0
Dominica 17 ... 0 0 0
USA 64,166 786 870 1,203 d) 877 d)
Grenada 39 ... ... 0 0
Guadalupe 333 ... ... 4 ...
Caiman Islands 21 2 c) 0 4 ...
Jamaica 2,041 6 4 2 c) 0
Martinica 207 ... ... 23 12
Saint Lucia 115 3 c) ... ... 4
Trinidad & T. 1,178 5 8 10 6
T O T A L 99,156 1,440 1,908 2,210 1,739
a) Population estimated in thousand inhabitants, from areas originally malarious. b) Total population. c) Information from the Weekly Epidemiological reports. d) Information from the CAREC Surveillance Report. e) Information from the
Canada Weekly Report.
Table 9
SLIDES EXAMINED AND POSITIVES, BY SPECIE OF PLASMODIUM NON-MALARIOUS AREAS, 1990
Country Blood slides Specie of plasmodium
By geographical
region Examined Positives % P. falci P.vivax P.
ma-parum lariae
Bahamas a) ... 4 ...
Barbados a) ... 3 ...
Bermuda a) ... 3 ...
Canada a) ... 368 ...
Costa Rica 470 96 20.43 2 94
-Dom. Republic 55 0 0.00 - -
-Suriname 11,218 923 8.23 902 18 3
Brazil 28,482 4,958 17.41 1,544 3,410 4
Ecuador 729 168 23.05 12 156
Venezuela b) 1729 651 37.65 110 541
Argentina 28 28 100.00 - 28
-Paraguay 154 19 12.34 2 17
-TOTAL 42,865 7,221 16.85 2,572 4,264 7
... No available information (hs)
a) Information del "weekly epidemiological report"
b) Information up to September.
FIGURE 4
PERCENTAGE OF MALARIA CASES
AMERICAN REGION, 1990
BRAZIL
53.5%
ANDEAN REGION
24.3%
UT TRANSMISSION, 0.1% ,-SOUTHERN CONE, 0.4%
I
CARIBEAN AREA, 0.4%'GUIANAS, 2.8%
MEXICO, 4.2%
EPIDEMIOLOGICAL SITUATION OF 21 COUNTRIES WITH ACTIVE MALARIA PROGRAMS, 1990
Countries Population Blood slides Species of parasites Epidemiological Indicators t
(by geographical malarious
---sub-regions) areas Examined Posit. P. falc. P. vivax P.mal. IAES ILP IPA % de P.falc. & Mixed
Mexico 40,000 1,503,208 44,513 62 44,451 0 3.76 2.96 1.11 0.14
Belize 183 17,204 3,033 40 2,987 6 9.40 17.63 16.57 1.32
Costa Rica 835 113,167 1,151 5 1,146 0 13.55 1.02 1.38 0.43
El Salvador 4,727 230,246 9,269 18 9,251 0 4.87 4.03 1.96 0.19
Guatemala 3,429 305,791 41,711 1,008 40,703 0 8.92 13.64 12.16 2.42
Honduras 4,620 418,513 53,095 659 52,436 0 9.06 12.69 11.49 1.24
Nicaragua 3,871 465,830 35,785 1,568 34,217 0 12.03 7.68 9.24 4.38
Panama 2,325 315,359 381 105 276 0 13.56 0.12 0.16 27.56
Sub-total 19,990 1,866,110 144,425 3,403 141,016 6 9.34 7.74 7.22 2.36
Haiti 5.360 13,743 4,806 4,806 0 0 0.26 34.97 0.90 100.00
rh Dominican Rep. 7,127 297,599 356 334 22 0 4.18 0.12 0.05 93.82
Sub-total 12,487 311,342 5,162 5,140 22 0 2.49 1.66 0.41 99.57
French Guiana 112 49,192 5,909 Z,2,607 Z03 292 10 43.92 12.01 52.76 44.12
Guyana b) 768 135,260 22,681 )ib12,904VZ~9,777 0 17.61 16.77 29.53 56.89
Suriname 302 18,594 1,608 £ cO,, -\ 1,5 8 4 21 3 6.16 8.65 5.32 98.51
Sub-total 1,182 203,046 30,198 17,095 13,090 13 17.18 14.87 25.55 56.61
Brazil 67,342 3,294,234 560,396 - 252,1914308,184 21 4.89 17.01 8.32 45.00
Bolivia 2,645 121,743 19,680 ...: 652 i.9,028 0 4.60 16.17 7.44 3.31
Colombia 22,555 496,087 99,489 1, )35,4902 963,855 144 2.20 20.05 4.41 35.67
Ecuador 6,250 363,080 71,670 3,21.871i4L,49,799 0 5.81 19.74 11.47 30.52
Peru c) 7,199 90,040 28,882 ),( 131%528,693 58 1.25 32.08 4.01 0.45
Venezuela d) 15,519 277,164 35,082 (, ~9,1351,W-25,944 3 1.79 12.66 2.26 26.04
Sub-total 54,168 1,348,114 254,803 67,279 187,319 205 2.49 18.90 4.70 26.40
Argentina 4,241 22,624 1,660 1 1,659 0 0.53 7.34 0.39 0.06
Paraguay 3,706 98,417 2,912 55 2,857 0 2.66 2.96 0.79 1.89
Sub-total 7,947 121,041 4,572 56 4,516 0 1.52 3.78 0.58 1.22
T 0 T A L 203,116 8,647,095 1,044,069 345,226 698,598 245 4.26 12.07 5.14 33.07 * ABER = Annual Blood Examilation Rate. SPR = Slide Positive Rate. API = Annual Parasite Incidence
P. falc. = Plasmodium falciparum. P. mal. = Plasmodlum malariae
MAP 3
MEXICO. CENTRAL AMERICA, BELIZE, PANAMA, HAITI AND DOMINICAN REP.
6V _, -i
-* m;) -, I;
Population Registered Malaria cases
1990 a) ---Countries Originally
malarious 1987 1988 1989 1990
area
Mexico 40,000 102,984 116,238 101,241 44,513
Belize 183 3,258 b) 2,725 3,285 3,033
Costa Rica 835 883 1,016 699 1,151
El Salvador 4,727 12,834 9,095 9,605 9,269
Guatemala 3,429 57,662 52,561 42,453 41,711
Honduras 4,620 19,095 29,737 45,922 53,095
Nicaragua 3,871 17,011 33,047 45,982 35,785
Panama 2,325 1,195 1,000 427 381
Total, CAPB 19,990 111,938 129,181 148,373 144,425
______----_______________
Haiti
Dominican Rep.
5,360 7,127
12,134 1,206
12,306 c) 23,231
1,072 1,275
Total, CARIBE 12,487 13,340 13,378 24,506 5,162
TOTAL 72,477 228,262 258,797 274,120 194,100
a) Population in thousands of inhabitants. b) Provisional figures. c) Incomplete information.
26
MAP 4
BRAZIL AND GUIANAS
Population Registered Malaria Cases
1990 a)
Country Originally
malarious 1987 1988 1989 1990
area
Brazil 67,342 508,864 559,535 577,520 560,396
French Guiana 112 3,318 3,188 6,284 5,909
Guyana 768 34,142 35,470 20,822 22,681
Suriname 302 2,044 2,691 1,704 1,608
Total, Gianas 1,182 39,504 41,349 28,810 30,198
T 0 T A L 68,524 548,368 600,884 606,330 590,594
a) Population in thousands of inhabitants. b) Inf. up to November
MAPA 5
ANDEAN AREA AND SOUTHERN CONE
Population Malaria cases registered
1990 a)
---Country Originally
malarious 1987 1988 1989 1990
area
Bolivia 2,645 24,891 22,258 25,367 19,680
Colombia 22.555 90,014 100,850 100,286 99,489
Ecuador 6,250 63,503 53,607 23,274 71,670
Peru 7,370 39,136 b) 32,359 b) 32,114 b) 28,882 c)
Venezuela 15,115 17,988 45,349 43,374 35,082 d)
______________________________________________________ - - - - - .--___
Total Area Andina: 53,935 235,532 254,423 224,415 254,803
Argentina 4,220 1,521 666 1,620 1,660
Paraguay 3,533 3,741 3,884 5,247 2,912
Total Cono Sur 7,753 5,262 4,550 6,867 4,572
T 0 T A L 61,685 240,794 258,973 231,282 259,375
a) Population in thousand inhabitants. b) Provisional figure. (hs)
c) Information up to October. d) Information up to September.
MALARIA CASES REGISTERED IN THE REGION OF THE AMERICAS, 1987-1990
Countries Population 1987 1988 1989 1990
(by geographical 1990 a)
---sub-regions malarious Casos Casos Casos Casos
areas registrados % registrados % registrados % registrados %
Countries without transmission and where Eradication of Malaria
has been certified 75,313 b) 1,440 c) 0.14 1,908 c) 0.17 2,032 c) 0.18 1,739 c) 0.17
MEXICO 40.000 102,984 10.11 116,238 10.38 101,241 9.09 44,513 4.26
CAPB Belize 183 3,258 c) 2,725 3,285 3,033
Costa Rica 835 883 1,016 699 1,151
El Salvador 4,727 12,834 9,095 9,605 9,269
Guatemala 3,429 57,662 52,561 42,453 41,711
Honduras 4,620 19,095 29,737 45,922 53,095
Nicaragua 3,871 17,011 33,047 45,982 35,785
Panama 2,325 1,195 1,000 427 381
Sub-total 19,990 111,938 10.99 129,181 11.53 148,373 13.32 144,425 13.81
CARIBE Haiti 5,360 12,134 12,306 d) 23,231 4,806
Dominican Rep. 7,127 1,206 1,072 1,275 356
Sub-total 12,487 13,340 1.31 13,378 1.19 24,506 2.20 5,162 0.49
GUIANAS French Guiana 112 3,318 3,188 c) 6,284 5,909
Guyana 768 c) 34,142 35,470 20,822 22,681 c)
Suriname 302 2,044 2,691 1,704 1,608
Sub-total 1,1R2 39,504 3.88 41,349 3.69 28,810 2.59 30,198 2.89
BRAZIL 67,342 508,864 49.94 559,535 c) 49.96 577,520 51.85 560,396 53.58
_____________________________________________________________________________________________________________________________________
ANDEAN REGION Bolivia Colombia Ecuador Peru Venezuela Sub-total
2,645 22,555 6,250 7,370 15,519 54,339
24,891 90,014 63,503
39,136 c)
17,988 235,532
22,258 100,850 53,607 32,359 c) 45,827 23.12 254,901
25,367 100,286 23,274 32,114 d) 43,374 22.76 224,415
19,680 99,489 71,670 28,882 35,082 20.15 254,803 SOUTHERN CONE Argentina 4,241 1,521 666 1,620 1,660 Paraguay 3,706 3,741 2,884 5,247 2,912
Sub-total 7,947 5,262 0.52 3,550 0.32 6,867 0.62 4,572 0.44 TOTAL 278,600 1,018,864 100.00 1,120,040 100.00 1,113,764 100.00 1,045,808 100.00
- - - -- - - - -- - - - -- - - - -- - - - --- - -- - - -- -- - -- - - -- - - -- - - -- - - - -- - - -- - - -- - --2 4 .36-
-a) Population in thousands. b) The total population of these countries Is 289,003
population of countries which have never been malarious, (see Table and Map 2).
d) Incomplete provisional figure. e) Information up to October. d) Information up
(hs)
Inhabitants; including the total c) Provisional figure.
to September.
ED
e) f)
Table 12
COMPARATIVE RESULTS OF ACTIVE AND PASSIVE CASE DETECTION UNDER MALARIA PROGRAMS IN THE AMERICAS, 1990
Number Active case detection Pasive case detection T 0 T A L
Countries of --- - - -
-(by geographical Evalua- Blood slides Product. Blood slides Average Blood slides
sub-region) * totrs --- notific.--- slides per ---Examined Positives x Posts Examined Positives productive Examined
Posi-% Not. post tives %
====...======...:...==-...=...======...==:===:...=.==.=..
Bahamas a) Barbados a) Bermuda a) Canada a) Cuba Chile Dominica United States Grenada Guadeloupe Caiman Islands Jamaica Martinique Saint Lucia
Trinidad & Tobago
91,815 231 4,617 4 3 3 710,131 43 50 229 3,600 0 6 4 801,946 0 0 43 281 229 8,217 0.00 5.24 3 3 368 877 0 0 12 4 0 3 3 368 462 0 0 877 0 0 12 4 6 0.06 0 0 0.00 0.00 5.24 0.07
Mexico ... ... .... ... ... ... ... 1,503,208 44,513 2.96
Belize 19 5,980 442 7.39 317 11,224 2,591 23.08 2.95 17,204 3,033 17.63
Costa Rica 110 110,057 154 0.69 79 3,110 397 12.77 3.28 113,167 1,151 1.02
El Salvador 105 557_995 494 0.85 2,503 172,25L1 8,775 5.09 5.73 230,246 9,269 4.03
Guatemala 100 397 8 2.02 1,780 305,394 41,703 13.66 14.30 305,791 41,711 13.64
Honduras 180 .. .. ... ... ... ... 418,513 53,095 12.69
Nicaragua 205 47,015 921 1.96 3,924 418,815 34,864 8.32 8.89 465,830 35,785 7.68
Panama 294 182,000 227 0.12 240 133,359 154 0.12 46.31 315,359 381 0.12
Haiti - - - ... 13,743 4,806 34.97 ... 13,743 4,806 34.97
Dominican Rep. 168 251,974 201 0.08 ... 45,625 155 0.34 ... 297,599 356 0.12
French Guiana ... 20,163 950 4.71 ... 29,029 4,959 17.08 ... 49,192 5,909 12.01
Guyana b) ... ... ... ... ... ... 135,260 22,681 16.77
Suriname 45 5,981 483 8.08 108 12,613 1,125 8.92 9.73 18,594 1,608 8.65
Brazil ... 1,397,364 53,384 3.82 20,125 1,896,870 507,012 26.73 7.85 3,294,234 560,396 17.01
Bolivia 64 83,649 6,628 7.92 ... 38,094 13,052 34.26 ... 121,743 19,680 16.17
Colombia 337 89,996 9,504 10.56 312 406,091 89,985 22.16 108.46 496,087 99,489 20.05
Ecuador ... 41,992 7,092 14.78 ... 315,088 64,578 20.50 - 363,080 71,670 19.74
Peru c) ... 15,679 2,562 16.34 ... 74,361 26,320 35.39 ... 90,040 28,882 32.08
Venezuela d) 724 167,296 6,830 4.08 ... 109,868 28,252 25.71 - 277,164 35,082 12.66
Argentina 70 16,657 598 3.59 53 8,068 1,062 13.16 12.69 24,725 1,660 6.71
Paraguay ... 50,100 483 0.96 ... 48,317 2,429 5.03 ... 98,417 2,912 2.96
T o t a 1 - 2,646,958 91,567 3.46 - 4,755,983 833,490 17.53 - 9,459,912 1,045,808 11.06
... No available Information.
a) Information from Weekly Epidemiological Report. b) Provisional information. c) Information up to October.
(hs)
d) Information up to September.
o
---SPRAYINGS WITH RESIDUAL INSECTICIDES APPLIED IN 1989 and 1990
HIvdrochlorides Orqanoohosphates
DDT Malathion Propoxur Bend1ocarb Deltamethrin Deltamethrim
_...
---1989 1990 1989 1990 1989 1990 1989 1990 1989 1990 1989 1990
Mexico 1,509.022 1.830.543 - - 3,469 - - - 74,068 27.222 -
-_. .... - - - -- - - -5, 2 1
--10.493 7.492
- - 153.401 1,850 a)
- - 134,593 123,963
- - - 68,348
- - 15,665 13,955 b)
9,171 73,866 28,507
2,892
5,217 70,496
(b)
3,765 18,116
76,043 295,641
- - 105,454
Haiti - - - 206.541 - - -
-Domincan Rep. 13.788 17.,342 - - -
-French Guiana 68,000 c) - .-
-Guvana 4.490 ... - ... ...
Suriname 176 3,959 - - -
-Brazil 2.332,347 d) 1.527.169 d) - - -
-Bolivia 94.457 99,989 213 - -
-Colombia 225,721 e) 210.593 - - (e) 13,993 - -
-Ecuador 9,035 173,987 133.144 30.265 2,167 - -
-Peru ... 41.564 - - -
-Venezuela 193.089 126.711 f) - 129.144 82,092 . .
Argentina 8,165 q) 27.868 q) - - - -
-Paraguay 39,386 29.047 15,249 - - -
-T 0 -T A L 4,522,940 4,088.772 159,099 37,757 644,980 304,201 114,436 75,713 77,833 45,338 181,497 295.641
... Information not available.
a) (GUT) Includes houses soraved with Deltamethrim and Fenitrothion. b) (PAN) Includes sprayed houses with Propoxur and Fenitrothlon.
c) (FRG) Includes houses soraved with Deltamethrin, Fenitrothion and Actellic. d) (BRA) Includes houses sprayed with DDT, Nalathion and Deltamethrim. e) (COL) Includes houses sprayed with DDT and Fenitrothion. f) (VEN) Information up to September.
q) (ARG) Includes houses soraved with DDT and K'otrina. Ju1.31/91 (hs!
Countries (bv qeoqra-sub-reqions)
24,460 Belize
Costa Rica El Salvador Guatemala b)
Honduras Nicaraqua Pamama
Carbamatos P1rethroides
804
.
-Cuadro 14
INSECTICIDAS UTILIZADOS EN 1990 POR LOS PROGRAMAS DE MALARIA. Y CANTIDAD ESTIIADA PARA 1991
o D T (K9)
1990
Nalation
50 X
1991 (Est. ) 1001 751 1001 751
1991 1990 (Est)
Propoxur 501 Fenitrotion 401
(Kg.) (Kg.)
1990 1991 1990 1991 1990 1991
ReXCIGU U,'aZ 1,bZ0 u 4, UU I,4IL,II 111,444 I44,53- - a- tt,: Il IIJ,)UQ a?
Belice 5,000 8,000 5,000 8,000 972 b) 972 b)
Costa Rica - - - 6,559 c) 14,000 c) 1,897 3,000 - 2,370 c) 4,000 c) El Salvador - - 11,302 ... - 7,876 d) 10,000 d) Guatemala - 3,014 40,000 85,809 100,000 34,460 a) 65,000 e) Honduras - - - 507,424 500,424
-Nicaragua - - - 10,127 15,000 27,339 f) 20,000 f) Panama - 906 .. , 6,872 9) 18,000 9) -
-Haiti - -
-Rep. Dominicana 119 ... 7,192 ...
Guay. Francesa - 280 .. - - - - 3,820 h) ... Guyana ... .. ... ...
Suriname 70 3,394 200 4,000 ... ... ... ... ... ... ... Brasil 24,033 354,680 - 1,680,000 7,500 ... - - 2,792 i) ...
Bolivia - 113,057 - 100,000 -
-Colombia 312 118,939 7,000 330,000 - - 5,375 60,000 Ecuador 340 102,355 400 212,000 21,654 50,000 -
-Peru - 16,722 ... 276,800
-Venezuela j)- - - 42,229 57,448 - 92,300 k) 186,673 k) 100,986 1) 168,013 1) Argentina 701 5,496 1,000 10,000 - - 5841 ) -
-Paraguay - 14,141 - 16,215
-Total a1,100 1,990,309 15,5172 4,058,190 196,248 266,956 17,119 43,000 108,491 880,097 374,195 440,833 ... No so dispone de informacion.
a) (NEX) En 1990 incluye 138,650 Kg. Fention 21, 3,440 Lit. Temefos 50, 41,500 Kg. Taeufos 1S y 11,002 Kg. Bndiocrb 80X.Para 1991 so estiman 19,000 [g. Fention 21, 4,320 L Tamaefos 501; y 90,500 K9. Teeefos 11 b) (8ZE) 6alones de Fenitrotion. c) (COR) Incluye, 4,057 K. HIl. 501,
962 Lit, Nal. 951 y 1550 L. Nal 571. Para 1991 so estiman 10,000 K. Nalation 50, 2,000 L. Hal. 95 y 2,000 Lt. Ial. 571 d) (ELS) Incluye 6,321 K. Bendiocarb 801, 425 Gal. Abate en Emulsion y 1,130 Gal. Permetrina. a) (GUT) Incluye 10,199 K. Deltamatrina 5S y 29,261 K. Fention
21. Para 1991 so estiman 15,000 K Deltametrina 5S y 50,000 K Fenti6n 2S. f) (NIC) Kilos de Deltaletrina. g) (PAN) Incluye 6,872 K.
Fenitrotion 401 y 656 L. Fenit. 50S y para 1991 se estiman 18,000 K. y 1,000 L. Fenitrotion 40 y 501. h) (FRG) Litros DDT.
Jul/19/91 (hs)
32 Pals
Otros
--- --- -
Table 15
NUMBER OF INTRADOMICILIARY SPRAYINGS WITH RESIDUAL INSECTICIDES, 1987-1990
1987
Insecticides Number Number
1988 1989
Number Number
1990
of Sprayings of Sprayings of Sprayings of Sprayings
countries countries countries countries
= = = = = = = == = =_= = = = =_= = =_= = = = = = == ==- = = = = = = = = =_= = = = = = = = = = = = = = = = = = = = = = = = = = = = = = = = = = = = = = = = = = = = = = = = = = = = = = =_= = = = = = = = = = = = = =
DDT
FENITROTION PROPOXUR MALATHION
DELTAMETHRIN
w BENDIOCARB
W
12 b)
9 b) 5
1
3
i
3,979,995 b) 640,741 b)
123,841 12,899 191,806 g) 121,618
15 c)
6 4
2 3 1
4,523,053 c) 476,335
88,809 162,621 133,991 181,484
14 d) 4,522,940 d)
7 644,980
4 114,436
4 159,099
2 181,497
2 77,833
CHLUOXUAIM 1 ,4ZU - -
-T 0 -T A L - 5,076,320 5,566,293 - 5,700,785 - 4,833,429
_______________________________________________________________________________________________________________________
a) Information from two countries is not included. b) Includes sprayings with Fenitrothion and Deltamethrim from two countries. c) Includes Sprayings with Malathion, Fenitrothion, Deltamethrim and Piretroides from 3 countries. d) Includes Sprayings with DDT, Deltamethrim, Malathion and Actellic from 4 countries. e) Includes sprayings with
Malathion and Deltamethrin from 3 countries. f) Includes houses sprayed with Deltamethrim, Fenitrothion and Propoxur Jul.31/91 (hs)
Jan/24/91 (hs)
e)
f)
10 5 2 2 1 2
e)
9)
f) 4,088,772
290,208 75,713 37,757 295,641 45,338
- - - -