Air Pollution
Problems in Latin America1
HENYK WEITZENFELD~
Air pollution and associated health problems in Latin America are on the rise. This article provides an overview of conditions indicated by the admittedly limited data available, notes some of the present situation’s health implications, and points out areas where air pollution data procurement and control measures could be improved.
A
ir quality in many cities, especially in the rapidly growing capitals of developing countries, has deteriorated to such an extent that it is having a signif- icant respiratory impact upon susceptibleindividuals. The World Health Organi-
zation (WHO) estimates that over 600 million people are now being exposed to sulfur dioxide concentrations far in ex-
cess of what could be considered in-
offensive, and that over a billion people are being exposed to suspended particle
concentrations exceeding WHO-recom-
mended limits.
In recent times we have become in- creasingly aware of hazards posed by in- door air pollution-such as the pollution caused by burning wood or coal to heat or cook in poorly ventilated spaces, a practice common to rural areas of many
developing countries that regularly ex-
poses women and children to high levels of air pollution. Beyond that, of course, we know that in the world’s urban areas
population growth combined with sig-
nificant increases in industrialization, en-
ergy production, interior heating, and
‘Condensed version of an article by the same author published in Spanish in the B&tin de In Oficina Sunifuriu Punamericana, Vol. 112, No. 2, pp. 97-109. 2Environmental Engineering Consultant, PAHO/ WHO Pan American Center for Human Ecology and Health, Apartado Postal 37-473, 06696 Mexico, DF, Mexico.
18 Bulletin of PAHO 26(l), 1992
motor vehicle traffic have substantially boosted levels of air pollution. Further-
more, winds can carry pollution great
distances, far from its points of origin,
and phenomena such as acid rain show
that air quality is frequently not what it used to be. Today, keeping the air healthy means facing the costs of implementing antipollution measures. Clean air, as it once was, is no longer free (I).
In Latin America, as elsewhere, urban
population growth has made a major
contribution to increases in the concen- trations of urban atmospheric pollutants. As of 1950, some 15 million people lived in Latin American cities of over one mil- lion inhabitants. By 1980 this figure had risen to about 101 million, and by the year 2000 it is expected to reach 232 mil- lion. Of course, the amount of pollution released into the air depends not only on the number of people but also their de- gree of concentration, the concentration of industrial emitters of pollutants, en-
ergy consumption patterns, the number
of motor vehicles in use, and the partic- ular roles played by various specific sources of pollution. In this regard, going
beyond simple population growth and
urbanization, patterns of increased en-
ergy consumption and motor vehicle use
tend to serve as good indicators of rising air pollution levels’.
Two other pollution indicators, one
motor vehicle use, are levels of carbon dioxide (CO,) emission and levels of air- borne lead particles produced by burning gasoline. According to information pub- lished by the World Resources Institute, in 1950 Latin America was responsible for an estimated 1% of the CO, emitted as a result of human activity; by 1965 this fig- ure had reached 3%, and by 1985 it had risen to 6%. Regarding the hazard of air- borne lead particles, it is worth noting that the gasolines used in Latin America and the Caribbean have been found to possess the highest lead content in the world, this content ranging from 0.64 to 0.84 g/l in 1984, for example, as compared to 0.15 to 0.40 g/l in Europe that same year (2).
Some Latin American cities, including
Mexico City and Santiago, confront se-
rious problems posed by the phenome- non of thermal inversion (an increase in
temperature with altitude), which sup-
presses the vertical mixture of pollutants and results in stratification and reduced
dispersion. Thermal inversions com-
monly occur in winter in affected cities and account for the relatively high con- centrations of pollutants often found dur- ing that season in those cities. Of course,
this is only one key way in which air quality is more generally influenced by climate, acting through a variety of spe- cific meteorologic factors including tem- perature, humidity, wind, precipitation,
atmospheric pressure, and solar radia-
tion, all of which can significantly affect
the chemistry or concentration of
pollutants.
Overall, it appears that while pollution levels in some Latin American cities are still within the limits established by WHO, many of these same cities will experience air pollution problems within a few years’ time if present trends continue.
Table 1 provides information about
growing levels of energy consumption and motor vehicle numbers in seven of the larger Latin American countries as well as data on rates of increasing urbaniza- tion in selected metropolitan areas. The
energy consumption data show varying
but generally substantial national in-
creases in energy consumption during the 1974-1986 period, while the motor ve- hicle data show that the numbers of ve- hicles in use rose even faster in each country over the shorter 1975-1984 pe- riod. The air pollution implications of these
trends are compounded by urbanization
Table 1. Variations in certain factors influencing the emission and concentration of air pollutants in selected Latin American countries.
Rates of growth (%) over indicated aeriod in:
Average annual population increase in the indicated
metroaolitan
Energy No. of areas, 1970- 1980’
Country
consumption (1974-86)a
vehicles (1 975-84)b
Metropolitan area
% increase
Argentina 26 50 Buenos Aires 1.6
Brazil 50 85 Sio Paul0 4.4
Chile 16 107 Santiago 2.7
Colombia 47 132 Bogota 3.0
Mexico 76 107 Mexico City 4.0
Peru 9 46 Lima 3.7
Venezuela 80 142 Caracas 1. 9
dCalculated in carbon equivalent from all sources of commercial generation. Source: reference 3, pp. 566-97. %cludes both passenger and commercial vehicles. Source: reference 3, pp. 714-16.
trends such as those shown in the last column of the table, which indicate av-
erage annual population growth of 1.6%
to 4.4% in the indicated metropolitan areas
during the 1970-1980 period. Figures
based on motor vehicle growth trends
suggest that emissions could double in some cases by the end of this century, while urbanization data suggest that pol- lutant concentrations in certain cities could triple if observed growth trends persist and no corrective measures are taken to control pollution.
AIR QUALITY MONITORING
In recent decades Latin America has been increasing its participation in work on global air pollution problems, and there is now some information about air qual- ity in several cities of the region.
One entity, the Pan American Air Pol-
lution Sampling Network (REDPAN-
AIRE), was established by the Pan Amer- ican Center for Sanitary Engineering and
Environmental Sciences (CEPIS) in 1967
and published its final report in 1982. This report (5), which provides a detailed
review of REDPANAIRE’s work, in-
cludes data from samples taken at over 100 stations set up throughout the Amer- icas. These data indicate that during the
network’s operation some 70% of the
dustfall particle samples, 20% of the sus- pended dust samples, and 28% of the
sulfur dioxide (SO,) samples exceeded
reference levels, indicating excessive
pollution.
Seven Latin American nations (among a total of 50 countries worldwide) have
also participated in the Global Environ-
mental Monitoring System (GEMS), es-
tablished in 1975, by providing air quality
data to that body (6). Published GEMS
data show that as of 1980-1984 three cit- ies (Rio de Janeiro, Sgo Paulo, and San- tiago) had annual average SO, levels above
the maximum permissible concentration
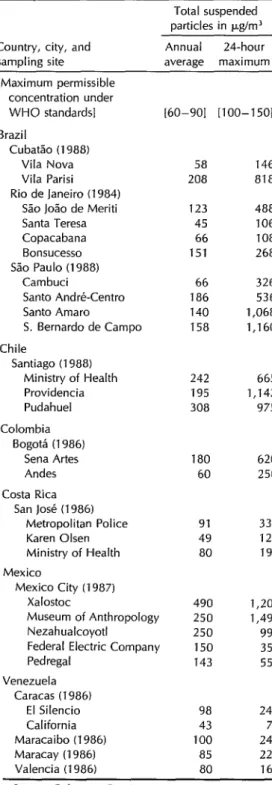
Table 2. Air quality data (suspended particle levels) at specific sites in certain Latin American cities.
Total suspended particles in t.uYrn3
Country, city, and sampling site
Annual 24hour average maximum
[Maximum permissible concentration under
WHO standards] [60-901 [loo-1501
Brazil
Cubatao (1988) Vila Nova Vila Parisi Rio de Janeiro (1984)
Sao Jo%0 de Meriti Santa Teresa Copacabana Bonsucesso Sao Paul0 (1988)
Cambuci
Santo Andre-Centro Santo Amaro
S. Bernard0 de Campo
Chile
Santiago (1988) Ministry of Health Providencia Pudahuel
Colombia Bogota (1986)
Sena Artes Andes
Costa Rica San Jose (1986)
Metropolitan Police Karen Olsen Ministry of Health
Mexico
Mexico City (1987) Xalostoc
Museum of Anthropology Nezahualcoyotl
Federal Electric Company Pedregal
Venezuela Caracas (1986)
El Silencio California Maracaibo (1986) Maracay (1986) Valencia (1986)
58 146
208 818
123 488
45 106
66 108
151 268
66 326
186 536
140 1,068
158 1,160
242 665
195 1,142 308 975
180 620 60 250
91 333
49 127
80 191
490 1,209
250 1,494
250 990
150 355 143 550
98 247
43 71
100 244
85 227 80 168
Sources: References 7- 14.
established by WHO for this pollutant. Two cities (Rio de Janeiro and Caracas) had annual total suspended particle (TSP)
averages above the WHO maximum,
while another (MedeKn) was at the WHO
TSP maximum. One city (Santiago) had
an annual average nitrogen dioxide (NOJ
level above the maximum established
by WHO. And one city (S&o Paula) had
average eight-hour maximum carbon
monoxide (CO) values above the WHO
maximum.
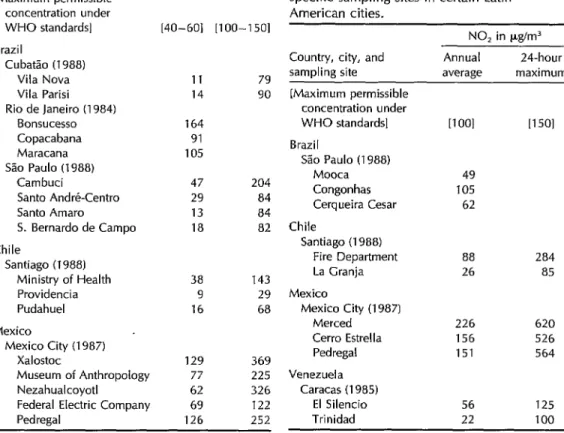
Table 3. Air quality data (SO, levels) at specific sampling sites in certain Latin American cities.
Additional data on relevant air quality indicators in certain cities, provided through reports prepared by various state
and national organizations (7-14), are
shown in Tables 2 through 6. In some
instances the comparability of the data from one city to the next is open to ques- tion, because the study methods used by
the various entities involved were not
necessarily the same. Obviously, in each case responsibility for the accuracy of the data lies with the organization supplying the information.
Although WHO and PAHO collect and
publish this information (previously
through REDPANAIRE and currently
through GEMS), no international proce-
dure exists to control the information’s
SO, in pglm3
Country, city, and Annual 24-hour
sampling site average maximum
[Maximum permissible concentration under WHO standards]
Brazil
Cubatao (1988) Vila Nova Vila Parisi Rio de Janeiro (1984)
Bonsucesso Copacabana Maracana S%o Paul0 (1988)
Cambuci
Santo Andre-Centro Santo Amaro
S. Bernard0 de Campo
Chile
Santiago (I 988) Ministry of Health Providencia Pudahuel
Mexico
Mexico City (1987) Xalostoc
Museum of Anthropology Nezahualcoyotl
[40-601 [loo-1501
11 79 14 90 164
91 105
47 204 29 84 13 84 18 82
38 143
9 29
16 68
129 369
77 225 62 326
Federal Electric Company 69 122
Ped regal 126 252
Table 4. Air quality data (NO, levels) at specific sampling sites in certain Latin American cities.
Country, city, and Annual 24-hour
sampling site average maximum
[Maximum permissible concentration under WHO standards]
Brazil
Sao Paulo (1988) Mooca Congonhas Cerqueira Cesar
Chile
Santiago (1988) Fire Department La Cranja
Mexico
Mexico City (1987) Merced
Cerro Estrella Pedregal
Venezuela Caracas (1985)
El Silencio Trinidad
NO, in pg/m3
[TOOI
49
105 62
88 284
26 85
226 620
156 526
151 564
56 125 22 100
[T 501
Table 5. Air quality data (0, levels) at specific sampling sites in certain Latin American cities.
Country, city, and sampling site
[Maximum permissible concentration under WHO standards]
Brazil
Cubitao (1988) Vila Nova Vila Parisi S%o Paulo (1988)
Mooca Congonhas Lapa
Mexico
Mexico City (1987) Merced
Cerro Estrella Pedregal Xalostoc
0, in ppm” (1 hr. max)
[0.075-O. 101
0.17 0.14
0.16 0.10 0.29
0.36 0.22 0.34 0.14
Sources: References 7, 12. aO.1 ppm O3 = 200 pg/m3.
validity. Nevertheless, it is assumed that the responsible organizations take steps to ensure the quality of the data is as good as possible, since these data are used to provide a basis for control programs at the national level.
In each case, the data involved may be
compared with the maximum permissi-
ble standards established by WHO,
standards that are internationally ac-
cepted, as a means of determining the
quality of air breathed by the inhabitants of these cities.
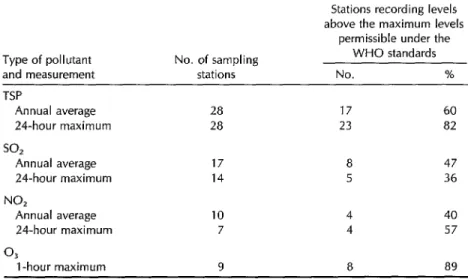
As indicated in Table 6, neither all the cities nor all the sampling stations in- volved measured all four pollutants being considered (TSP, SOz, NO,, and 0,), the
most frequently measured being TSP and
the least frequently measured being ozone (0,). Even so, it is possible to make com-
parisons between the measurements re-
ported and the WHO standards for each type of pollutant shown in Table 11. The results of this comparison, which can be seen in Table 6, indicate that the WHO standard for any one of the four pollu- tants was exceeded at a substantial share (between 40% and 89%) of the sampling stations.
Another way of looking at pollution levels is currently used in three Latin American cities (Mexico City, Sao Paulo, and Santiago) to provide the public with daily air quality information. This method
Table 6. Summary of air quality data from sampling sites in certain Latin American cities (see Tables 2-5).
Stations recording levels above the maximum levels
permissible under the
Type of pollutant No. of sampling WHO standards
and measurement stations No. %
TSP
Annual average 28 17 60
24-hour maximum 28 23 82
so2
Annual average 17 8 47
24-hour maximum 14 5 36
NO,
Annual average 10 4 40
24-hour maximum 7 4 57
03
1 -hour maximum 9 8 89
uses an air quality index with values ranging from 0 to 500, where 100 indi- cates a normal (acceptable) pollution level. Pollution levels substantially above 100 may adversely affect health, providing grounds for announcing “alert,” “warn-
ing,” and “emergency” situations (at
index values of 200, 300, and 400, re- spectively).
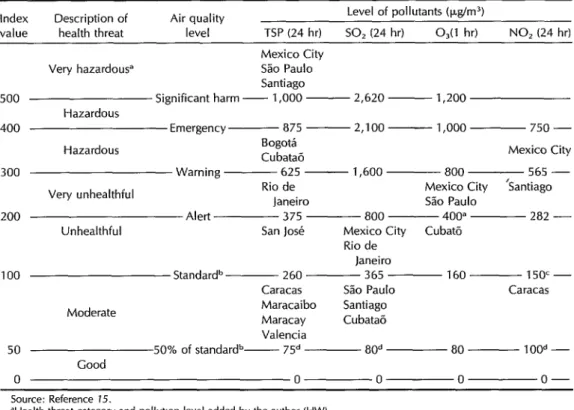
If one considers individual pollutants instead of overall pollution in this way and lists one-hour or 24-hour maximums instead of daily readings, presented ac- cording to a modified scheme proposed for the United States (15) and using re- cently published data, the results can be charted as shown in Table 7. This ap- proach provides a way of rating the cities
involved in terms of pollution levels
during the most critical season for each
of the pollutants shown in Tables 2
through 6.
AIR POLLUTION
INVENTORY
To help orient air-quality control pro- grams and assess the relative contribu- tions of various sources of pollutants, it is appropriate to make an inventory of the pollution being emitted by emission source and type of pollutant. Such in- ventories, based mainly on the rapid as- sessment (emission source) technique (17), have been made in Latin America for
many years. Studies of various major
cities-Caracas, Mexico City, Panama City,
Table 7. The health effects of poor air quality and the air quality status indicated by the sampling stations with the highest values in 11 cities (see Tables 2-5).
Index Description of Air quality Level of pollutants (t.@m3)
value health threat level TSP (24 hr) SO, (24 hr) O,(l hr) NO, (24 hr)
Mexico City
Very hazardous” S60 Paul0
Santiago
500 Significant harm ~ 1,000 - 2,620 - 1,200
Hazardous
400 Emergency ~ 875 -2,100- 1,000 750 -
Hazardous Bogota
Cubatao Mexico City
300 Warning ~ 625 - 1,600 800 565 -
Very unhealthful Rio de Mexico City ‘Santiago
Janeiro Sao Paul0
200 Alert 375 800 ~ 400= 282 -
Unhealthful San Jose Mexico City Cubato
Rio de Janeiro
100 Standard” ~ 260 365 160~ 150’-
Caracas S%o Paul0 Caracas
Moderate Maracaibo Santiago
Maracay Cubatao Valencia
50 50% of standardb- 75a 80d 80 ___ IOOd-
Good
0 0 0 0 o-
Source: Reference 15.
“Health threat category and pollutlon level added by the author (HW).
%Jnited States Environmental Protection Agency, National Ambient Air Quality Standards (NAAQS). TlJRO/WHO Value Guide.
Rio de Janeiro, San Jose, Santiago, and year in question, it is possible to estimate
S&o Paula, among others-are now the pollution emitted per capita (in kg/
available in the form of presentations made capita/year) in each city. These results are
to technical meetings or publications. as follows:
Most of these inventories group the
emission sources into two basic cate-
gories-mobile sources and fixed sources. Mobile sources consist of motor vehicles. Most of the fixed sources are point sources,
among them industrial sources grouped
into categories of industries that are im- portant polluters. There are very few in- stances in which a classification of “point sources” and “area sources” has been used.
City kglcapitalyear
Mexico City 280
Caracas 180
Siio Paul0 130
Rio de Janeiro 120
Santiago 80
The types of pollutants most com-
monly included in the inventories are CO,
hydrocarbons (HC), nitrogen oxides
(NOA, SO,, and TSP. In general, the main sources of each type are as follows:
Although comparison of the above fig- ures is interesting, no conclusions should
be drawn from them without more de-
tailed analysis. Neither should it be as- sumed that simply because CO is the largest single pollutant by weight it is necessarily the most important-since its relative effect on both health and the en- vironment vis-a-vis other pollutants such as TSP and SO2 must also be considered. Motor vehicles: CO, NO,, and HC
Industrial sources: TSP and SO,
Table 8 shows results of pollution
emission inventories compiled in five
major Latin American cities. Taking the total pollution emitted in metric tons, as listed in the table, and dividing by the estimated population of each city in the
EFFECTS ON HEALTH
Studies carried out in other countries indicate that the most susceptible popu- lation groups are the elderly, children, and those suffering from chronic heart or
Table 8. Estimated totals of the indicated air pollutants emitted (metric tons per year) in five Latin American cities.
Type of SC0 Paul0
pollutanta (1987)
TSP 91,500
so* 131,200 NO, 226,300
HC 271,300 co 1,391,ooo Total 2,111,600
(1986
Mexico City (1987) 46,830 420,241 22,434 243,291 12,822 179,324 29,001 447,390 227,242 3,626,427 338,242 4,916,673
Rio de Janeiro Caracas
(1983) (1980) 121,426 30,123 127,202 11,540 52,000 29,461 173,968 53,429 638,350 542,115 1,213,546 696,666 Sources: References 7, 8, 12, and 15.
“TSP = total suspended particles SO2 = sulfur dioxide NO, = nitrogen oxides HC = hydrocarbons CO = carbon monoxide
lung diseases. In general, pollution levels
above the maximum permissible WHO
standard cause irritation of the eyes, nose, and throat. When levels increase to be- tween two and three times the maximum
WHO standard, respiratory symptoms
become more acute and tolerance of
physical activity diminishes. At levels three to four times the maximum WHO standard, the beginnings of cardiorespi- ratory diseases may be observed.
SURVEY OF AIR POLLUTION
MONITORING
AND CONTROL
Latin America currently lacks adequate information for any systematic and rig- orous evaluation of health consequences suffered by populations exposed daily to air poIlution. However, pollution levels prevailing in many of the region’s cities make it reasonable to conclude that con- siderable numbers of people are experi-
encing pollution-related health prob-
lems, more are suffering some degree of irritation, and still more are experiencing discomfort in their daily lives.
Recently, the Pan American Center for
Human Ecology and Health (ECO) con-
ducted a survey to find what the govern- ments in Latin America and the Carib- bean were doing to measure and combat air pollution (22). Table 10 shows the 14 questions included in the questionnaire
and the number of the 29 responding
countries that provided affirmative an-
swers to each question. As indicated in the table, 11 countries have enacted air pollution control legislation, six have es- tablished air quality standards, and four
have carried out epidemiologic studies
designed to assess the health impact of air pollution.
While greater resources will be needed in order to collect relevant health data and better assess what is happening, it is possible to adopt certain working hy- potheses and to extrapolate from studies performed in the United States and the
United Kingdom on controlled popula-
tion groups. Proceeding in this manner, we have estimated that some 75 million people in Latin America are exposed to
TSP levels above the maximum WHO
standard (18).
Table 11 shows the air quality stan-
dards adopted by three countries (Brazil, Chile, and Mexico) with respect to spe- cific pollutants and compares them to the
aforementioned air quality standards of
WHO. Generally speaking, the standards established by the three countries are very
similar to those of WHO-and also very similar to those established by the United States Environmental Protection Agency.
CONCLUSIONS
AND
RECOMMENDATIONS
This figure, combined with data re-
ceived from air quality monitoring sta- tions in certain cities, suggests that some 2.8 million excess cases of chronic cough
occur annually among Latin American
children O-14 years of age, that roughly
120,000 excess chronic bronchitis cases
annually afflict peopIe over 60 years of age within the region, and that excess
respiratory ailments among adults be-
tween 15 and 59 years oId cause the Ioss of something like 55 million days of pro- ductive activity per year (Table 9).
Air pollution in Latin America is a
mounting problem whose growth has not been matched by the growth of assess- ment and control efforts. Limited basic information is available that does permit crude evaluation of the current situation and trends in quantified terms for the entire Region. However, very few Latin
American countries are participating in
the GEMS global urban air quality mon- itoring program. Few countries have es- tablished air quality standards. Most air quaIity monitoring stations in the region record only TSP, and very few measure
Table 9. Estimated health effects of exposure to different total suspended particle (TSP) levels and size of exposed populations in Latin American cities.”
Average annual TSP level (in kg/m?
250 150 100 Total
Exposed population (in millions):
Children (O-l 4 years) Adults (15-59 years) Old people (~60 years)
Rate in excess of:
Chronic cough in children (% per yea@
RRAD’ in adults (days/person/yea+ Chronic bronchitis in
old people (%)”
Quantity in excess of:
Chronic cough cases in chrldren (million per year)b
RRAD’ in adults (million days per yea@ Chronic bronchitis cases in old
5.7 8.2 15.4 29.3
8.1 11.8 22.1 42.0
0.7 1.0 2.0 3.7
24.5 10.6 4.1
4.0 1.5 0.2
6 4 2
1.4 0.87 0.63 2.9
32.4 17.7 4.4 54.5
people (million per year)’ 0.04 0.04 0.04 0.12
dSource: Reference 5.
“Based on application of a chart prepared by Ware et al. (19). ‘RRAD = Respiratory-related restriction in activity days. dBased on data in Ostro (20).
‘Based on data in Lambert and Reid (2 7).
tance of recording emitters and types of air pollutants for the purpose of main- taining effective control programs, such inventories have been compiled in very few cities, and those compiled have been incomplete.
Furthermore, the information available on the relationship between air pollution and health in the region is very limited, perhaps because of the difficulties in- volved in carrying out epidemiologic studies and the limited resources allo- cated to this task.
By way of recommendations for action, it seems clear that the largest cities in the
Americas-at least those 34 shown in
Table 12 with over a million inhabit- ants-should measure their air quality.
The air quality monitoring stations em- ployed for this purpose should measure not only TSP and SO2 (the most fre- quently analyzed pollutants) but should also measure NOz and, especially, 0,.
Beyond that, at least those 14 cities with over two million inhabitants (see Table 12) should compile complete and period- ically updated inventories of air pollution emitters and significant types of pollu- tants emitted.
Finally, all the countries of the Amer-
icas should be preparing air quality
standards that can serve as a technical and legal frame of reference, so that they will have the ability to take appropriate control measures if and when such meas- ures are required.
Table 10. Results of a country air pollution survey in Latin America and the Caribbean (29 countries resoonded).
Question No.
1 2 3
4
9
10
11
12
13
14
Question
Have laws been enacted to control air pollution? Have air quality standards been established?
Are air quality considerations taken into account in making decisions about economic development programs?
Are air quality impact evaluations being made with regard to development projects?
Is the magnitude of air pollution problems known and documented? Do stations routinely measure air quality in some cities?
Have inventories been made of air pollution sources?
Is information available on the number of motor vehicles and kinds of fuels being used?
Is information available on the characteristics of the vehicle fuels being used? (For example, lead content in gasoline and sulfur in diesel oil.) Is information available from censuses or other sources on the kinds of
fuels used in dwellings for cooking and heating?
Do consultants or consulting firms exist with the equipment needed to analyze smokestack emissrons and/or design equipment for the control of emissions?
Is quantified information available on actions for the control of air pollution? (For example, expenditures made, amount of emission reduced.)
Is the health sector (ministry of health or health services) involved in activities for evaluating and/or controlling air pollution?
Have any epidemiologic studies been made to evaluate the impact of air pollution on health?
No. of affirmative
11 6
7
10 6 10 9
27
21
17
10
4
17
4
Source: Reference 22
Table 11. Air quality standards of Brazil, Chile, Mexico, United States, and WHO.
Measurement United States
Pollutant period Brazil Chile Mexico (EPA) WHO
Total suspended particles (pg/m3)
SO, ~~kW)
NO, hh-n3)
0, k&n?
Hydrocarbons, except methane h.shP)
Carbon monoxide (mg/m?
Annual 80 75 - 75 60-90
24 hours 240 260 275 260 100-150
Annual 80 80 - 80 40-60
24 hours 365 365 375 365 100-150
I hour - - - 1,050 350
Annual 100 100 - 100 -
24 hours - 300 - 150
1 hour 470 395 - 400
8 hours - - - 100-120
1 hour 160, 160 220 235 150-200
3 hours 160 160 160 160
8 hours 10 10 14 IO 10
Table 12. Cities in Latin America with over one million inhabitants (the asterisks denote cities with over two million inhabitants).
Argentina *Buenos Aires
Rosario Cbrdoba
Bolivia La Paz
Brazil *S?ro Paul0 *Rio de Janeiro *Belo Horizonte *Recife *Port0 Alegre *Salvador Brasilia Curitiba Fortaleza Belem Chile *Santiago Colombia *Bogota Medellin Cali Barranquilla Cuba Havana
Dominican Republic Santo Domingo
Ecuador Quito Guayaquil
Guatemala Guatemala City
Mexico *Mexico City *Guadalajara *Monterrey Puebla Tol uca Peru *Lima Uruguay Montevideo Venezuela *Caracas Maracaibo Valencia
REFERENCES
1. 2. 3. 4.World Health Organization. Our planet, our health. Geneva: 1989; 12.
World Resources Institute, International Institute for Environment and Develop- ment, and United Nations Environment Program. World resources, 1988-89. New York: Basic Books; 1988.
United Nations. Sfafisfical yearbook, 1985- 86. New York: 1988.
Comision Economica para America Latina y el Caribe (CEPALC). Anuario esfadisfico de Ame’rica Lafina y el Caribe. Santiago: 1990; 9.
5. Centro Panamericano de Ingenieria San- itaria y Ciencias de1 Ambiente. Red Pan- americana de Muesfreo de la Confaminacidn de1 Aire (REDPANAIRE): informefinal, 2967-
80. Lima: CEPIS; 1982.
6. United Nations Environment Program and World Health Organization. Globul envi-
28 Bulletin of PAHO 26(I), 1992
ronmenf monitoring system: assessment of ur-
ban air qualify, report on the results of the WHOIUNEP program on health-related envi- ronmental monitoring. London: WHOKJNEP
Monitoring and Assessment Research
Center; 1988. 7. 8. 9. 10. 11. 12. 13. 14. 15.
3rasi1, Estado de Sao Paulo, Secretaria do VIeio Ambiente y Companhia de Tecnolo- ga de Saneamiento Ambiental (CETESB). zualidade do ar na regiio mefropolifana de 30 F’aulo e em Cubaflio. Sao Paulo: CETESB; 1989; 8-183. (Serie Relatorios, July 1989). Brasil, Estado de SBo Paulo, Secretaria do Meio Ambiente y Fundacao Estadual de Engenharia do Meio Ambiente (FEEMA). Qualidade do ar na
regifio
mefropolifana do Rio le Janeiro, 1984-1987. Rio de Janeiro: FEEMA; 1989.Chile, Servicio de Salud de1 Ambiente. lnforme de
con
faminacih a fmosf&ica, ario 1988. Santiago, Chile: Servicio de Salud de1 Ambiente, Region Metropolitana; 1988; 9-27.Colombia, Section Protection de1 Medio Ambiente, Division de Saneamiento Am- biental. La confaminacio’n de1 aire en Bogofd, 2983-86. Bogota: Distrito Especial, Ser- vicio de Salud; 1987.
Caceres R, et al. Esfudio integral sobre la confaminacio’n afmosfhica en el valle de Ca-
racus. Caracas: Direction General de In- vestigacion de1 Ambiente y de 10s Recur- SOS Naturales Renovables; 1980; 31-34. Mexico, Comision National de Ecologia. Contamination atmosferica. In: Comision National de Ecologfa. lnforme general de ecologiu. Mexico City: 1988; 72-100. Venezuela, Departamento de Control de Contamination Atmosferica. Reporfe de las
concenfraciones
atmosfe’ricas
de
parficufas en suspensih en siefe ciudades de Venezuela dur- ante el alio 2986. Maracay, Venezuela: Di- reccicm General Sectorial de Malariologia y Saneamiento Ambiental, Direction de Ingenierfa Ambiental; 1987; 15-25. Costa Rica, Ministerio de Salud. Concen- fracio’n de parficulas en suspensih en el drea mefropolifana de San Jo&: period0 1985-1986. San Jose: 1986.Association held at Las Croabas, Puerto Rico, 18-23 September 1977).
16. Servicios de Ingenierfa de Chile, CADE- IDEPE. Universo de las fuentes emisoras de contaminantes atmosfhicos e intentario real de emisiones para Santiago. Santiago: CADE- IDEPE; 1988; 5.
bient sulfur oxides and suspended par- ticles on respiratory health of children. Am Rev Respir Dis. 1986;133:834-42. 20. Ostro BD. Estimating the risk of smoking,
air pollution, and passive smoke in acute respiratory conditions. Risk Anal. 1981; 9:189-96.
17. World Health Organization. Rapid assess- ment of sources of air, water, and land pol- I&ion. Geneva: 1982. (WHO offset pub- lication 62).
21. Lambert PM, Reid DD. Smoking, air pol- lution, and bronchitis in Britain. Lancet. 1970;1:853-57.
18. Romeu I, Weitzenfeld H, Finkelman J. Ur-
ban air pollution in Latin America and the 22. Weitzenfeld H, Romeu I. Resultados de la encuesta sobre la situacih de la contaminacih Caribbean: health perspectives. World
Health Stat Q. 1990;43(3):153-67. de1 aire en America Latina y el Caribe. Me- tepee, Mexico: Centro Panamericano de
19. Ware JH, Ferris BG Jr, Dockery DW, Ecologfa Humana y Salud; 1990. (EC0 in-
Spengler JD, Stram DO. Effects of am- formation document).
Training Courses in Health Program
Management
Management Sciences for Health, a nonprofit institution headquar- tered in Massachusetts, U.S.A., is offering the following management training courses in 1992: Management Skills for Health Professionals-
The Processes, Systems, and Technology for Effective Leadership (13
April-8 May); Financial Management for Health Programs (8 June-3
July); MIS Development and Design for Health and Family Planning
Organizations (9 July-12 August); Managing Successful Training Pro-
grams for Health and Family Planning (20 August-23 September); Ex-
ecutive Program in Health Financing (28 September-16 October, in-
cluding one-week optional study tour); Environmental Health-
Strengthening Policies and Programs (28 September-16 October); and
Urban Health-The Global Challenge (19 October-16 November).
For additional information, please contact: Management Training,
Management Sciences for Health, 165 Allandale Road, Boston, MA
02130-3457, U.S.A.; phone (617) 527-9202; fax (617) 965-2208; telex 4990154 MSHUI; cable MANSHEALTH.