1. Introduction
Chromophoric dissolved organic matter also known as colored dissolved organic matter (CDOM) is the fraction of dissolved organic matter (DOM) responsible for light absorption in the water column, and it takes part on dissolved organic carbon (DOC), nutrients and heavy metals dynamics (Zhang et al., 2011). CDOM optical properties are attributed to the humic fraction of DOC, which can represent up to 75% of DOC in natural waters (Thurman, 1985). Humic substances (HS) absorb ultra-violet and visible light (UV-VIS, between 200 and 700 nm) due to the presence of chromophores, which are mainly aromatic groups (Korshin et al., 1997). These aromatic groups are
also responsible for the emission of fluorescence when put under certain excitation wavelengths (Zhang et al., 2011).
HS represent a mixture of compounds with undefined chemical structure and composition, though with some common properties, like the yellow or brownish color, high molecular weight and low biodegradability. HS can be further divided in three groups: humic acids (HA), fulvic acids (FA) and humine. This division is based on the solubility of these substances in different values of pH and on their molecular weights (Thurman, 1985). A more recent concept, proposed by Piccolo (2001), suggests that HS are, in fact, small heterogenic
Spatial and seasonal distribution of chromophoric dissolved organic
matter in the Upper Paraná River floodplain environments (Brazil)
Distribuição espacial e sazonal da matéria orgânica dissolvida cromófora
em ambientes da planície de inundação do alto rio Paraná (Brasil)
Mariana Carolina Teixeira1, Júlio César Rodrigues de Azevedo2 and Thomaz Aurélio Pagioro1,2
1Programa de Pós-Graduação em Ecologia de Ambientes Aquáticos Continentais,
Universidade Estadual de Maringá – UEM, Av. Colombo, 5790, CEP 87020-900, Maringá, PR, Brazil e-mail: [email protected]; [email protected]
2Departamento de Química e Biologia, Universidade Tecnológica Federal do Paraná – UTFPR, Av. Sete de Setembro, 3165, CEP 80230-901, Curitiba, PR, Brazil
e-mail: [email protected]
Abstract: Aim: Our aim was to identify dissolved organic matter (DOM) main sources in environments of the Upper Paraná River floodplain and their seasonal and spatial variation. Methods: Ultraviolet-visible and fluorescence spectroscopy were utilized. The samples were obtained from November 2007 to September 2008 in six lakes of the floodplain. Results: DOM quality differs among environments and also between rainy and dry season. The environments connected with Paraná River showed a high variation on the allochthonous/autochthonous proportion. Aquatic macrophytes might represent an important contribution to DOM in Garças and Osmar lakes. Conclusions: In general, environments connected to Paraná River have a greater influence of autochthonous DOC, while the others are most influenced by allochthonous inputs.
Keywords: DOM, CDOM, DOC, spectroscopy, floodplain.
Resumo: Objetivo: O objetivo deste estudo foi identificar a origem da matéria orgânica dissolvida (MOD) em ambientes da planície de inundação do alto rio Paraná e sua variação sazonal e espacial. Métodos: Para tal, foram utilizadas técnicas de espectroscopia ultravioleta-visível e de fluorescência. As amostras foram coletadas no período de novembro de 2007 a setembro de 2008 em seis lagoas da planície de inundação. Resultados: A qualidade da MOD difere entre ambientes e também entre as estações seca e chuvosa. Os ambientes conectados ao rio Paraná apresentaram grande variação na proporção autóctone/ alóctone. Macrófitas aquáticas podem representar uma contribuição importante à MOD nas lagoas Garças e Osmar. Conclusões: Em geral, ambientes conectados ao rio Paraná têm maior influência de COD autóctone, enquanto os demais têm maior influência de COD alóctone.
Toming et al., 2009; Yao et al., 2011, Zhang et al., 2011).
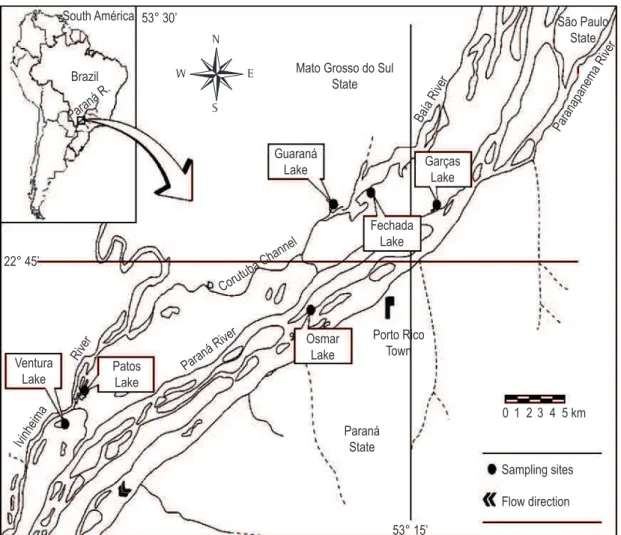
The upper Paraná River floodplain is a very complex environment, composed by many water bodies, among rivers, opened and closed lakes. Considering the importance of CDOM characterization to better understand an ecosystem, we carried out spectroscopic analyses in the UV-VIS region and fluorescence emission in six lakes of the floodplain. We tested weather spectroscopic characteristics of CDOM differed among lakes and seasons. Our driving hypotheses were: a) CDOM quality differs among environments, with more allochthonous CDOM in those lakes related with Baia and Ivinheima rivers in comparison to those related to Paraná river; b) CDOM quality differs between dry and rainy season, with more allochthonous CDOM in the rainy seasons.
2. Material and Methods
The water samples were collected in six shallow lakes (mean depths between 1 and 3.5 m) of the floodplain (Figure 1). Garças, Patos and Ventura lakes are permanently connected to the main rivers of the floodplain, Paraná, Ivinheima and Baia, respectively. Osmar, Fechada and Guaraná remain unconnected most part of the year and only receive water directly from the main rivers during extremely high-water periods, e.g. environments surrounding Paraná River are flooded only after level is above 3.5 m (Borges and Train 2009). For the other environments to be flooded, the level should be higher than 4.6 m (Thomaz et al., 2004). However, the level of the rivers did not surpass these limits within two months prior to the samplings. Samplings were conducted every three months from November 2007 to September 2008 (samplings will be referred to as NOV_07, MAR_08, JUN_08 and SEP_08 throughout the text), including rainy (NOV_07 and MAR_08) and dry periods (JUN_08 and SEP_08). All water samples were collected with a Van Dorn bottle in three points of the pelagic zone of each lake. Samples were taken from subsurface, middle water column and about 0.5 m above bottom, in triplicates. Because no significant differences were detected among different depths and also considering previous works that show these environments are too shallow to have significant differences among depths (eg. Roberto et al., 2009), we considered one point value to be the average of three depths. In summary, we had three points in each of the six lakes sampled four times.
molecules associated by week interactions with HA being composed by hydrophobic compounds and FA by hydrophilic ones.
Only photosynthesis, among all biogeochemical processes that occur on Earth, is quantitatively more important than organic matter humification (Steinberg, 2003). In the soil, there are at least four formation routs of HS, where two of them involve lignin modifications (Thurman, 1985), and generate humic molecules with great amount of aromatic rings and oxygen-containing groups (Aiken and Cotsaris, 1995). Calace et al. (1998) consider the presence of phenolic structures in HS as a terrestrial origin marker. In aquatic environments, HS are formed through other routes, originating simpler molecules with a higher content of aliphatic carbon (Aiken and Cotsaris, 1995).
DOM in freshwater can be originated in or outside water bodies. Autochthonous DOM is formed mainly through senescence and exudates of primary producers (phytoplankton, aquatic macrophytes and periphyton) (Zhang et al., 2011). These DOM sources can have distinct importance in environments. Carbon from aquatic macrophytes and periphyton, for example, can vary in quantity and quality according to the present species (Osborne et al., 2007). The mineralized or humified fractions and the velocity of mineralization and humification can also vary (Bianchini Junior and Cunha-Santino, 2008). Besides different sources, DOM is also influenced by various mechanisms, such as water mixing and photodegradation (Zhang et al., 2011). DOM formed in soil, mainly through decomposition of vascular plants and leached into the water bodies, named allochthonous, is predominantly humic and rich in CDOM (Calace et al., 1998; Toming et al., 2009).
so its origin, we used indexes that were calculated based on spectroscopic data. Specific UV absortivity at 254 nm (SUVA254) is obtained dividing the absorbance at 254 nm by DOC concentration (mg.L–1) and the optical path (m). Because the aromatic groups are the main responsible for the absorption, the index indicates the degree of aromaticity of DOM (Chin et al., 1994; Westerhoff and Anning, 2000). Another index is the ratio between the absorbances at 300 and 400 nm (E3/ E4), which is inversely proportional to humification and degree of aromaticity and to molecular weight (Artinger et al., 2000; Chen et al., 2002).
Fluorescence intensity (FI), measured at 450 nm with excitation at 314 and 370 nm (FIEx:314 nm/Em:450 nm and FIEx:370 nm/Em:450 nm), is proportional to DOC concentration (Oliveira et al., 2006; Azevedo et al., 2008b). The ratio between fluorescence intensity at wave lengths 450 and 500 nm, with excitation at 370 nm (FR) indicates DOM origins (Westerhoff and Anning, 2000; McKnight et al. 2001) and degree of humification (Wu et al., 2007). All samples were filtered in Millipore cellulose
ester 0.45 µm membranes (washed previously with deionized water) to separate the dissolved and particulate carbon, and stored in polyethylene flasks at –4 °C. Samples for chlorophyll-a were filtered in
glass fiber filters and adequately stored until later determination according to Golterman et al. (1978).
DOC concentration was determined in a TOC-V-CPH equipment (Shimadzu). Fluorescence spectroscopy analyses were carried in an F-4500 fluorometer (Hitachi), with 240 nm.min–1, 5 nm slit, 1 cm quartz cuvette and Milli-Q water used as blank. Fluorescence emission spectra from 300 to 600 nm were obtained using the excitation wavelengths of 314 and 370 nm. Synchronous spectra were obtained from 250 to 600 nm with a wavelength interval (∆λ) of 18 nm. The absorbance of UV and visible light by the DOC from 250 to 650 nm was measured using a UVVIS Carry 50 spectrophotometer (Varian).
In an attempt to quantify the relative amount of humic and non-humic structures in DOM, and
3. Results
DOC concentrations varied greatly among lakes, with the lowest values found in lakes Garças and Osmar (Paraná river) and the highest in Ventura and Fechada lakes (Baia river) (Table 2). Even though lakes differed comparing each sampling period alone, they also presented seasonal variation, as shown by the coefficient of variation (standard deviation divided by the mean) of DOC concentrations, which varied from 14% in lake Guaraná up to 72% in lake Ventura. DOC values from lakes Garças, Osmar, Ventura and Patos differed significantly between dry and rainy seasons (Table 3). Chlorophyll-a values varied between 1,71 and 90,10 µg.L–1 (Table 2). All lakes showed the highest chlorophyll-a values in NOV_07, up to 10 times the concentration found in other months (See Table 2).
SUVA254 values varied between 1,14 ± 0,22 (NOV_07, LGAR) and 4,15 ± 0,53 (NOV_07, LGAR). In general, all lakes showed lower values in NOV_07 and MAR_08 (rainy season) than in JUN_08 and SEP_08 (dry season) (Table 2), indicating that in the rainy season there was a lower content of complex compounds (e.g. polyaromatic structures, lignin derivatives) than in dry season. This difference between rainy and dry seasons was significant for lakes Ventura, Patos and Garças (Table 3). Lakes differed significantly in all samplings for this variable, with Guaraná lake showing the highest values in three out of four months. Garças lake had the lowest values Synchronous spectra are made through varying
excitation wave lengths and scanning emission synchronically with a constant wave length interval between excitation and emission (∆λ). The most common interval for DOC and humic substances studies is ∆λ = 18 nm (Peuravuori et al., 2002). Synchronous spectra show peaks in different regions, which indicate the presence of certain groups of chemical compounds. Peuravuori et al. (2002) identify some excitation/emission regions (Ex/Em): 1) 280/298 nm, aromatic amino acids and volatile acids with highly conjugated aliphatic structures; 2) 330/348 nm, naphthalene and derivatives; 3 and 4) 355/373 nm and 400/418 nm, polycyclic aromatics with 3 to 5 fused benzene rings; 5) 460/478 nm, polycyclic aromatics with 7 fused benzene rings and lignin derivatives. Within each band, the fluorescence intensity is inversely proportional to molecular weight. All indexes are summarized in Table 1.
Statistically, to explore the differences among lakes, within each sampling period, we used a one-way non-parametric analysis of variance Kruskal-Wallis (KW), since our data did not reach the assumptions for a parametric test. To test the difference between dry and rainy seasons, we used the Mann-Whitney-U test for each lake. Dry and rainy seasons were determined with precipitation data of three weather stations (Teixeira et al., 2011). All analyses were carried with the software Statistica version 7.1 (Statsoft, 2005) and the significance level was determined as p < 0,05.
Table 1. Calculation and interpretation of spectroscopic indexes.
Feature Calculation Interpretation
SUVA254
(specific UV
absorptivity)
.
Abs SUVA
DOC OP
= × Abs. = Absorbance in 254 nm
DOC = Dissolved Organic Carbon concentration (mg.L–1)
OP = optical path length (m)
SUVA value represents the amount of aromatic structures (Chin et al., 1994; Westerhoff and Anning, 2000).
E3/E4 3 .(300 )
4 .(400 )
E Abs nm
E =Abs nm
Abs. = Absorbance
E3/E4 represents degree of humification. E3/E4 < 3.5 indicates high humification (Artinger et al.,
2000; Chen et al., 2002).
FR ( : 450 / :370 )
( : 500 / : 370 ) =FI Em nm Ex nm
FR
FI Em nm Ex nm
FI = fluorescence intensity
Values of FR > 1.8 indicate autochthonous sources of DOC, and FR < 1.5 indicates allochthonous sources (Westerhoff and Anning, 2000; McKnight et al., 2001; Wu et al., 2007). Regions in
synchronous spectra
280/298 nm: aromatic aminoacids and other volatile acids with highly conjugated aliphatic structures;
330/348 nm: naphthalene and derivatives;
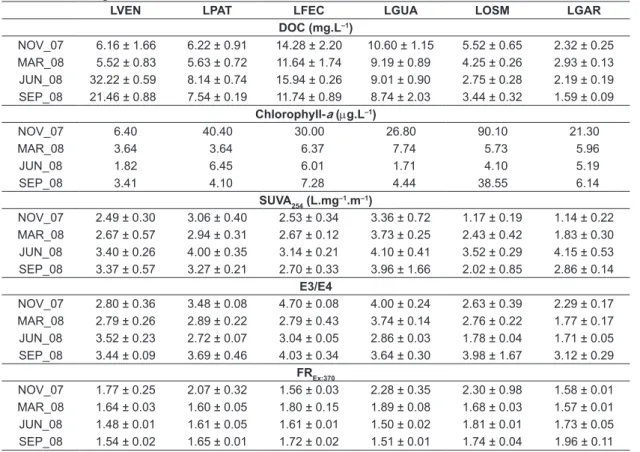
Table 2. Mean and standard deviations (n = 3) of dissolved organic carbon (DOC), chlorophyll-a and spectroscopic characteristics of chromophoric dissolved organic matter in lakes Ventura (LVEN), Patos (LPAT), Fechada (LFEC), Guaraná (LGUA), Osmar (LOSM) and Garças (LGAR) in November 2007 (NOV_07), March, June and September 2008 (MAR_08, JUN_08 and SEP_08). SUVA254: specific UV absortivity of CDOM at 254 nm; E3/E4: ratio between absorbances of CDOM at 300 and 400 nm; FR: ratio of fluorescence emission at 450 and 500 nm with an excitation wavelength of 370 nm.
LVEN LPAT LFEC LGUA LOSM LGAR
DOC (mg.L–1)
NOV_07 6.16 ± 1.66 6.22 ± 0.91 14.28 ± 2.20 10.60 ± 1.15 5.52 ± 0.65 2.32 ± 0.25
MAR_08 5.52 ± 0.83 5.63 ± 0.72 11.64 ± 1.74 9.19 ± 0.89 4.25 ± 0.26 2.93 ± 0.13
JUN_08 32.22 ± 0.59 8.14 ± 0.74 15.94 ± 0.26 9.01 ± 0.90 2.75 ± 0.28 2.19 ± 0.19
SEP_08 21.46 ± 0.88 7.54 ± 0.19 11.74 ± 0.89 8.74 ± 2.03 3.44 ± 0.32 1.59 ± 0.09
Chlorophyll-a (µg.L–1)
NOV_07 6.40 40.40 30.00 26.80 90.10 21.30
MAR_08 3.64 3.64 6.37 7.74 5.73 5.96
JUN_08 1.82 6.45 6.01 1.71 4.10 5.19
SEP_08 3.41 4.10 7.28 4.44 38.55 6.14
SUVA254 (L.mg–1.m–1)
NOV_07 2.49 ± 0.30 3.06 ± 0.40 2.53 ± 0.34 3.36 ± 0.72 1.17 ± 0.19 1.14 ± 0.22
MAR_08 2.67 ± 0.57 2.94 ± 0.31 2.67 ± 0.12 3.73 ± 0.25 2.43 ± 0.42 1.83 ± 0.30
JUN_08 3.40 ± 0.26 4.00 ± 0.35 3.14 ± 0.21 4.10 ± 0.41 3.52 ± 0.29 4.15 ± 0.53
SEP_08 3.37 ± 0.57 3.27 ± 0.21 2.70 ± 0.33 3.96 ± 1.66 2.02 ± 0.85 2.86 ± 0.14
E3/E4
NOV_07 2.80 ± 0.36 3.48 ± 0.08 4.70 ± 0.08 4.00 ± 0.24 2.63 ± 0.39 2.29 ± 0.17
MAR_08 2.79 ± 0.26 2.89 ± 0.22 2.79 ± 0.43 3.74 ± 0.14 2.76 ± 0.22 1.77 ± 0.17
JUN_08 3.52 ± 0.23 2.72 ± 0.07 3.04 ± 0.05 2.86 ± 0.03 1.78 ± 0.04 1.71 ± 0.05
SEP_08 3.44 ± 0.09 3.69 ± 0.46 4.03 ± 0.34 3.64 ± 0.30 3.98 ± 1.67 3.12 ± 0.29
FREx:370
NOV_07 1.77 ± 0.25 2.07 ± 0.32 1.56 ± 0.03 2.28 ± 0.35 2.30 ± 0.98 1.58 ± 0.01
MAR_08 1.64 ± 0.03 1.60 ± 0.05 1.80 ± 0.15 1.89 ± 0.08 1.68 ± 0.03 1.57 ± 0.01
JUN_08 1.48 ± 0.01 1.61 ± 0.05 1.61 ± 0.01 1.50 ± 0.02 1.81 ± 0.01 1.73 ± 0.05
SEP_08 1.54 ± 0.02 1.65 ± 0.01 1.72 ± 0.02 1.51 ± 0.01 1.74 ± 0.04 1.96 ± 0.11
of SUVA254 in NOV_07 and MAR_08, and the highest in JUN_08, showing great seasonal variability. On the other hand, although Patos lake showed significant seasonal variability, in comparison with the other lakes it always showed relatively high values of SUVA254.
E3/E4 values varied significantly between rainy and dry seasons only in lakes Guaraná and Garças. In Guaraná lake, E3/E4 values were higher in the rainy season, indicating that CDOM is less humified in this than in the dry season. In Garças lake, it was the opposite, with higher values of E3/ E4 in the dry season. However, in both cases the difference was mainly driven by only one month (see Table 2). Comparing each season separately, significant differences among lakes were found only for the samplings during the rainy season, NOV_07 and MAR_08, when Garças and Osmar showed the lowest values, indicating that their CDOM is more humified in comparison with the other lakes.
Westerhoff and Anning (2000) consider FR > 1.8 as indicative of autochthonous sources of
DOC, while values under 1.5 indicate allochthonous sources. In this study, most of FR values were between 1.5 and 1.8, indicating mixed sources of DOC. Patos, Guaraná, Osmar and Garças showed values higher than 1.8 in some samplings (see Table 2), but only Ventura, Guaraná and Garças lakes showed significant seasonal variation in this index, with higher values, in which indicate autochthonous CDOM, in the rainy season for Ventura and Guaraná and in the dry season for Garças (Table 4).
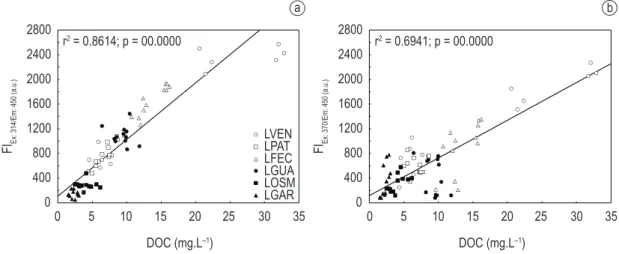
Fluorescence intensity in 450 nm, with excitation wavelengths at 314 and 370 nm should be a good predictor of DOC concentration in aquatic environments (Oliveira et al., 2006; Azevedo et al., 2008b). In this study, a strong positive correlation (r > 0,8; see Figures 2a, b) between DOC and fluorescence intensity at both wavelengths was obtained, showing that fluorescence represents well DOC variability in these environments.
in the spectra of most of the samples were between 320 and 400 nm, which indicate compounds with two to four fused aromatic rings (Peuravuori et al., 2002) and/or fulvic acids (Ferrari and Mingazzini, 1995), mainly from allochthonous sources. These peaks showed different patterns among lakes and only Garças and Guaraná showed some distinction between rainy and dry season. The variation was opposite though, Garças had higher FI in the rainy season, indicating lower molecular weight 300 nm, that indicates the presence of monoaromatic
compounds (Ferrari and Mingazzini, 1995) and/ or acids with conjugated aliphatic structures and aromatic aminoacids (Peuravuori et al., 2002), mainly from autochthonous sources, such as phytoplankton and aquatic macrophytes. These peaks were higher during the dry period (JUN_08 and SEP_08), except for Ventura lake, which presented the highest peak in MAR_08 (rainy period). The next and largest peaks that appeared
Table 3. Mann-Whitney-U test (nDS = 6, nRS = 6)comparing rainy (RS, median values) and dry seasons (DS, median values) for each lake: Ventura (LVEN), Patos (LPAT), Fechada (LFEC), Guaraná (LGUA), Osmar (LOSM) and Garças (LGAR). SUVA254: specific UV absortivity of CDOM at 254 nm; E3/E4: ratio between absorbances of CDOM at 300 and 400 nm; FR: ratio of fluorescence emission at 450 and 500 nm with an excitation wavelength of 370 nm. U: Mann-Whitney statistic; values of p < 0.05 are in bold.
DOC (mg.L–1) SUVA 254 (L.mg
–1.m–1) E3/E4 FR Ex:370
LVEN
RS 5.99 2.55 2.77 1.65
DS 27.04 3.42 3.47 1.50
U 0.00 3.00 10.00 0.00
p 0.00 0.02 0.20 0.00
LPAT
RS 5.72 3.00 3.25 1.75
DS 7.62 3.54 3.02 1.65
U 0.00 5.00 9.00 14.00
p 0.00 0.04 0.15 0.52
LFEC
RS 12.64 2.60 3.86 1.62
DS 14.11 2.99 3.39 1.66
U 12.00 9.00 7.00 15.00
p 0.34 0.15 0.08 0.63
LGUA
RS 9.70 3.67 3.83 1.93
DS 9.22 3.98 3.10 1.51
U 14.00 13.00 0.00 0.00
p 0.52 0.42 0.00 0.00
LOSM
RS 4.69 1.71 2.81 1.69
DS 3.08 3.09 1.98 1.79
U 0.00 6.00 9.00 13.00
p 0.00 0.05 0.15 0.42
LGAR
RS 2.65 1.43 2.08 1.58
DS 1.83 3.34 2.28 1.83
U 2.00 0.00 0.00 0.00
p 0.01 0.00 0.00 0.00
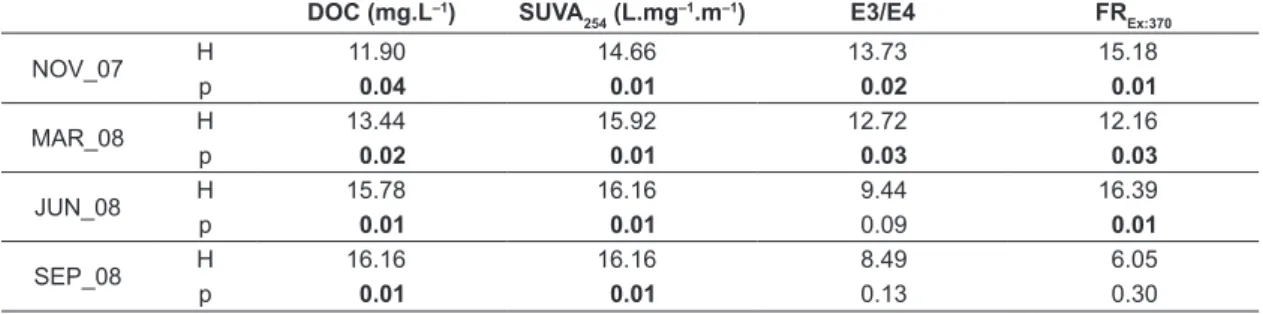
Table 4. Kruskal-Wallis (df = 5; n = 18) test comparing lakes within each sampling: November 2007 (NOV_07), March, June and September 2008 (MAR_08, JUN_08 and SEP_08). SUVA254: specific UV absortivity of CDOM at 254 nm; E3/E4: ratio between absorbances of CDOM at 300 and 400 nm; FR: ratio of fluorescence emission at 450 and 500 nm with an excitation wavelength of 370 nm; H: Kruskal-Wallis statistic; values of p < 0.05 are in bold.
DOC (mg.L–1) SUVA 254 (L.mg
–1.m–1) E3/E4 FR Ex:370
NOV_07 H 11.90 14.66 13.73 15.18
p 0.04 0.01 0.02 0.01
MAR_08 H 13.44 15.92 12.72 12.16
p 0.02 0.01 0.03 0.03
JUN_08 H 15.78 16.16 9.44 16.39
p 0.01 0.01 0.09 0.01
SEP_08 H 16.16 16.16 8.49 6.05
can be important in explaining DOM differences (Azevedo and Nozaki, 2008).
Artinger et al. (2000) consider that E3/E4 values under 3.5 are related to HA, indicating HS with high degree of humification. The lowest values of E3/E4 were found in NOV_07, a rainy period, with low hydrometric levels and high values of chlorophyll-a (Table 3). Although the allochthonous carbon should be the main source of these highly humified compounds, the highest phytoplankton biomass usually found at low water levels (Rodrigues et al., 2009) could also contribute to the low values of E3/E4 observed in this period.
In relation to synchronous spectra, the peaks in the region that indicates the presence of monoaromatic compounds and/or acids with conjugated aliphatic structures and aromatic aminoacids were more intense in JUN_08 and SEP_08 (dry season), when lower chlorophyll-a values were found (mean for rainy season: 6.01 ± 5.18 µg.L–1). This indicates more autochthonous DOM found in the dry season compared to the rainy season. Azevedo et al. (2008a), evaluating the contribution of aquatic macrophytes in DOM in environments of the upper Paraná River floodplain, attributed fluorescence emission in this region to compounds originated from aquatic macrophytes decomposition, therefore, it is possible that an important part of DOC is originated from exudates and/or decomposition of aquatic macrophytes. Still in agreement with previous works (Azevedo et al., 2008a, b), the spectra showed that the influence of macrophytes as sources of CDOM is higher in the environments connected to the Paraná River, such as Garças and Osmar lakes. compounds, pointing to autochthonous sources
while Guaraná had higher FI in the dry season.
4. Discussion
Many studies carried in Paraná River floodplain environments (Carvalho et al., 2003; Rocha and Thomaz 2004; Teixeira et al., 2008) have shown higher DOC values in habitats surrounding Baia and Ivinheima Rivers, in relation to those closer to Paraná River. In this study, we found lower values of DOC in lakes Garças and Osmar, which are connected to Paraná River, and higher values in the other lakes, leading to the same pattern observed in preview studies, despite seasonal variation within lakes. Roberto et al. (2009) clearly showed the effect of sediment retention by upstream dams in Paraná River, what could be the cause of lower values of DOC in Paraná River and surrounding lakes.
Lower values of SUVA254 observed in the rainy season were not expected, since greater entry of allochthonous material in lakes occurs in the rainy season, what would raise SUVA254 values in relation to the dry season. One possible explanation could be related to primary production in the lakes. Chlorophyll-a values were significantly higher in the rainy season (Teixeira et al., 2011; data shown in Table 3), providing more labile COD to DOM pool, and resulting in lower SUVA254 values. In the rainy season, the differences among lakes followed DOC variation pattern, indicating a similar proportion of CDOM in DOM of all lakes. The great SUVA254 variation in the dry season did not show any pattern. The distinction among the geologic regions where the main rivers come from
FIEx: 370/Em: 450 (a.u.) 2800
2400
2000
1600
1200
800
400
0
35 30 25 20 15 10 5 0
DOC (mg.L–1) r2 = 0.6941; p = 00.0000
FIEx: 314/Em: 450 (a.u.) 2800
2400
2000
1600
1200
800
400
0
35 30 25 20 15 10 5 0
DOC (mg.L–1) r2 = 0.8614; p = 00.0000
LVEN LPAT LFEC LGUA LOSM LGAR
a b
and sediments to DOM in that lake, which can explain the greater stability of DOC composition, considering that local forces would have higher importance on it. Lakes Osmar and Garças showed, in terms of DOC fluorescence intensity between 320 and 400 nm, a great resemblance with Patos lake. However, the peak at 400 nm in SEP_08 at Osmar lake, distinguishes this spectrum from any other found in this study, and it can be attributed to the presence of polyaromatic The second and highest peak, between 320 and
400 nm, which indicates compounds with two to four fused aromatic rings (Peuravuori et al., 2002) and/or fulvic acids (Ferrari and Mingazzini, 1995) was observed on DOC spectra of all samples, although with a big variation in intensity among environments and periods. Patos lake showed the minor seasonal variability, indicating some stability in DOC composition. Azevedo and Nozaki (2008) pointed a great influence of the surrounding soil
wind action, sediment ressuspension and watershed features.
Aknowledgements
We acknowledge the Brazilian Coordination for the Improvement of Higher Education Personnel (CAPES), the Long Term Ecological Research/ National Council for Scientific and Technological Development (PELD/CNPq) program and the Nucleus of Research in Limnology, Ichthyology and Aquiculture (Nupelia, Maringá State University) for all financial, structural and logistic support. The authors also thank the anonymous referee for his/ her suggestions and Maria do Carmo Roberto and her staff for the chlorophyll analysis.
References
AIKEN, G. and COTSARIS, E. 1995. Soil and hydrology: their effect on NOM. Journal of American Water Works Association, vol. 87, no. 1, p. 36-45. ARTINGER, R., BUCKAUA, G., GEYERB, S., FRITZ,
P., WOLFC, M. and KIM, JI. 2000. Characterization of groundwater humic substances: influence of sedimentary organic carbon. Applied Geochemistry, vol. 15, p. 97-116. http://dx.doi.org/10.1016/S0883-2927(99)00021-9
AZEVEDO, JCR. and NOZAKI, J. 2008. Análise de fluorescência de substâncias húmicas extraídas da água, solo e sedimento da lagoa dos Patos – MS.
Química Nova, vol. 31, no. 6, p. 1324-1329. AZEVEDO, JCR., MIZUKAWA, A., TEIXEIRA,
MC. and PAGIORO, TA. 2008a. Contribuição da decomposição de macrófitas aquáticas (Eichhornia azurea) na matéria orgânica dissolvida. Oecologia Brasiliensis, vol. 12, no. 1, p. 42-56.
AZEVEDO, JCR., TEIXEIRA, MC., SANTOS, AM., LEANDRINI, JA. and PAGIORO, TA. 2008b. Caracterização espectroscópica da matéria orgânica dissolvida da planície de inundação do alto rio Paraná.
Oecologia Brasiliensis, vol. 12, no. 1, p. 66-77. BIANCHINI JUNIOR, I. and CUNHA-SANTINO,
MB. As rotas de liberação do carbono dos detritos de macrófitas aquáticas. Oecologia Brasiliensis, 2008, vol. 12, no. 1, p. 20-29.
BORGES, PAF. and TRAIN, S. 2009. Phytoplankton diversity in the Upper Paraná River floodplain during two years of drought (2000 and 2001). Brazilian Journal of Biology, vol. 69, no. 2, p. 637-647. http:// dx.doi.org/10.1590/S1519-69842009000300018 CALACE, N., CAPOLEI, M., LUCCHESE, M. and
PETRONIO, BM.1998. The structural compostion of humic compounds as indicator of organic carbon sources. Talanta, vol. 49, p. 277-284. http://dx.doi. org/10.1016/S0039-9140(98)00370-1
compounds (Peuravuori et al., 2002). Garças lake DOC spectra showed a peak of higher intensity in NOV_07, which represents low molecular weight compounds, probably from recent origin and with a low humification degree. This high intensity peak could be related to the high chlorophyll-a values found in this sampling (21.3 µg.L–1). Fechada lake frequently suffers the action of winds, causing the suspension of sediments. This could have caused the raise of DOC humification degree observed in MAR_08, with subsequent decrease in fluorescence intensity. Inputs from outer sources of DOC should also be considered, since this month showed intense rainfall. DOC spectra of Guaraná lake for the first two samplings (NOV_07 and MAR_08, rainy period) were similar, with low FI values, which could be related to the presence of high molecular weight compounds, such as HS, due to high allochthonous inputs. Ventura lake samples showed the highest values of DOC and the lowest values of chlorophyll-a (1.82 µg.L–1) in JUN_08 (dry period), indicating that the low FI in the spectra is due to high molecular weight compounds, e.g. highly humified substances, even though allochthonous inputs were diminished.
In general, FR, SUVA254 and E3/E4 values indicated that the low FI observed in some habitats in NOV_07 and MAR_08 could be attributed to high molecular weight chromophores, indicating predominance of allochthonous DOC, related to the high amount of rain for this period.
5. Conclusions
of humic substances in a tropical lake during a complete hydrological cycle. Acta Hydrochimica et Hydrobiologica, vol. 34, no. 6, p. 608-617. http:// dx.doi.org/10.1002/aheh.200400659
OSBORNE, TZ., INGLETT, PW. and REDDY, KI. 2007. The use of senescent plant biomass to investigate relationships between potential particulate and dissolved organic matter in a wetland ecosystem.
Aquatic Botany, vol. 86, no. 1, p. 53-61. http://dx.doi. org/10.1016/j.aquabot.2006.09.002
PEURAVUORI, J., KOIVIKKO, R. and PIHLAJA, K. 2002. Characterization, differentiation and classification of aquatic humic matter separated with different sorbents: synchronous scanning fluorescence spectroscopy. Water Research, vol. 36, no. 18, p. 4552- 4562. http://dx.doi.org/10.1016/ S0043-1354(02)00172-0
PICCOLO, A. 2001. The supramolecular structure of humic substances: a novel understanding of humus chemistry and implications in soil science. Soil Sciences, vol. 166, no. 11, p. 810-832. http://dx.doi. org/10.1097/00010694-200111000-00007 ROBERTO, MC., SANTANA, NF. and THOMAZ,
SM. 2009. Limnology in the Upper Paraná River floodplain: large-scale spatial and temporal patterns, and the influence of reservoirs. Brazilian Journal of Biology, vol. 69, no. 2, p. 717-725. http://dx.doi. org/10.1590/S1519-69842009000300025
ROCHA, RRA. and THOMAZ, SM. 2004. Variação Temporal de fatores limnológicos em ambientes da planície de inundação do alto rio Paraná (PR/ MS – Brasil). Acta Scientiarum Biological Sciences, vol. 26, no. 3, p. 261-271.
RODRIGUES, LC., TRAIN, S., BOVO-SCOMPARIN, V M . , J AT I , S . , B O R S A L L I , C C J . a n d MARENGONI, E. 2009. Interannual variability of phytoplankton in the main rivers of the Upper Paraná River floodplain,Brazil: influence of upstream reservoirs. Brazilian Journal of Biology, vol. 69, no. 2, p. 501-516. http://dx.doi.org/10.1590/S1519-69842009000300006
Statsoft. 2005. Statistica (data analysis software system). version 7.1. Available from: <www.statsoft.com>. STEINBERG, CEW. 2003. Ecology of humic substances
in freshwaters: determinants from geochemistry to ecological niches. New York: Springer Verlag. 440 p. TOMING, K., ARST, H., PAAVEL, B., LAAS, A. and
NÕGES, T. 2009. Spatial and temporal variations in coloured dissolved organic matter in large and shallow Estonian waterbodies. Boreal Environmental Research, vol. 14, p. 959-970.
TEIXEIRA, MC., AZEVEDO, JCR. and PAGIORO, TA. 2008. Padrões de variação do carbono orgânico na planície de inundação do alto rio Paraná. Oecologia Brasiliensis, vol. 12, no. 1, p. 57-65.
CARVALHO, P., THOMAZ, SM. and BINI, LM. 2003. Effects of water level, abiotic and biotic factors on bacterioplankton abundance in lagoons of a tropical floodplain (Paraná River, Brazil). Hydrobiologia, vol. 510, p. 67-74. http://dx.doi.org/10.1023/ B:HYDR.0000008532.71152.38
CHEN, J., LEBOEUF, EJ., DAI S. and GU, B. 2002. Spectroscopic characterization of the structural and functional properties of natural organic matter fractions. Chemosphere, vol. 48, p. 59-68. http:// dx.doi.org/10.1016/S0045-6535(02)00041-3 CHIN, YP., AIKEN, G. and O´LOUGHLIN, E. 1994.
Molecular weight, polydispersity, and spectroscopic properties of aquatic humic substances. Environmental Science and Technology, vol. 28, p. 1853-1858. http:// dx.doi.org/10.1021/es00060a015
FERRARI, G. and MINGAZZINI, M. 1995. Synchronous fluorescence spectra of dissolved organic matter of algal origin in marine coastal waters. Marine Ecology - Progress Series, vol. 125, p. 305-315. http:// dx.doi.org/10.3354/meps125305
FONG, SS. and MUERTEDZA, M. 2007. Chemical characterization of humic substances occurring in the peats or Sarawak, Malasya. Organic Geochemistry, vol. 38, no. 6, p. 967-976. http:// dx.doi.org/10.1016/j.orggeochem.2006.12.010 FUENTES, M., GONZÁLEZ-GAITANO, G. and
GARCIA-MINA, JM. 2006. The usefulness of uv-visible and fluorescence sepectroscopies to study the chemical nature of humic substances from soils and composts. Organic Geochemistry, v. 37, no. 12, p. 1949-1959. http://dx.doi.org/10.1016/j. orggeochem.2006.07.024
GOLTERMAN, HL., CLYMO, RS. and OHMSTAD, MAM. 1978. Methods for physical and chemical analysis of freshwater. Oxford: Blackwell Scientific. 214 p.
KORSHIN, GV., LI, C. and BENJAMIN, MM. 1997. Monitoring the properties of natural organic matter through UV spectroscopy: a consistent theory. Water Research, vol. 31, no. 7, p. 1787-1795. http://dx.doi. org/10.1016/S0043-1354(97)00006-7
MCDONALD, S., BISHOP, AG., PRENZLER, PD. and ROBARDS, K. 2004. Analytical chemistry of freshwater humic substances. Analytica Chimica Acta, vol. 527, no. 2, p. 105-124. http://dx.doi. org/10.1016/j.aca.2004.10.011
MCKNIGHT, DM., BOYER, EW., WESTERHOFF, PK., DORAN, PT., KULBE, T. and ANDERSEN, DT. 2001. Spectrofluorometric characterization of dissolved organic matter for indication of precursor organic material and aromaticity. Limnology and Oceanography, vol. 46, no. 1, p. 38-48. http://dx.doi. org/10.4319/lo.2001.46.1.0038
Journal of Hydrology, vol. 236, no. 3, p. 202-222. http://dx.doi.org/10.1016/S0022-1694(00)00292-4 WU, FC., TANOUE, E. and LIU, CQ. 2007.
Relationships between doc concentrations, molecular size and fluorescence properties of DOM in a stream. Applied Geochemistry, vol. 22, no. 8, p. 1659-1667. http://dx.doi.org/10.1016/j. apgeochem.2007.03.024
YAO, X., ZHANG, YL., ZHU, GW., QIN, BQ., FENG, LQ., CAI, LL. and GAO, G., 2011. Resolving the variability of CDOM fluorescence to differentiate the sources and fate of DOM in Lake Taihu and its tributaries. Chemosphere, vol. 82, p. 145-155. PMid:21071060. http://dx.doi.org/10.1016/j. chemosphere.2010.10.049
ZHANG, Y., YIN, Y., FENG, L., ZHU, G., SHI, Z., LIU, X. and ZHANG, Y. 2011. Characterizing chromophoric dissolved organic matter in Lake Tianmuhu and its catchment basin using excitation-emission matrix fluorescence and parallel factor analysis. Water Research, vol. 45, p. 5110-5122. PMid:21840562. http://dx.doi.org/10.1016/j. watres.2011.07.014
Received: 14 February 2011 Accepted: 28 March 2012 TEIXEIRA, MC., AZEVEDO, JCR. and PAGIORO,
T.A. 2011. Bacterioplankton features and its relations with doc characteristics and other limnological variables in Paraná river floodplain environments (PR/MS-Brazil). Brazilian Journal of Microbiology, vol. 42, p. 897-908. http://dx.doi.org/10.1590/ S1517-83822011000300008
THOMAZ, SM., PAGIORO, TA., BINI, LM., ROBERTO, MC. and ROCHA, RRA. 2004. Limnology of the upper Paraná floodplain habitats: patterns of spatio-temporal variations and influence of the water levels. In: AGOSTINHO, AA., RODRIGUES, L., GOMES, LC., THOMAZ, SM. and MIRANDA, LE., eds. Structure and functioning
of the Paraná River and its floodplain. Eduem.
p. 37-42.
THURMAN, EM. 1985. Organic geochemistry of natural waters. Netherlands: Martinus Nijhoff, Dr. Junk. 516 p. http://dx.doi.org/10.1007/978-94-009-5095-5 WESTERHOFF, P. and ANNING, D. 2000.