1
Ecomorphology and use of food resources: inter- and intraspecific
relationships of fish fauna associated with macrophyte stands
Aline V. R. Prado
1, Erivelto Goulart
1,2and João P. A. Pagotto
3Based on the form-function interaction and its consequence to niche exploitation by fish species, the study aimed to identify
ecomorphological patterns and to investigate the possibility of explaining the trophic niche breadth using the pattern of
intraspecific ecomorphological diversity. We tested the following hypotheses: i) the morphology explains variations in diet among fish species; ii) the intraspecific ecomorphological diversity is related to the breadth of the trophic niche explored by the species, so that species that feed on a wider range of resources have greater variation in body shape compared to those specialized in resource consumption. Fish were collected in stands of the aquatic macrophytes Eichhornia azurea
and Eichhornia crassipes in lentic environments of the Upper Paraná River floodplain, Brazil. Two major trends were observed in the morphological space: fish with body shapes adapted to explore the substrate and others with a design that facilitates the capture of food items in more structured habitats. The relationship of diet with body shape was confirmed by significant relationships between matrices of trophic and morphological distances, providing evidence that morphology is related to interspecific variations in the use of trophic resources. However, the ranges of morphological and intraspecific trophic variations were not significantly related, rejecting the second hypothesis about the relationship between intraspecific ecomorphological diversity and trophic niche breadth. The morphological characteristics often have multiple ecological roles, which could result in trade-off among these functions. Thus, fish with highly specialized morphology may show specialist feeding or even generalist habit, because in this case some resources may be difficult to exploit, even by a specialist. Species with low and high morphological diversity demonstrated narrow trophic niche and the availability of resources may have been essential for consumption. Therefore, species morphology is related to the use of food resources
and ecomorphology can be considered an important tool for the prediction of the exploited niche space by species in
assemblages. However it is not possible to predict if species with greater intraspecific morphological diversification indeed have wider niche, since the abundance or scarcity of the available food resources may interfere with trophic niche breadth. Baseado na interação entre forma e função e suas consequências para exploração do nicho pelas espécies, o objetivo deste estudo foi identificar padrões de variação ecomorfológica e investigar se a amplitude de nicho trófico pode ser explicada pelo padrão de diversificação ecomorfológica intraespecífica. Assim, testaram-se as hipóteses: i) a morfologia explica as variações na dieta entre as espécies de peixes ii) a diversificação morfológica intraespecífica está relacionada com a amplitude do nicho trófico explorado pelas espécies, de modo que, espécies que se alimentam de maior variedade de recursos
apresentam maior variação na forma do corpo em relação aquelas especializadas no consumo de recursos. Os peixes foram
coletados em bancos de macrófitas aquáticas de Eichhornia azurea e Eichhornia crassipes em ambientes lênticos da planície
alagável do alto rio Paraná, Brasil. Duas tendências principais foram observadas no espaço morfológico: peixes com formato
corporal adaptado a explorar o substrato e outros com forma do corpo facilitando a captação de alimentos em hábitats
mais estruturados. A relação da dieta com a forma do corpo foi confirmada por relações significativas entre as matrizes de distâncias trófica e morfológica, evidenciando que a morfologia pode estar relacionada às variações interespecíficas no uso de recursos alimentares. No entanto, as amplitudes de variações morfológicas e tróficas intraespecíficas não estiveram significativamente relacionadas, rejeitando-se a segunda hipótese sobre a relação entre diversidade ecomorfológica intraespecífica e amplitude do nicho trófico. Características morfológicas podem expressar diferentes papéis ecológicos, o que poderia resultar em troca entre estas funções. Assim, um peixe com morfologia altamente especializada pode ter alimentação especialista ou até mesmo hábito generalista, porque, neste caso, alguns recursos podem ser difíceis de explorar, mesmo por um especialista. Espécies com pequena e grande diversidade morfológica apresentaram nicho trófico estreito e
1Universidade Estadual de Maringá (UEM), Programa de Pós-Graduação em Ecologia de Ambientes Aquáticos Continentais (PEA). Av. Colombo, nº 5790, Bloco G-90, 87020-900 Maringá, PR, Brazil. (AVRP) [email protected] (corresponding author), (EG) [email protected] 2Universidade Estadual de Maringá (UEM), Núcleo de Pesquisas em Limnologia, Ictiologia e Aquicultura (NUPÉLIA). Av. Colombo, nº 5790, Blocos G-90 e H-90, 87020-900 Maringá, PR, Brazil
a disponibilidade dos recursos pode ter sido decisiva para o consumo. Portanto, a morfologia das espécies está relacionada com o uso de recursos alimentares, de modo que a ecomorfologia pode ser considerada uma ferramenta importante na
predição da ocupação do espaço de nicho pelas espécies em assembleias. No entanto, não é possível prever se espécies que apresentam maior diversidade de formas entre seus indivíduos (i.e., maior diversificação morfológica intraespecífica), de
fato apresentam nichos mais amplos, uma vez que a abundância ou escassez do recurso alimentar disponível no ambiente pode interferir na amplitude do nicho trófico ocupado.
Keywords: Diet breadth, Ecomorphological distance, Ichthyofauna, Inter- and intraspecific variation, Upper Paraná River floodplain.
Introduction
Ecomorphology is defined as the study of the relationship between body shape and use of resources among individuals, populations, guilds and communities (Peres-Neto, 1999). The
main goal of ecomorphology is to understand the response of organisms to environmental challenges, by comparing patterns of variations in morphological and ecological characters (Motta et al., 1995). Ecomorphological analysis can be used to describe patterns along niche dimensions, since the body shape provides relevant information about the use of resources by organisms (Bourke et al., 1997; Fugi et al., 2001; Pagotto et al., 2009, 2011; Oliveira et al.,
2010; Sampaio et al., 2013). For example: the depressed and elongated body of armored catfishes (Siluriformes: Loricariidae) permits a more efficient occupation of the
bottom in lotic habitats, since this adaptation compensates
the difficulties caused by the current, eliminating the effect
of drag forces that tend to elevate their body (Oliveira et al., 2010). Fish have high species diversity and a range of
ecological niches, occupying all trophic levels of aquatic ecosystems, using different strategies to get food items (Motta et al., 1995). The relationship between body shape and resource use may be related to the evolutionary history of the
species (Winemiller, 1991). Thus, morphological patterns in
assemblages tend to characterize species groups that explore the same ecological resource - e.g., species in the same trophic guild may present a higher morphological similarity, independently of their phylogenetic distance (Oliveira et al., 2010), since the exploitation of specific food items in an ecosystem can be facilitated by a specific design (Wootton, 1992; Norton & Brainerd, 1993; Gerking, 1994; Norton, 1995; Winemiller, et al., 1995; Montaña & Winemiller, 2009;
Sampaio et al., 2013). For this reason, some authors attribute to the morphology the ability to predict the ecological niche - i.e., how the body shape selects the ecological space in a given habitat, and consider that ecomorphology can be used
as a tool in analysis of assemblage structure (Winemiller, 1991; Casatti & Castro, 2006; Oliveira et al., 2010; Pagotto et al., 2011). On the other hand, since fish diets are diverse (using all available food resources in the environment), it is reasonable to question whether there are general patterns of use of prey and whether these patterns are related to the diversity of feeding mechanisms (Wainwright, 1999). In this context, correlation between morphological attributes and diet has been tested in ecomorphological hypotheses in fish
assemblages (Pouilly et al., 2003).
The presence of aquatic macrophytes increases the
structural heterogeneity of habitat, affecting biological
diversity and interspecific interactions (Agostinho et al.,
2003), shelter availability for forage species (Savino & Stein, 1989) and fish diets (Pelicice & Agostinho, 2006). It is assumed that small-sized fish species are strongly
correlated to variations in microhabitat structure (Dibble
& Pelicice, 2010) and some species of small fish spend their whole life in macrophyte stands, which may affect fish morphology. Thus, morphological variations may be
related to adaptive responses to different environmental
selection pressures (Araújo et al., 2008) and may result in
morphological convergence of phylogenetically distant species or morphological divergence of phylogenetically
closely related species (Peres-Neto, 1999).
The niche variation hypothesis of Van Valen (1965) suggests that populations with broader niches are morphologically more variable than those with narrower
niches. According to the author, the increase in trophic niche breadth of species is achieved by a greater morphological variation among individuals. Nevertheless, the Optimal
Foraging Theory (MacArthur & Pianka, 1966) predicts
that under abundance of resources, foraging species use
a specific type of food and have a narrow trophic niche. However, when such resources become scarce, the species
start to include more types of foods in the diet, increasing
niche breadth (MacArthur & Pianka, 1966; Schoener, 1971).
Based on the form-function interaction and its
consequence to the niche exploitation by fish species, the following questions are raised: is there a relationship between morphology and diet of fish found in of aquatic macrophyte stands? If so, do species with higher morphological diversity
(e.g., greater intraspecific variation) have wider trophic
niches? Issues similar to the latter have been discussed by Dennison & Baker (1991) and Griffen & Mosblack (2011), who studied the morphology of birds and crabs, respectively,
and Bolnick et al. (2007), who analyzed temperate fish and noted that generalized populations exhibit more niche variation.
Aiming to identify patterns of ecomorphological variation among feeding habits and investigate the possibility of explaining the trophic niche breadth using the pattern of
niche breadth explored by the species, so that species that feed
on a wider range of resources have greater variation in body
shape compared to those specialized in resource consumption, considering that the increase in diet breadth may be achieved
by greater morphological variation between the specimens.
Material and Methods
Study area. Paraná is the second largest river of South
America and the largest of the La Plata River basin, with 4,695 km length, a drainage area of 3.1 x 10⁶ km2 and flow
peaks of 65 x 103m3s-1(Bonetto, 1986). This region exhibits a
warm, wet tropical climate, and the annual mean temperature is 21°C with December, January and February being the warmest and wettest months, and June and July the coldest and driest ones (Maack, 2002). Floodplains are extensively colonized by macrophyte ecosystems (Mitsch & Gosselink, 1993), which promote increased structural complexity of
habitats affecting ecological diversity (Agostinho et al.,
2003). Fish have high species diversity and a range of
ecological niches, using a great variety of strategies to get food items (Motta et al., 1995). The study was conducted in
10 sampling sites located in lagoons (Pousada das Garças,
Porcos, Maria Luiza, da Onça, Água Suja, Xirica, Pombas, Ilha do Pacu, Garças and Ressaco do Bilé) of the Upper Paraná River floodplain, Brazil (Fig. 1), using as selection criteria the presence of aquatic macrophyte stands of two
different native species, Eichhornia azurea (Sw.) Kunth
and Eichhornia crassipes (Mart.) Solms. Fish samples were
collected in three stands of each macrophyte species per lake, in October 2012.
Fish sampling. Considering a method adopted by Casatti
et al. (2003), Ferrareze & Nogueira (2011) and Gomes et al. (2012), fish were collected with a 1.0 m x 1.5 m sieve, 0.05 mm mesh, which was passed three times across each macrophyte stand from the bottom to the surface. Thus, different sizes of fishes were captured (CP of 5.45 mm to 36.06 mm). Using this method, we believe that it was possible to capture fish selecting the specimens by the foraging site, not biased by fish size. The specimens caught were fixed in 4% formaldehyde and subsequently stored in alcohol 70°GL. The specimens were identified according to
Britski et al. (2007), Graça & Pavanelli (2007) and Benine
et al. (2009), labeled, weighed and measured. Only adult individuals were analyzed (Gomiero et al., 2008; Montag et al., 2011), considering that the ontogenetic growth can promote significant changes in morphology (Novakowski et al., 2004; Vitule et al., 2008) or feeding habit (Drewe et al., 2004). Voucher specimens of Apistogramma commbrae (Regan, 1906) (NUP 017079, 017085, 017089, 017093,
017095), Hyphessobrycon eques (Steindachner, 1882) (NUP 017731, 017086, 017090, 017099), Moenkhausia forestii Benine, Mariguela & Oliveira, 2009 (NUP 017081, 017087, 017091, 017096, 017100), Pamphorichthys
sp. (NUP 017082, 017088, 017094, 017097, 017101),
Serrapinnus calliurus (Boulenger, 1900) (NUP 017083, 017092, 017102) and Serrapinnus notomelas (Eigenmann,
1915) (NUP 017084, 017098, 017103) were deposited in the Coleção Ictiológica do Núcleo de Pesquisas em Limnologia, Ictiologia e Aqüicultura, Universidade Estadual de Maringá, Paraná State, Brazil (Nup or Nupélia; http://peixe.nupelia.uem.br/).
Fig. 1. Map depicting location of the lagoons studied (PU - Pousada das Garças; PO - Porcos; ML - Maria Luiza; ON - Onça;
Morphometric data estimation. Linear morphometric
measures and areas were taken (Table 1; see Oliveira et al.,
2010 for further details) on the left side of the individuals using digital caliper (accurate to 0.01 mm). Areas of fins and eyes were drawn from the outline of their structures and then digitized and incorporated in the software AutoCAD® (Autodesk, 2012) for calculating the inner area. From the morphological measurements, we calculated 21 ecomorphological indices (Table 1). This procedure allows evaluating information restricted to differences between
shapes and promotes the independence of analysis as to the
size of specimens (Gatz, 1979; Winemiller, 1991). Although
body size is admittedly an important factor in ecological
relationships among fish, significant differences in body size
may conduct the analysis to a trend imposed exclusively
by body size. Thus, the utilization of indices minimize the
chances of the analysis be dominated by a single variable
(Winemiller, 1991). Studies using indices were performed by other authors (Gatz, 1979; Watson & Balon, 1984; Montaña & Winemiller, 2010; Sampaio et al., 2013).
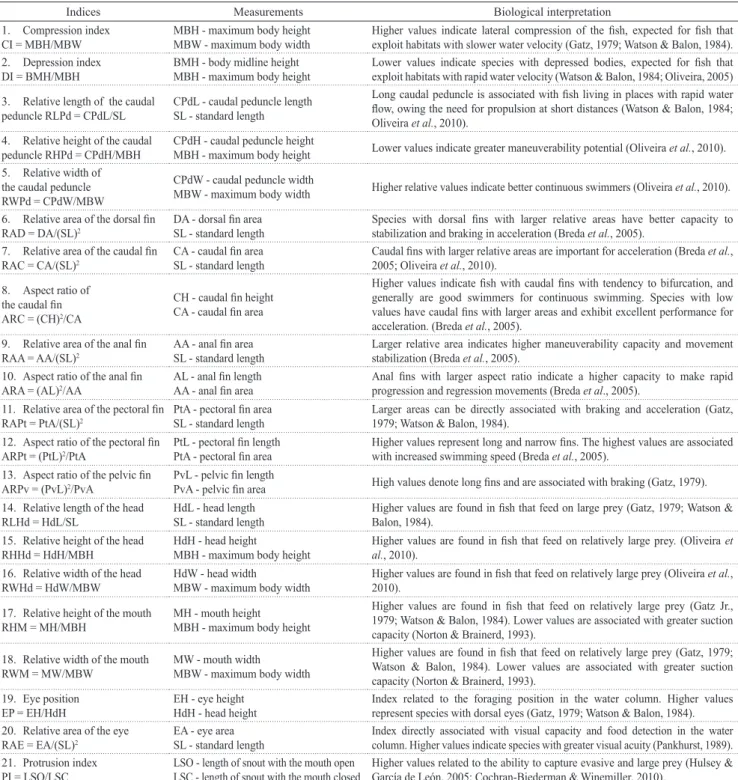
Table 1. Ecomorphological indices with respective formulas, measurements and biological interpretations.
Indices Measurements Biological interpretation
1. Compression index
CI = MBH/MBW MBH - maximum body height MBW - maximum body width Higher values indicate lateral compression of the fish, expected for fish that exploit habitats with slower water velocity (Gatz, 1979; Watson & Balon, 1984). 2. Depression index
DI = BMH/MBH BMH - body midline heightMBH - maximum body height Lower values indicate species with depressed bodies, expected for fish that exploit habitats with rapid water velocity (Watson & Balon, 1984; Oliveira, 2005) 3. Relative length of the caudal
peduncle RLPd = CPdL/SL CPdL - caudal peduncle lengthSL - standard length
Long caudal peduncle is associated with fish living in places with rapid water flow, owing the need for propulsion at short distances (Watson & Balon, 1984; Oliveira et al., 2010).
4. Relative height of the caudal
peduncle RHPd = CPdH/MBH CPdH - caudal peduncle heightMBH - maximum body height Lower values indicate greater maneuverability potential (Oliveira et al., 2010). 5. Relative width of
the caudal peduncle RWPd = CPdW/MBW
CPdW - caudal peduncle width
MBW - maximum body width Higher relative values indicate better continuous swimmers (Oliveira et al., 2010). 6. Relative area of the dorsal fin
RAD = DA/(SL)2
DA - dorsal fin area
SL - standard length Species with dorsal fins with larger relative areas have better capacity to stabilization and braking in acceleration (Breda et al., 2005). 7. Relative area of the caudal fin
RAC = CA/(SL)2
CA - caudal fin area
SL - standard length Caudal fins with larger relative areas are important for acceleration (Breda et al.2005; Oliveira et al., 2010). , 8. Aspect ratio of
the caudal fin ARC = (CH)2/CA
CH - caudal fin height CA - caudal fin area
Higher values indicate fish with caudal fins with tendency to bifurcation, and generally are good swimmers for continuous swimming. Species with low values have caudal fins with larger areas and exhibit excellent performance for acceleration. (Breda et al., 2005).
9. Relative area of the anal fin RAA = AA/(SL)2
AA - anal fin area
SL - standard length Larger relative area indicates higher maneuverability capacity and movement stabilization (Breda et al., 2005). 10. Aspect ratio of the anal fin
ARA = (AL)2/AA
AL - anal fin length
AA - anal fin area Anal fins with larger aspect ratio indicate a higher capacity to make rapid progression and regression movements (Breda et al., 2005). 11. Relative area of the pectoral fin
RAPt = PtA/(SL)2
PtA - pectoral fin area
SL - standard length Larger areas can be directly associated with braking and acceleration (Gatz, 1979; Watson & Balon, 1984). 12. Aspect ratio of the pectoral fin
ARPt = (PtL)2/PtA
PtL - pectoral fin length
PtA - pectoral fin area Higher values represent long and narrow fins. The highest values are associated with increased swimming speed (Breda et al., 2005). 13. Aspect ratio of the pelvic fin
ARPv = (PvL)2/PvA
PvL - pelvic fin length
PvA - pelvic fin area High values denote long fins and are associated with braking (Gatz, 1979). 14. Relative length of the head
RLHd = HdL/SL HdL - head lengthSL - standard length Higher values are found in fish that feed on large prey (Gatz, 1979; Watson & Balon, 1984). 15. Relative height of the head
RHHd = HdH/MBH HdH - head heightMBH - maximum body height Higher values are found in fish that feed on relatively large prey. (Oliveira et al., 2010). 16. Relative width of the head
RWHd = HdW/MBW HdW - head widthMBW - maximum body width Higher values are found in fish that feed on relatively large prey (Oliveira et al.2010). , 17. Relative height of the mouth
RHM = MH/MBH MH - mouth heightMBH - maximum body height
Higher values are found in fish that feed on relatively large prey (Gatz Jr., 1979; Watson & Balon, 1984). Lower values are associated with greater suction capacity (Norton & Brainerd, 1993).
18. Relative width of the mouth
RWM = MW/MBW MW - mouth widthMBW - maximum body width
Higher values are found in fish that feed on relatively large prey (Gatz, 1979; Watson & Balon, 1984). Lower values are associated with greater suction capacity (Norton & Brainerd, 1993).
19. Eye position
EP = EH/HdH EH - eye heightHdH - head height Index related to the foraging position in the water column. Higher values represent species with dorsal eyes (Gatz, 1979; Watson & Balon, 1984). 20. Relative area of the eye
RAE = EA/(SL)2
EA - eye area
SL - standard length Index directly associated with visual capacity and food detection in the water column. Higher values indicate species with greater visual acuity (Pankhurst, 1989). 21. Protrusion index
Diet and assessment of interspecific morphological
patterns. After measuring morphological variables, the
specimens were gutted and stomachs were removed and stored in alcohol 70°GL. Diet was assessed by stomach
content analysis using the frequency of occurrence method (percentage of stomachs containing each item in relation to
the total of occurrences) and volumetric method according to Hyslop (1980), by which it was estimated, in percentage, the
volume of each food item in relation to the volume present in
all stomachs. The volume was obtained with a gridded Petri dish, on which the food items were compressed with glass slides until 1 mm height. The number of quadrants occupied by each food item on the dish was multiplied by 0.001 to
obtain the volumes in mm3 as proposed by Hellawell &
Abel (1971). Food items (in brackets) were identified under
stereoscopic and optical microscope, and subsequently
grouped into food categories (bolded): detritus/sediment (inorganic matter and decaying organic matter), algae (Bacillariophyceae, Chlorophyceae, Clamydophyceae,
Cyanophyceae, Dinophyceae, Euglenophyceae,
Oedogoniophyceae and Zygnemaphyceae), higher plants (fruits, seeds and roots), crustaceans (Cladocera, Copepoda, Conchostraca, Ostracoda and Amphipoda), aquatic insects (larval stages of Chironomidae, Coleoptera, Trichoptera, larvae and pupae of non-Chironomid Diptera, young stages of Ephemeroptera and remains of aquatic insects), terrestrial invertebrates (adult stages of Hymenoptera, Coleoptera, Hemiptera, Odonata, Collembola, Orthoptera, Homoptera, Aranae and larvae of Lepidoptera), other aquatic invertebrates (Acari, Rotifera, Testate Amoebae and spicules of Porifera), hyphae of fungi, fish scales and insect remains. For species with undefined stomach, we analyzed the first third of the intestine. In order to summarize the data of the diet of fish species, identify feeding trends and assist in classification of feeding habits, we used the Alimentary Index (IAi) (Kawakami & Vazzoler, 1980):
FixVi
IAi = ___________ x100
∑n
n=1 FixVi
Where: Fi is the frequency of occurrence of item i (%), Vi is
the relative volume of item i (% of total) and n is the number
of items. This index evaluates the importance of each food
item in the diet of different species analyzed.
The ordination of the species according to their ecomorphological characteristics was evaluated by principal component analysis (PCA) performed from the correlation matrix of log-transformed data. This analysis investigated the grouping pattern of the species with the most similar characteristics and which variables are more important for their segregation. Axes were retained for
interpretation according to the broken-stick criterion,
in which the axes with eigenvalues greater than those generated by the model were used for interpretation. This analysis was performed in the PC-ORD 5.0 software (McCune & Mefford, 1999).
A Mantel test was carried out to check whether the species that used the same ecological resources were the ones most similar morphologically. This method compared the matrix of morphological distance between the species with the
matrices for trophic distance, both using the same specimens.
The null hypothesis was that the morphological patterns are independent of the resource used. The morphological distances were calculated based on the mean Euclidian distance between each pair of specimens of each of the species studied. The trophic distance was calculated from the volume percentage of each food category (detritus/sediment, algae, higher plants,
crustaceans, aquatic insects, terrestrial invertebrates, other
aquatic invertebrates, hyphae of fungi, fish scales and insect remains) using the Bray-Curtis distance. The PCA and the Mantel test were run in the software PC-ORD 5.0 (McCune & Mefford, 1999) and Statistica 7.1 (StatSoft, 2005).
Diet and assessment of intraspecific morphological
patterns. A second Mantel test was run to test the null
hypothesis of no significant relationship between feeding and intraspecific morphological variations. Thus, for constructing the trophic distance matrix, we used the volume
of different food categories consumed by the specimens
and the Bray-Curtis distance. Similarly, for data related to morphology, we used the indices and the Euclidean distance between each pair of specimens of each of the species studied. In order to determine the trophic niche breadth, the Standardized Levins Index was applied, using the expression proposed by Hurlbert (1978):
Bi= [ ( ∑ j Pij2 )-1 - 1] (n - 1) -1
Where: Biis the standardized trophic niche breadth, Pijis the
proportion of food category j in the diet of species i and n is the total number of food categories. The breadth ranges from zero to one, the values closer to zero (0) relate to fish consuming just one type of food resource and values closer to one (1) are relative to those consuming different types of
food resource.
A second PCA was applied on the correlation matrix with log-transformed ecomorphological indices to verify the intraspecific morphological variation through the analysis of morphological range. The retention of significant axes was
determined by the Broken-Stick model. From this analysis,
we calculated the Euclidean distance between the scores of each pair of specimens in the first four axes, according to the following mathematical expression:
n
Djk =
[
∑
(
xij -xik)
2]
1/2i=1
where: Djk is the Euclidean distance between specimens j
Based on the calculation of the Euclidean distance
between pairs of specimens, the following parameters were determined for each population: the average distance between the specimen and the centroid of the population (CD), the average distance to the nearest neighbor (NND)
and standard deviation of the average distance to the nearest
neighbor (SDNND). The average distance between the
specimens and the centroid of the population represents
the degree of occupation of ecomorphological space. Thus,
higher values indicate the occupation of larger spaces,
which may be related to higher diversity of body shapes and ecological niches exploited by the population. The nearest neighbor of a specimen is the one with whom it has the highest morphological similarity (lower value of D) and the average of distances between all the nearest
neighbors is the degree of packing of specimens in the
ecomorphological space occupied by the population. Thus, lower values of NND indicate populations with greater
packing of specimens in the ecomorphological space, that
is, individuals with higher similarity in body shape. The
standard deviation of the average distance of the nearest neighbor represents packaging evenness of individuals in
the ecomorphological space. Consequently, lower values are related to populations where distances between nearest
neighbors are more uniform.
The trends of variability in the observed values of CD, NND, SDNND (dependent variables) according to the
trophic niche breadth (i.e., Bi values) for each assemblage
analyzed in the macrophytes stands (independent variable) were analyzed by simple linear regressions using the software Statistica 7.1 (StatSoft, 2005).
Results
Diet and interspecific morphological variations. We collected 48 species, but only six were analyzed, since they achieved at least 5% of total caught specimens:
Hyphessobrycon eques, Moenkhausia forestii, Serrapinnus calliurus and Serrapinnus notomelas, belonging to
the order Characiformes; Apistogramma commbrae,
Perciformes; and Pamphorichthys sp.,Cyprinodontiformes.
In total, 506 fish were measured and had their stomach
contents analyzed. Apistogramma commbrae preferentially
consumed aquatic insects (IAi = 70.88%) and was classified
as an aquatic insectivore. Hyphessobrycon eques fed on
large amounts of crustaceans (IAi = 60.30%) and aquatic insects (IAi = 19.35%), and was classified as an aquatic
invertivore. Moenkhausia forestii consumed aquatic
insects (IAi = 40.37%), higher plants (IAi = 38.09%) and terrestrial invertebrates (IAi = 20.93%), and was classified as omnivorous. Pamphorichthys sp. consumed
greater amounts of detritus/sediment (IAi = 63.0%), algae (IAi = 25.15%) to a lesser extent, and was classified as
detritivorous. Serrapinnus calliurus and S. notomelas consumed algae almost exclusively (IAi = 89.29% and IAi = 71.59%, respectively) and were classified as algivorous (Table 2).
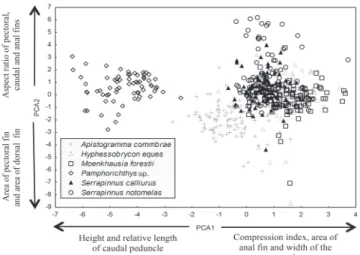
PCA (Fig. 2) revealed the significance of the first four axes according to the Broken-Stick criterion. Together, axes 1 and 2 explained 36.91% and were used for the
characterization of morphological diversity among species. Axis 1 demonstrated the segregation of H. eques, M. forestii, S. calliurus and S. notomelas, whose scores were
located on the extreme positive side and showed higher
values for body compression index, relative area of the anal
fin and relative width of the mouth. On the other side of
this axis, A. commbrae and Pamphorichthys sp. showed higher values for height and relative length of the caudal
peduncle (Fig. 2). Axis 2 showed segregation of species with more positive scores: Pamphorichthys sp. and S. notomelas,
which tended to have higher aspect-ratio values of the pectoral, caudal and anal fins, while A. commbrae, which showed higher values of area of the dorsal and pectoral fins, was positioned at the negative end of the gradient (Fig. 2).
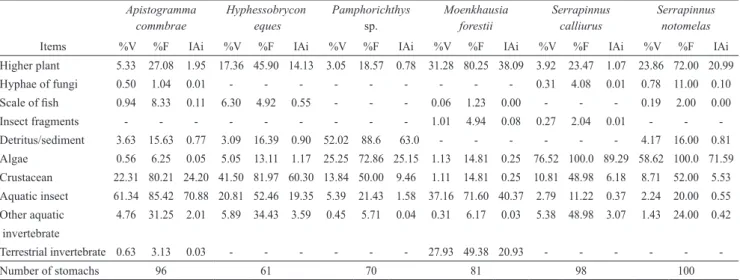
Table 2. Diet composition and Alimentary Index calculated for species occupying macrophyte stands of the upper Paraná
River basin (%V = percentage of volume, %F = frequency of occurrence, IAi = alimentary index).
Apistogramma Hyphessobrycon Pamphorichthys Moenkhausia Serrapinnus Serrapinnus commbrae eques sp. forestii calliurus notomelas Items %V %F IAi %V %F IAi %V %F IAi %V %F IAi %V %F IAi %V %F IAi Higher plant 5.33 27.08 1.95 17.36 45.90 14.13 3.05 18.57 0.78 31.28 80.25 38.09 3.92 23.47 1.07 23.86 72.00 20.99 Hyphae of fungi 0.50 1.04 0.01 - - - 0.31 4.08 0.01 0.78 11.00 0.10 Scale of fish 0.94 8.33 0.11 6.30 4.92 0.55 - - - 0.06 1.23 0.00 - - - 0.19 2.00 0.00
Insect fragments - - - 1.01 4.94 0.08 0.27 2.04 0.01 - -
-Detritus/sediment 3.63 15.63 0.77 3.09 16.39 0.90 52.02 88.6 63.0 - - - 4.17 16.00 0.81 Algae 0.56 6.25 0.05 5.05 13.11 1.17 25.25 72.86 25.15 1.13 14.81 0.25 76.52 100.0 89.29 58.62 100.0 71.59 Crustacean 22.31 80.21 24.20 41.50 81.97 60.30 13.84 50.00 9.46 1.11 14.81 0.25 10.81 48.98 6.18 8.71 52.00 5.53 Aquatic insect 61.34 85.42 70.88 20.81 52.46 19.35 5.39 21.43 1.58 37.16 71.60 40.37 2.79 11.22 0.37 2.24 20.00 0.55 Other aquatic 4.76 31.25 2.01 5.89 34.43 3.59 0.45 5.71 0.04 0.31 6.17 0.03 5.38 48.98 3.07 1.43 24.00 0.42 invertebrate
Terrestrial invertebrate 0.63 3.13 0.03 - - - 27.93 49.38 20.93 - - -
Fig. 2. Distribution of species scores in the multivariate
ecomorphological space generated by the first two PCA axes (axis 1: eigenvalue = 4.3 and explained variability (%) = 20.474; axis 2: eigenvalue = 3.4 and explained variability (%) =16.434). The main variables responsible for explaining
the ordination pattern are indicated in each axis (eigenvectors
axis 1: compression index = 0.9006, relative area of the anal fin = 0.6539, relative width of the mouth = 0.6068, relative height of the caudal peduncle = -0.9125 and relative length of the caudal peduncle = -0.8237; eigenvectors axis 2: aspect ratio of the pectoral fin = 0.6544, aspect ratio of the caudal fin = 0.5162, aspect ratio of the anal fin = 0.5145, relative area of the pectoral fin = -0.7929 and relative area of the dorsal fin = -0.7373).
The Mantel test revealed significant interspecific relationship (r = 0.93, p = 0.002) between morphology and
the use of food resources categories for all species.
Relationship between diet and intraspecific morphological variations. The intraspecific relationship between morphology and use of food resources was confirmed by the second Mantel test for all species, A. commbrae (r = 0.71, p < 0.0001), H. eques (r = 0.75, p < 0.0001), M. forestii (r = 0.82, p < 0.0001), Pamphorichthys sp. (r = 0.85, p < 0.0001), S. calliurus ( = 0.74, p < 0.0001)
and S. notomelas (r = 0.78, p < 0.0001).
The Standardized Levins Index (Bi) revealed the different
trophic niche breadths of different species. The algivorous S. calliurus presented a narrower trophic niche (Bi = 0.11),
followed by the aquatic insectivorous A. commbrae (Bi =
0.16), the algivorous S. notomelas (Bi = 0.20), the omnivorous
M. forestii (Bi = 0.31), the detritivorous Pamphorichthys sp. (Bi = 0.36) and, finally, the aquatic invertivorous H. eques
that showed the widest trophic niche breadth (Bi = 0.48).
The ecomorphological diversifications calculated for each population are listed in Table 3. The average distance between the species and the centroid (CD) of the population was higher for S. notomelas and Pamphorichthys sp., indicating the occupation of larger ecomorphological spaces
(Fig. 3, Table 3). The average distance between the nearest
neighbors (NND) was lower for S. calliurus. This fact
indicated a greater similarity among individuals considering
body shape (Fig. 3, Table 3). The lowest SDNND value was
found for S. notomelas, indicating that the distances between the nearest neighbors are more uniform.
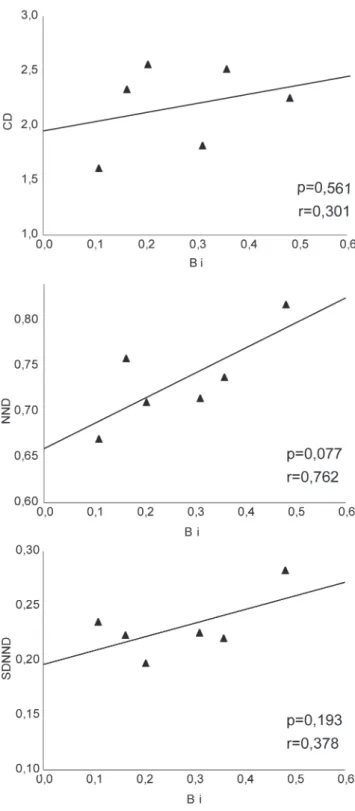
The variation of the observed values of CD, NND, SDNND (dependent variables) according to the trophic niche breadth (independent variable) across the different populations analyzed by simple linear regression was not significant (p> 0.05). This indicated that the ranges of morphological and trophic variability were not significantly related (Fig. 4).
Discussion
Ecomorphological studies are based on the concept that adaptive variations in phenotype can produce differences in
the performance of species, which consequently generate variations in resource use (Wainwright, 1994). The hypothesis
that morphology explains the variations in diet among species
was confirmed by significant relationships between matrices of trophic and morphological distances. Likewise, this relationship was also significant for intraspecific analysis.
The Alimentary Index enabled the classification into feeding habits, following patterns presented in other studies,
such as H. eques, aquatic invertivorous (Casatti et al., 2003), S. notomelas, algivorous (Casatti et al., 2003; Pelicice & Agostinho, 2006) and congeners of M. forestii, omnivorous
(Luz-Agostinho et al., 2006; De Mérona et al., 2008; Santos et al., 2009). Nevertheless, some results reported herein differ from those in the literature; for instance, H. eques was classified as aquatic invertivorous but considered by other
researchers as zooplanktivorous in macrophyte stands of
the same floodplain studied (Pelicice & Agostinho, 2006; Crippa et al., 2009). Serrapinnus notomelas, algivorous, was
considered herbivorous, consuming algae and bryophytes
(Pelicice & Agostinho, 2006) and omnivorous tending
to herbivory (Brandão-Gonçalves et al., 2010). These
differences in the diet can be attributed to the plasticity
observed in freshwater fish, whereas environmental characteristics and ontogeny may influence the use of food
resources (Abelha et al., 2001).
The PCA showed that Pamphorichthys sp., detritivorous,
showed a larger caudal peduncle, which helps to maintain the body at the bottom of areas with rapid water flow, which is its typical foraging site. Also, A. commbrae, aquatic insectivorous, tended to present a larger caudal
peduncle, since it feeds mainly on larvae of Chironomidae and Trichoptera that live associated with the substrate. This species had larger pectoral fins, which can be directly associated with braking and accelerations (Gatz, 1979, Watson & Balon, 1984) and larger dorsal fins, which provide
Fig. 3. Distribution of species scores in the multivariate ecomorphological space generated by the first two PCA axes. In each diagram,
the species scores were distinguished by black symbols. A polygon was used to delimit the population ecomorphological space.
Table 3. Ecomorphological distances calculated for each species.
Species CD NND SDNND
Apistogramma commbrae 2.330 0.757 0.223
Hyphessobrycon eques 2.252 0.816 0.282
Moenkhausia forestii 1.813 0.714 0.225
Pamphorichthys sp. 2.514 0.736 0.219
Serrapinnus calliurus 1.610 0.669 0.235
Fig. 4. Simple linear regressions between the Standardized
Levins Index (Bi) and the ecomorphological distances calculated for populations analyzed. Significance values of the models are indicated (p).
Characiformes H. eques, M. forestii, S. calliurus and S. notomelas were characterized by compressed bodies, which are expected in fish that occupy lentic environments and enable increased efficiency in vertical movements (Gatz, 1979; Watson & Balon, 1984), because this characteristic
provides less resistance to perform maneuvers such as pitch
(dorso-ventral movements) or yaw (lateral movements) (Alexander, 1967). Thus, this body shape may facilitate the
occupation of structured environments such as macrophyte
stands in areas of low water flow (Esguícero & Arcifa, 2010). Nevertheless, they showed larger anal fins, which
implies in greater maneuverability and stabilization of
movement (Breda, 2005). Maneuverability is defined as
the ability of organisms to perform quick small-angled
maneuvers (Webb et al., 1996). Thus, species with these
characteristics exhibit a superior performance in the exploitation of structurally complex habitats. Serrapinnus notomelas tended to show longer and narrower pectoral fins, which are associated with higher swimming speed in other species, forked caudal fin, which is usually indicative of good swimmers for continuous swimming and larger anal fin that provides increased ability to perform rapid forward and backward movements (Breda, 2005). The greater efficiency in performing vertical movements and high swimming capacity, promoted by morphological characteristics, may have allowed the use of a wide variety
of resources, thereby explaining the feeding habits of
Characiform fish (i.e., consumption of insects, crustaceans,
higher plants and algae). In this study, there was no significant relationship between the morphological range shown by ecomorphological distances and the trophic niche breadth within each species, thus rejecting the second
hypothesis proposed.
The trophic niche breadth of S. calliurus, algivorous,
was narrow, as it consumed large amounts of algae. The occupation of the ecomorphological space was also relatively low (CD = 1.61) considering the higher similarity in body shape (NND = 0.66) among the specimens. In
contrast, H. eques, an aquatic invertivore, presented a
wider trophic niche breadth (Bi = 0.48), as it consumed
large amounts of crustaceans (Cladocera and Copepoda), aquatic insects (Diptera - Chironomidae, Ephemeroptera) and higher plants to a lesser extent. This species showed relatively high morphological diversification (CD = 2.25)
and the results indicated that a greater morphological diversity may enable an increase in the range of food items,
widening the trophic niche breadth.
Serrapinnus notomelas, an algivore, presented a narrow
trophic niche breadth (Bi = 0.20) and greater morphological
diversity (CD = 2.55). This species occupied a larger ecomorphological space and showed higher evenness (SDNND = 0.19) in the distribution of specimens with respect to body shape, as well as Pamphorichthys sp.
Liem (1980, 1990), one of the first to observe in fish that
some morphological specialists have behaved as trophic generalists, argued that the aquatic environment offers opportunities for capturing different prey, providing greater versatility in trophic morphology than other vertebrates.
According to Colborne et al. (2013), morphological characteristics often have multiple ecological roles, which
of preferential or non-preferential food resources, that
is, a fish with highly specialized morphology may show
specialist feeding or even generalist habit, because in this
latter case, some resources may be difficult to exploit, even by a specialist (Robinson & Wilson, 1998).
There was no significant relationship for the set of
species studied. As the species morphology is associated
with habitat use and availability of resources (Gatz, 1979),
the incompatibility may have occurred due to interference
with these factors. Binning & Chapman (2010) suggested that the incompatibility between morphology and diet can occur between different populations of the same species,
caused by factors including seasonality of resources, phenotypic plasticity and complex indirect interactions.
According to the Optimal Foraging Theory, the abundance or scarcity of food interferes with trophic niche breadth of species, which, in environments with abundant resources, consume specific foods and present narrower trophic niche (MacArthur & Pianka, 1966; Schoener, 1971). This may have occurred with S. notomelas and
A. commbrae that showed relatively high morphological diversity (CD), but narrow niches. Nevertheless, in areas with scarce resources, species can add food items to the diet, which, in turn, increase the niche breadth (MacArthur & Pianka, 1966; Schoener, 1971). This may have occurred with H. eques and Pamphorichthys sp. that exhibited
relatively high morphological diversity and less narrow niches, allowing the consumption of different items.
Therefore, species morphology is related to the use of
food resources and ecomorphology represents a fundamental
tool for better understanding the relationship between morphology and diet, and should be used combined with analysis of resource abundances. In this study, it was shown that species with low and high morphological diversity demonstrated narrow trophic niches and the availability
of resources might have been essential for consumption.
Ecomorphological studies on intraspecific variations
are required to understand the complex relationships
between morphological and ecological specializations and generalizations. It is suggested that species with higher morphological diversity may have wider trophic niche in environments with lower availability of food resources, and narrower trophic niche in environments with abundant
resources due to foraging preferences.
Acknowledgements
The authors are grateful to Norma S. Hahn and Edson F. Oliveira for constructive comments; Fabio T. Mise, Hugo J. Message and Rogerio F. Hanischfor their help with the fieldwork; Gabriel Deprá, Hugmar P. Silva and Renata R. Ota for identification of the collected fishes; PEA/Nupélia/ UEM/PROEX for logistic support; A. V. R. Prado would like to thank Coordenação de Aperfeiçoamento de Pessoal de Nível Superior (CAPES/Ministério da Educação, Brazil)
for the scholarships.
References
Abelha, M. C. F., A. A. Agostinho & E. Goulart. 2001. Plasticidade trófica em peixes de água doce. Acta Scientiarum. Biological Sciences, 23: 425-434.
Agostinho, A. A., L. C. Gomes & H. F. Julio Jr. 2003. Relações entre macrófitas aquáticas e fauna de peixes. Pp. 261-279. In: Thomaz, S. M. & L. M. Bini. Ecologia e Manejo de Macrófitas Aquáticas. Maringá, Eduem.
Alexander, R. McN. 1967. Functional design in fishes. London, Hutchinson University Library, 160p.
Araújo, M. S, P. R. Guimarães-Jr, R. Svanbäck, A. Pinheiro, P. Guimarães, S. F. Reis & D. I. Bolnick. 2008. Network analysis reveals contrasting effects of intraspecific competition on individual vs. population diets. Ecology, 89: 1981-1993. Autodesk. 2012. AutoCAD: graphic computation (Version 2012)
[Software]. Autodesk Inc., San Rafael.
Benine, R. C., T. C. Mariguela & C. Oliveira. 2009. New species of Moenkhausia Eigenmann, 1903 (Characiformes: Characidae) with comments on the Moenkhausia oligolepis species complex. Neotropical Ichthyology, 7: 161-168.
Binning, S. A. & L. J. Chapman. 2010. Is intraspecific variation in diet and morphology related to environmental gradients? Exploring Liem’s paradox in a cichlid fish. Integrative Zoology, 5: 241-255.
Bolnick, D. I., R. Svanbäck, M. S. Araújo & L. Persson. 2007. Comparative support for the niche variation hypothesis that more generalized populations also are more heterogeneous. Proceedings of the National Academy of Sciences of the USA, 104: 10075-10079.
Bonetto, A. A. 1986. The Paraná river system. Pp. 541-555. In: Davies, B. R. & K. F. Walker (Eds.). The ecology of river systems. Dordrecht, Springer Science+Business Media. Bourke, P., P. Magnan & M. A. Rodríguez. 1997. Individual
variations in habitat use and morphology in brook charr. Journal of Fish Biology, 51: 783-794.
Brandão-Gonçalves, L., S. A. Oliveira & S. E. Lima-Junior. 2010. Hábitos alimentares da ictiofauna do córrego Franco, Mato Grosso do Sul, Brasil. Biota Neotropica, 10: 21-30.
Breda, L. 2005. Ecomorfologia de Astyanax altiparanae, Moenkhausia intermedia, Roeboides paranensis e Serrasalmus marginatus (Osteichthyes-Characidae) da planície alagável do alto rio Paraná, Brasil:variações inter e intra-específica. Maringá, Universidade Estadual de Maringá. Dissertação de Mestrado em Ecologia de Ambientes Aquáticos Continentais, 30p.
Breda, L., E. F. Oliveira & E. Goulart. 2005. Ecomorfologia de locomoção de peixes com enfoque para espécies neotropicais. Acta Scientiarum. Biological Sciences, 27: 371-381.
Britski, H. A., K. Z. S. Silimon & B. S. Lopes. 2007. Peixes do Pantanal: manual de identificação. Segunda edição. Brasília, Embrapa Informação Tecnológica, 227p.
Casatti, L., H. F. Mendes & K. M. Ferreira. 2003. Aquatic macrophytes as feeding site for small fishes in the Rosana
reservoir, Paranapanema river, southeastern Brazil.Brazilian
Journal of Biology, 63: 213-222.
Cochran-Biederman, J. L. & K. O. Winemiller. 2010. Relationships among habitat, ecomorphology and diets of cichlids in the Bladen River, Belize. Environmental Biology of Fishes, 88: 143-152.
Colborne, S. F., P. R. Peres-Neto, F. J. Longstaffe & B. D. Neff. 2013. Effects of foraging and sexual selection on ecomorphology of a fish with alternative reproductive tactics. Behavioral Ecology, 24: 1339-1347.
Crippa, V. E. L., N. S. Hahn & R. Fugi. 2009. Food resource used by small-sized fish in macrophyte patches in ponds of the upper Paraná river floodplain. Acta Scientiarum. Biological Sciences, 31: 119-125.
De Mérona, B., B. Hugueny, F. L. Tejerina-Garro & E. Gautheret. 2008. Diet-morphology relationship in a fish assemblage from a medium-sized river of French Guiana: the effect of species taxonomic proximity. Aquatic Living Resources, 21: 171-184. Dennison, M. D. & A. J. Baker. 1991. Morphometric variability
in continental and Atlantic island populations of chaffinches (Fringilla coelebs). Evolution, 45: 29-39.
Dibble, E. D. & F. M. Pelicice. 2010. Influence of aquatic plant-specific habitat on an assemblage of small neotropical floodplain fishes. Ecology of Freshwater Fish, 19: 381-389. Drewe, K. E., M. H. Horn, K. A. Dickson & A. Gawlicka.
2004. Insectivore to frugivore: ontogenetic changes in gut morphology and digestive enzyme activity in the characid fish Brycon guatemalensis from Costa Rican rain forest streams. Journal of Fish Biology, 64: 890-902.
Esguícero, A. L. H. & M. S. Arcifa. 2010. Which is the best environment for the development of the early life stages of fish during the dry season? Acta Limnologica Brasiliensia, 22: 267-275.
Ferrareze, M. & , M. G. Nogueira. 2011. Importance of lateral lagoons for the ichthyofauna in a large tropical reservoir. Brazilian Journal of Biology, 71: 807-820.
Fugi, R., A. A. Agostinho & N. S. Hahn. 2001. Trophic morphology of five benthic-feeding fish species of a tropical floodplain. Revista Brasileira de Biologia, 61: 27-33. Gatz, A. J. 1979. Ecological morphology of freshwater stream
fishes. Tulane Studies in Zoology and Botany, 21: 91-124. Gerking, S. D. 1994. Feeding ecology of fish. San Diego,
Academic Press, 416p.
Gomes, L. C., C. K. Bulla, A. A. Agostinho, L. P. Vasconcelos & L. E. Miranda. 2012. Fish assemblage dynamics in a Neotropical floodplain relative to aquatic macrophytes and the homogenizing effect of a flood pulse. Hydrobiologia, 685:97-107.
Gomiero, L. M., L. Garuana & F. M. S. Braga. 2008. Reproduction of Oligosarcus hepsetus (Cuvier, 1829) (Characiformes) in the Serra do Mar State Park, São Paulo. Brazilian Journal of Biology, 68: 187-192.
Gotelli, N. J. & A. M. Ellison. 2004. A primer of ecological
statistics.Massachusetts, Publishers Sunderland, 479p.
Graça, W. J. & C. S Pavanelli. 2007. Peixes da planície de inundação do alto rio Paraná e áreas adjacentes. Maringá, Eduem, 241p. Griffen, B. D. & H. Mosblack. 2011. Predicting diet and
consumption rate differences between and within species using gut ecomorphology. Journal of Animal Ecology, 80: 854-863. Hellawell, J. M. & R. Abel. 1971. A rapid volumetric method for
the analysis of the food of fishes. Journal of Fish Biology, 3: 29-37.
Hulsey, C. D. & F. J. García de León. 2005. Cichlid jaw mechanics: linking morphology to feeding specialization. Functional Ecology, 19: 487-494.
Hurlbert, S. H. 1978. The measurement of niche overlap and some relatives. Ecology, 59: 67-77.
Hyslop, E. J. 1980. Stomach contents analysis: a review of methods and their application. Journal of Fish Biology, 17: 411-429. Kawakami, E. & G. Vazzoler. 1980. Método gráfico e estimativa de
índice alimentar aplicado no estudo de alimentação de peixes. Boletim do Instituto Paulista de Oceanografia, 29: 205-207. Liem, K. F. 1980. Adaptive significance of intra- and interspecific
differences in the feeding repertoires of cichlid fishes. American Zoologist, 20: 295-314.
Liem, K. F. 1990. Aquatic versus terrestrial feeding modes: possible impacts on the trophic ecology of vertebrates. American Zoologist, 30: 209-221.
Luz-Agostinho, K. D. G., L. M. Bini, R. Fugi, A. A. Agostinho & H. F. Júlio Jr. 2006. Food spectrum and trophic structure of the ichthyofauna of Corumbá reservoir, Paraná river Basin, Brazil. Neotropical Ichthyology, 4: 61-68.
Maack, R. 2002. Geografia física do Estado do Paraná. Curitiba, Imprensa Oficial, 438p.
MacArthur, R. H. & E. R. Pianka. 1966. On optimal use of a patchy environment. The American Naturalist, 100: 603-609. McCune, B. & M. J. Mefford. 1999. PC-ORD. Multivariate
Analysis of Ecological Data. Version 5.0, Gleneden Beach, MjM Software Design.
Mitsch, W. J. & J. G. Gosselink. 1993. Wetlands. 2.ed. New York, Van Nostrand Reinhold, 722p.
Montag, L. F. A., T. M. S. Freitas, R. D. O. Raiol & M. V. Silva. 2011. Length-weight relationship and reproduction of the
guppy Poecilia reticulata (Cyprinodontiformes: Poeciliidae) in
urban drainage channels in the Brazilian city of Belém. Biota Neotropica, 11: 93-97.
Montaña, C. G. & K. O. Winemiller. 2009. Comparative feeding ecology and habitats use of Crenicichla species (Perciformes: Cichlidae) in a Venezuelan floodplain river. Neotropical Ichthyology, 7: 267-274.
Montaña, C. G. & K. O. Winemiller. 2010. Local-scale habitat influences morphological diversity of species assemblages of cichlid fishes in a tropical floodplain river. Ecology of Freshwater Fish, 19: 216-227.
Motta, P. J., S. F. Norton & J. J. Luczkovich. 1995. Perspectives on the ecomorphology of bony fishes. Environmental Biology of Fishes, 44: 11-20.
Norton, S. F. & E. L. Brainerd. 1993. Convergence in the feeding mechanics of ecomorphologically similar species in the Centrarchidae and Cichlidae. Journal of Experimental Biology, 176: 11-29.
Novakowski, G. C., R. Fugi & N. S. Hahn. 2004. Diet and dental
development of three species of Roeboides (Characiformes:
Characidae). Neotropical Ichthyology, 2: 157-162.
Oliveira, E. F., E. Goulart, L. Breda, C. V. Minte-Vera, L. R. S. Paiva & M. R. Vismara. 2010. Ecomorphological patterns of the fish assemblage in a tropical floodplain: effects of trophic, spatial and phylogenetic structures. Neotropical Ichthyology, 8: 569-586.
Pagotto, J. P. A., E. Goulart, E. F. Oliveira & C. B. Yamamura. 2009. A ecomorfologia como ferramenta para análise da estrutura de assembleias. Pp. 327-346. In: Lansac-Tôha, F. A., E. Benedito & E. F. Oliveira (Eds..). Contribuições da história da ciência e das teorias ecológicas para a Limnologia.
Maringá, Eduem.
Pagotto, J. P. A., E. Goulart, E. F. Oliveira & C. B. Yamamura. 2011. Trophic ecomorphology of Siluriformes (Pisces, Osteichthyes) from a tropical stream. Brazilian Journal of Biology, 71: 469-479.
Pankhurst, N. W. 1989. The relationship of ocular morphology to feeding modes and activity periods in shallow marine teleosts from New Zealand. Environmental Biology of Fishes, 26: 201-211.
Pelicice, F. M. & A. A. Agostinho. 2006. Feeding ecology of fishes associated with Egeria spp. patches in a tropical reservoir, Brazil. Ecology of Freshwater Fish, 15: 10-19.
Peres-Neto, P. R. 1999. Alguns métodos e estudos em ecomorfologia de peixes de riacho. Pp. 209-236. In: Caramaschi, E. P., R. Mazzoni & P. R. Peres-Neto (Eds.). Ecologia de peixes de riachos. Série Oecologia Brasiliensis:. Rio de Janeiro, Ppge-UFRJ.
Pouilly, M., F. Lino, J. G. Bretenoux & C. Rosales. 2003. Dietary–morphological relationships in a fish assemblage of the Bolivian Amazonian floodplain. Journal of Fish Biology, 62: 1137-1158.
Robinson, B. W. & D. S. Wilson. 1998. Optimal foraging, specialization, and a solution to Liem’s paradox. The American Naturalist, 151: 223-235.
Sampaio, A. L. A., J. P. A. Pagotto & E. Goulart. 2013. Relationships between morphology, diet and spatial distribution: testing the effects of intra and interspecific morphological variations on the patterns of resource use in two Neotropical Cichlids. Neotropical Ichthyology, 11: 351-360.
Santos, C. L., I. A. Santos & C. J. Silva. 2009. Ecologia trófica de peixes ocorrentes em bancos de macrófitas aquáticas na baia Caiçara, Pantanal Mato-Grossense. Brazilian Journal of Biosciences, 7: 473-476.
Savino, J. F. & R. A, Stein. 1989. Behavioral interactions between fish predators and their prey: effects of plant density. Animal Behaviour, 37: 311- 321.
Schoener, T. W. 1971. Theory of feeding strategies. Annual Review of Ecology and Systematics, 2: 369–404.
Statsoft, Inc. 2005. Statistica (data analysis software system). Version 7.1.
Van Valen, L. 1965. Morphological variation and width of ecological niches. The American Naturalist, 99: 377-390. Vitule, J. R. S., M. R. Braga & J. M. R. Aranha. 2008. Ontogenetic,
spatial and temporal variations in the feeding ecology of Deuterodon langei Travassos, 1957 (Teleostei: Characidae) in a Neotropical stream from the Atlantic rainforest, southern Brazil. Neotropical Ichthyology, 6: 211-222.
Wainwright, P. C. 1994. Functional morphology as a tool in ecological research. Pp. 42-59. In: Wainwright, P. C. & S. M. Reilly. (Eds.). Ecological morphology: integrative organismal biology. Chicago, University of Chicago Press.
Wainwright, P. C. 1999. Ecomorphology of prey capture in fishes. Pp. 375-387. In: Saksena, E. (Ed.). Advances in Ichthyological Research. Gwalior, Jiwaji University Press.
Watson, D. J. & E. K. Balon. 1984. Ecomorphological analysis of fish taxocenes in rainforest streams of northern Borneo. Journal of Fish Biology, 25: 371-384.
Webb, P. W., G. D. Laliberte& A. J. Schrank. 1996. Does body and fin form affect the maneuverability of fish traversing vertical and horizontal slits? Environmental Biology of Fishes, 46: 7-14.
Winemiller, K. O. 1991. Ecomorphological diversification in lowland freshwater fish assemblages from five biotic regions. Ecological Monographs, 61: 343-365.
Winemiller, K. O., L. C. Kelso-Winemiller & A. L. Brenkert. 1995. Ecomorphological diversification and convergence in fluvial cichlid fishes. Environmental Biology of Fishes, 44: 235-261.
Wootton, R. J. 1992. Ecology of teleost fishes. London, Chapman & Hall & and Fisheries Series, 404p.