ABSTRACT: In common bean (Phaseolus vulgaris) harvesting is carried out in the field. It is therefore necessary that cultivars be tolerant to viviparity, i.e., germination of grains still in the pods. Study of the percentage of germination of beans in the pods under laboratory conditions, where humidity content is high, has been proposed. Furthermore, under question is whether the thickness of the pod wall affects water uptake by the pods and, consequently, viviparity. Thus, the aim of the present study was to verify if there is variance among progenies for viviparity and if it is influenced by pod thickness. We assessed the parents, Pérola and ESAL 686, the F1, and a number of segregating generations in two crop seasons, in relation to the percentage of germination of seeds in the pods (PGSP) and pod wall thickness (PWT), and data on individual plants were obtained. The same traits were also assessed using the F2:3, F3:4 and F4:5 progenies. Taking into account the genetic and phenotypic parameters estimates, especially the level of high heritability, selection to less viviparity in common bean has to be carried out to evaluate PGSP in progenies.
Keywords: Phaseolus vulgaris, plant breeding, pre-harvest sprouting, genetic components, heri-tability
Genetic control of viviparity in common bean
Laís Andrade Pereira1*, Magno Antonio Patto Ramalho1, Ângela de Fátima Barbosa Abreu2, Scheila Roberta Guilherme1
1Federal University of Lavras − Biology Dept., Campus Universitário, C.P. 3037 − 37200-000 − Lavras, MG − Brazil.
2Embrapa Rice and Beans, Rod. GO-462, km 12, C.P. 179 − 75375-000 − Santo Antônio de Goiás, GO − Brazil. *Corresponding author <[email protected]>
Edited by: Martin Boer
Received February 25, 2015 Accepted July 31, 2016
Introduction
The cultivation of common bean (Phaseolus vulgar-is) in Brazil is highly diverse in terms of management sys-tems, especially at harvest. In the case of family farms, after harvesting, the plants are spread out up to the time of threshing in the field. At the other extreme, large cor-porate farms use mechanical harvesting and even where this is the case plants are often left in the field to dry or they are cut and threshed at the same time.
Under any of these management systems, if har-vesting coincides with a rainy period, which is frequent in various common bean crop seasons in Minas Gerais, especially if the plants are left in the field, germination of seeds may begin while still in the pods or the seeds may become spotted, which reduces their commercial value. To mitigate the damage arising from rainfall coin-ciding with harvesting, one of the alternatives is to use cultivars in which early germination of the seeds in the pods, a phenomenon known as viviparity, is as limited as possible. This phenomenon has already been inten-sively studied in other crop species, and the existence of certain genes involved in expression of the trait has been observed in crops such as maize (Neuffer et al., 1997; Suzuki et al., 2006) and wheat (Gubler et al., 2005; Tan et al., 2006; Zhang et al., 2014).
In the case of common bean, studies on this topic are few. Pryke (1978) observed variation in early ger-mination in a series of common bean crosses grown in a greenhouse. Lima et al. (2012) evaluated 95 com-mon bean lines related to tolerance to excess moisture at harvest time. They observed that the main difficulty in selection of common bean lines for tolerance to high moisture at harvest is repeatability of the environmental conditions in the field from one crop season to another. For this reason, the determination of percentage of
ger-mination of seeds in the pods (PGSP) has been proposed, and conducted under laboratory conditions, where mois-ture levels and temperamois-ture may be controlled. Ques-tions also arise as to whether pod wall thickness (PWT) affects water absorption by the pods and, consequently, the PGSP. No information was found on genetic control of pod wall thickness associated with viviparity. The only report on genetic control of this trait had another purpose, related to snap beans (Yuste-Lisbona et al., 2014).
This study was carried out for the purpose of ob-taining information on genetic control of PGSP and PWT, and on the possible association between them, as well as verifying if there is a difference in efficiency of selection if it is performed on individual plants or progenies.
Materials and Methods
The experiments were carried out in a greenhouse and in the field in an experimental area in the city of Lavras, located in the southern region of the state of Minas Gerais at an altitude of 918 meters, 21º58’ South latitude and 42º22’ West longitude.
The lines ESAL 686 and Pérola were used as par-ents. ESAL 686 has a determined growth habit, upright plant architecture, and large seeds of yellow color. It has an early cycle (approximately 65 days) and belongs to the Andean gene group, the Nova Granada race. It has pod walls of greater thickness.
The Pérola line, with carioca grains (cream colored with brown streaks) has an indeterminate growth habit, semi-upright plant architecture, and a 90-day cycle. It is of Mesoamerican origin and its pod wall is not so thick.
(F1 × P1), F1RC21 (F1 × P2), F2, F2RC11, F2RC21, and F3 generations.
The parents and the F1, F2, F1RC11, and F1RC21 gen-erations were evaluated in the field, with sowing in Feb 2013. In July 2013, in addition to the parents and the F1, F2, and F1 RC11 and F1RC21 generations, the F3 and F2RC11 and F2RC21 were also evaluated in the field. In both sea-sons a complete randomized block design with two rep-licates was used. The plants were harvested individually and dried in the sun.
Afterwards, the pods were removed. Part was used for measuring pod wall thickness (PWT), and the other part was used for evaluating the percentage of germina-tion of seeds while still in the pods (PGSP).
For the PWT measurement of PWT, three pods/ plant/plot were selected at random in both crop seasons. The seeds were removed and a valve of the pods was subjected to measurements of thickness by an external digital micrometer, DIGIMESS brand, code 110.284, 0-25 mm capacity, with a precision of ± 0.002 mm. Mea-surements were taken at the center of one of the valves of each pod.
The PGSP was obtained using two pods/plant/rep-lication. Two replications were evaluated. For this pur-pose, the pods were rolled up, two by two, in sheets of germination paper previously moistened with distilled water and identified with watercolor pencils. The rolls were kept in germinators at 25 °C with 12 h of light in the Seed Analysis Laboratory. The total number of seeds and germinated seeds were counted on the seventh day so as to obtain the PGSP. A germinated seed was consid-ered as one that exhibited radicle protrusion.
Data were subjected to analysis of variance. From the results of the analyses of variance, the accuracy es-timate (rgg') was obtained using the following expression:
rgg’= 1−(1F). In which F: Progenies mean square/ Residual mean square.
The mean values and the variances between plants per plot were obtained for all generations. Using these values, the Mather and Jinks (1982) methodology was followed. The joint scale test was applied as described by Rowe and Alexander (1980). The mean genetic param-eters were estimated using the weighted least squares method, according to the procedure presented. Consid-ering no epistasis and the generations P1, P2, F1, F2, F3, F1RC11, F1RC21, F2RC11, F2RC21:
ˆ ’ ( ’ )
β =
(
−)
− −C NS C1 1C NS Y1
in which: ˆ ˆ ˆ ˆ β = m a d
,
where, mˆ is the mean value; aˆrefers to the deviation of homozygotes for the average, additive effect and dˆ
represents the contribution of heterozygotes loci, the dominance effect.
C refers to the model matrix, in the present situa-tion becoming:
C=
−
−
1 1 0
1 1 0
1 0 1
1 0 0 5
1 0 0 25
1 0 5 0 5
1 0 5 0 5
1 . . . . . . . . . .
0 5 0 25
1 −0 5 0 25
NS−1 is the weighting matrix to reduce the variance heterogeneity between the different population; N is the diagonal populations number matrix, S the diagonal populations variance matrix, and Y the means of each population vector.
The components of phenotypic variance (VE, VA
and VD) were estimated by the iterative weighted least squares method (Mather and Jinks, 1984), adopting the following model:
ˆ ’ ( ’ )
β =
(
−)
− −QW Q1 1Q W Z1
ˆ ˆ ˆ ˆ β = V V V E A D ,
where VˆEis the environmental variance, VˆA represents
the additive variance estimate and VˆD is the dominance
variance estimate.
Q is the model matrix, that in the present situation becomes: Q=
1 0 0
1 0 0
1 0 1
1 1 1
1 1 2
1 2 1 5
1 1 5 0 75
. . .
W is the weight diagonal matrix derived from the variance of variance estimates (Mode and Robinson, 1959):
ˆ ( ˆ) ( )ˆ
Var V V
DF = + 2 2 2 ;
in which DF is the degree of freedom of each variance estimate, Z: populations variance vector.
Using the estimates of the components of variance, narrow sense heritability (hr
2) was obtained for all the traits, according to the estimator described by Bernardo (2010).
rXY COV XY
X Y
=
⋅
σ σ
in which:
COVXY is the covariance between the variable X
and Y, where X represents PWT and Y becomes PGSP; and sXand sY are the phenotypic deviations of the X and
Y variables, respectively.
The second step of the experiment consisted of an evaluation of the progenies. The same cross was used, and in this case, a sample of the plants harvested in the
F2, F3, and F4 generations was taken, thereby obtaining 32 F2:3, 29 F3:4, and 32 F4:5 progenies. These progenies and the following controls: RP1, Majestoso, Small White, and Radiante were evaluated in an experiment conduct-ed in Feb 2014, the complete randomizconduct-ed block with 2 replicates was implemented. The plants of each progenie or control were harvested at the point of maturity and dried in the sun, and the pods were removed.
To evaluate the progenies, the procedure for mea-suring the PWT was the same as had been adopted for individual plants. However, in this case, there was no separation of individuals. Three pods per plot/progeny were removed at random.
For the PGSP evaluation, 15 pods per plot were removed at random. Three replications per plot with five pods were made, i.e., six replications in all. The experi-mental procedure was similar to that described above, except that the rolls were kept in a mist chamber in the Department of Biology. Humidity and temperature were controlled by a thermo-hygrometer, “temperature and humidity datalogger”, model HT-500. The data were sub-jected to analysis of variance, considering a completely randomized design.
To estimate the broad sense heritability (h2) of the progenies from the analysis of variance, estimates of the mean squares of progenies (MSP) and mean square error (MSE) were used:
h MSP MSE
MSP
2= − .
The errors associated with the estimate of h2 were es-timated using the expression from Knapp et al. (1985):
LL MSP
MSE F DFERROR DFProgenies
= −
(
)
−
−
;
/
1 1 2
1
α
UL MSP
MSE F DFERROR DFProgenies
= −
(
)
−
; 1
2
1
α
LL: Lower limit, UL: Upperlimit; F: table values of F
distribution with DF (degrees of freedom) progenies and DF error, where α = 0.05.
The gain expected from selection (GS) was estimat-ed considering all the progenies, using the expression described by Bernardo (2010):
Gs = sd . h2
sd: selection differential; sd =selected progenies mean –
all progenies mean; h2: has already been described. Phenotypic correlation (rXY) was estimated be-tween the mean values of the progenies for PWT (X) and PGSP (Y), using the same estimator described above.
The correlated response RCY(X)in trait Y (PGSP) was estimated by selecting the best 10 % of progenies with the greatest PWT (X), in a way similar to the model proposed by Falconer and Mackay (1996):
RCY X( )=hY⋅sdY X( )’ 2
in which sdY X( )’ represents the selection differential of the progenies selected by the PWT, taking their PGSP as a reference.
sdY X( ) =MSY X()−MOY
All the statistical analyses were conducted using the R software (R Core Team, 2014).
Results and Discussion
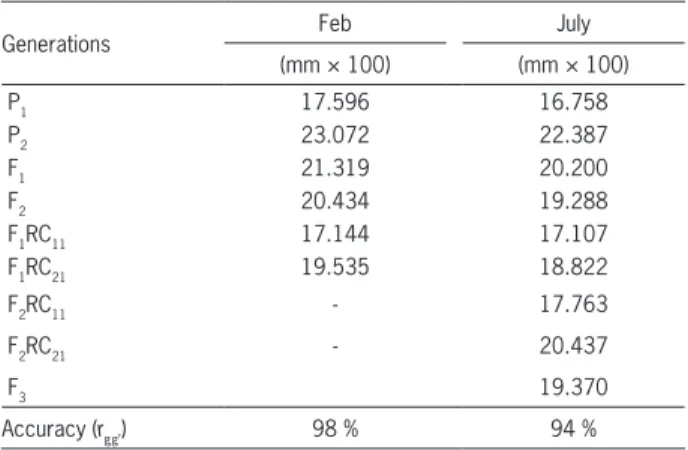
Observing the mean values obtained by the different generations, when individual plants were evaluated in reference to the PWT, it may be observed that the results were quite similar over the crop seasons (Table 1). The level of accuracy obtained in the experiments (rgg’= 98 %; 94 %) was high. The pod wall thickness of P1, “Pérola”, was always less than that of “ESAL 686”, P2. The mean value of the F1 generation was intermediate in the parents, and the F2 generation was similar to that of the F1. In principle, the absence of dominance in expression of the trait may be inferred from this condition.
The results of the PWT were quite consistent in the two crop seasons in regard to the magnitude of the esti-mates of the mean components (Table 2). The fit of the
Table 1 − Mean value of pod wall thickness (PWT) (mm × 100) obtained in the different populations evaluated. Sowing in Feb and July, 2013.
Generations Feb July
(mm × 100) (mm × 100)
P1 17.596 16.758
P2 23.072 22.387
F1 21.319 20.200
F2 20.434 19.288
F1RC11 17.144 17.107
F1RC21 19.535 18.822
F2RC11 - 17.763
F2RC21 - 20.437
F3 19.370
Accuracy (rgg’) 98 % 94 %
additive-dominant model was high, with estimates of R2 greater than 99 %. It was observed that the “d” compo-nent, which estimates the deviation of the heterozygote in relation to the mean, did not differ from zero. In other words, there is no dominance in the expression of the trait. The estimate of “a”, the contribution of the homo-zygotes in relation to the mean, was different from zero. The fact that the estimate was negative is a result of using a parent of less thickness as P1. In this case, in addition to d not being different from zero, allele frequency is 0.5 and, therefore, as only the a component differed from zero, the predominance of the additive effect in control of the trait may be inferred (Bernardo, 2010).
The predominance of the additive effects obtained may be confirmed from the estimates of the components of genetic additive variance ( A), which was different from zero, and this did not occur with the dominance variance (VD). The estimates of heritability (hr
2) for PWT were greater than 59 % (Table 2). This result is in agreement with estimates of heritability obtained for
Table 2 − Estimates of the mean and variance genetic components of the pod wall thickness (PWT) trait. Sowing in Feb and July, 2013.
Mean Genetic Component Feb July
Estimate Standard Deviation Estimate Standard Deviation
ˆ
m 19.5280 0.253 ** 19.225 0.1463 **
ˆ
a -2.4020 0.235 ** -2.603 0.1611**
ˆ
d 0.0058 0.487 -0.396 0.3570
1R2 (%) 100 100
Variance Component Feb July
Estimate Standard Deviation Estimate Standard Deviation
ˆ
VE 4.7045 0.800** 1.7890 0.4089**
ˆ
VA 6.8310 1.988* 5.1154 0.6464**
ˆ
VD -2.9355 1.6 1.7410 0.7921
1R²(%) 98 98
hr
2 79 59
1Coefficient of determination of the model; *estimate different from zero at the level of 7 % probability by the t test; **estimate different from zero at the level of 1 % probability by the t test.
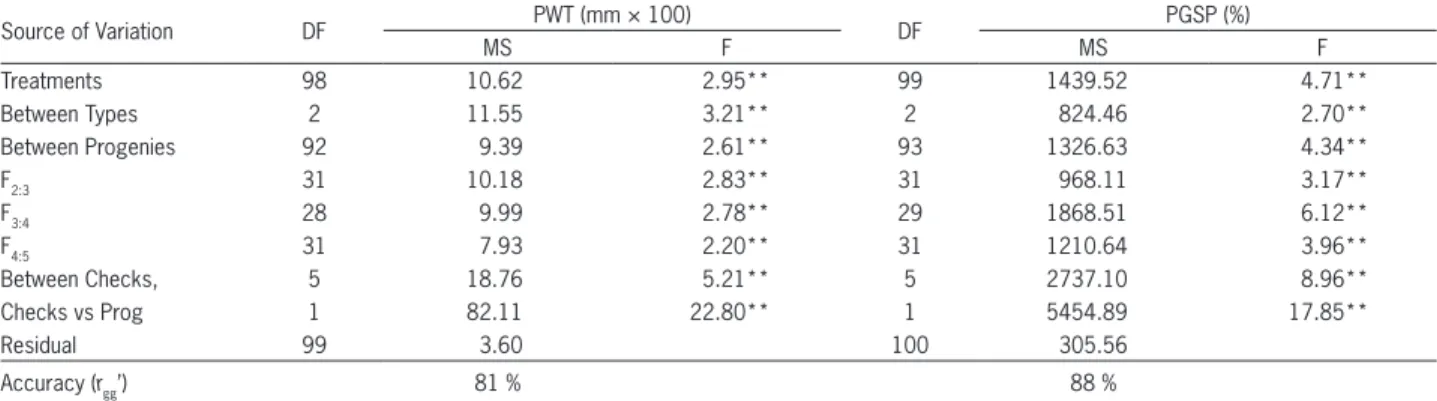
Table 3 − Variance analyses summary for pod wall thickness (PWT) (mm × 100) and percentage of germination of seeds in the pod (PGSP) from progenies and checks. Lavras, 2014.
Source of Variation DF PWT (mm × 100) DF PGSP (%)
MS F MS F
Treatments 98 10.62 2.95** 99 1439.52 4.71**
Between Types 2 11.55 3.21** 2 824.46 2.70**
Between Progenies 92 9.39 2.61** 93 1326.63 4.34**
F2:3 31 10.18 2.83** 31 968.11 3.17**
F3:4 28 9.99 2.78** 29 1868.51 6.12**
F4:5 31 7.93 2.20** 31 1210.64 3.96**
Between Checks, 5 18.76 5.21** 5 2737.10 8.96**
Checks vs Prog 1 82.11 22.80** 1 5454.89 17.85**
Residual 99 3.60 100 305.56
Accuracy (rgg’) 81 % 88 %
**estimate different from zero at the level of 1 % probability by the t test.
certain traits of snap beans for another purpose, among them thickness, the estimate of which, h2 was greater than 50 % (Yuste-Lisbona et al., 2014).
Using progenies, the evaluations of PWT showed results which coincided well with those obtained from individual plants. Accuracy was high, greater than 80 %, indicating good precision in the evaluation. For the trait in question, both the evaluation of individual plants and the evaluation of progenies allow for estimates of genetic and phenotypic parameters with good precision (Table 3).
The h2 when considering all the progenies, was high, 62 %, similar to the h2 when considering each type of progeny. This being the case, the better option is to select regardless of progeny type. The genetic gain was expressive for both traits (Table 4).
pass, germination is nearly total and would not discrimi-nate the genotypes. It should be noted that in the germina-tor and/or mist chamber, humidity is more expressive than under field conditions. That is because even when the har-vest coincides with rainfall, high humidity is almost never continuous, as occurs in the laboratory. On consulting the Regulations for Seed Analysis (Regras para Análise de Se-mentes - RAS) (MAPA, 2009), the first germination scoring for common bean (Phaseolus vulgaris) is indicated after five days in the germinator at 25 °C, and the final scoring af-ter nine days. Thus, the choice was made to evaluate the percentage of germination on the seventh day when the test was conducted in germinators at 25 °C, and individual plants were evaluated. When progenies were evaluated in a mist chamber with a mean temperature of 20 °C and 98 % relative humidity, there was monitoring through control. Thus, every day a roll containing a control was opened and the percentage of germination was verified. Adopting this strategy, it may be concluded that, in this case, scoring ger-mination would be made on the sixth day. The strategy adopted was efficient, i.e., there was discrimination of the progenies with a high degree of accuracy (Table 3).
Differences were also observed between the popu-lations (p ≤ 0.01) for PGSP (Table 5). As expected, the
variance in the segregating populations was greater than
that of the parents. It was observed that the seeds still in the pods of the plants showed wide variation in the percentage of germination, ranging from 0 to 100 %, but with greater concentration in the class of higher percent-ages. The mean values of the F1 generations in the two periods of evaluation were less than those of the parents and of the F2 generation. In principle, this result, in con-trast with what occurred with thickness, indicates the occurrence of dominance. The estimate of heterosis of the F1 generation, in relation to the mean value of the parents, was -75 % in the sowing conducted in Feb 2013, and -37 % in the other period of evaluation (Table 5). It should be noted that the mean percentage of germina-tion of the parent with lower pod thickness, Pérola (P1), was greater than that observed for the line ESAL 686 (P2) with greater pod thickness.
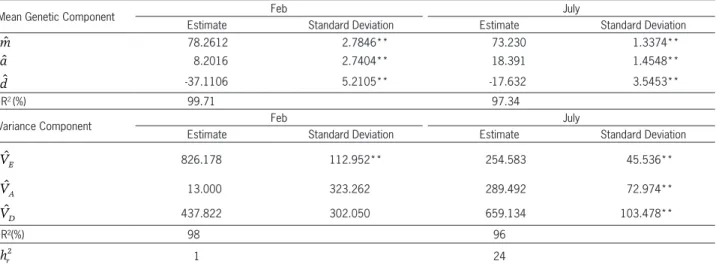
In the evaluations of individual plants for the PGSP, the additive-dominant model, as had occurred for the PWT, explained a large part of the variation (R2 greater than 97 %) (Table 6). In this case, considering one locus, a
is the deviation of homozygotes for the mean. When p =
q =1/2 a corresponds to an additive effect and dˆ is the deviation of the heterozygote in relation to the mean, the dominance effect. Both components were different from zero. As the estimate of d was negative, it may be inferred that the dominance was in the direction of reducing expression of the trait. In the first period of evaluation, only the component of environmental variance (VE) was different from zero, a fact that may be explained by the large magnitude of associated errors. In the second period, there was greater consistency with the results of the mean components, and in this case, both VA and VD differed from zero. For this trait, the estimate of heritability (h2) for the first period of evaluation was very low (h2 = 1 %), but in the second period, the estimate was higher (h2 = 24 %). It may be inferred that the evaluation of this trait from the pods of individual plants shows low precision (Table 6).
The use of progenies proved to be more efficient than the use of individual plants in the PGSP evaluation, with heritability greater than 75 %. One of the reasons is that, in this case, more pods were available and it was possible to use five pods per plot with three replications. In a similar study involving 95 common bean lines, with the use of ten pods per plot, the accuracy of the percent-age of germination of seeds while still in the pods was similar to that obtained in the present study, i.e., 62 % (Lima et al., 2012).
The gain expected from selection involving all the progenies and selecting the 10 % with the lowest PGSP was -61 % (Table 4). One of the objectives of this study was to verify which of the two traits evaluated would allow for greater efficiency in selection. The estimate of correlation between PWT and PGSP was practically zero when indi-vidual plants were used; however, when the averages of the progenies was used, the estimate of correlation was negative and different from zero (r = -0.5**). Based on this last result, it may be inferred that the greater the pod wall thickness, the lower the germination.
Table 5 − Mean value of the percentage of germination of seeds in the pods (PGSP) obtained for the different populations evaluated. Sowing in Feb and July, 2013.
Generations DF Feb DF July
Mean % Mean %
P1 25 88.325 43 96.519
P2 29 71.983 19 67.932
F1 53 45.825 60 59.956
F2 188 60.487 229 69.056
F1RC11 95 57.561 137 75.855
F1RC21 90 53.382 123 59.670
F2RC11 - - 217 62.589
F2RC21 - - 317 63.487
F3 - - 610 62.689
Accuracy (rgg’) 91 % 93 %
Heterosis -75 % -37 %
P1: Pérola; P2: ESAL 686.
Table 4 − Estimates of gain expected from selection (GS) and correlated response (CRY(X)) obtained for the traits of pod wall thickness (PWT) and percentage of germination of seeds while still in the pods (PGSP). Lavras, 2014.
Indices evaluated Trait under selection
PWT (mm × 100) PGSP (%) CR(PWT)(PGSP) Mean of the progenies (Mo) 16.25 26.19 26.19
Mean selected 20.23 5.61 12.69
h2 62 % 77 %
-GS 2.47 -15.85 -10.40
GS% 15 -61 -40*
Finally, considering that in the two methodologies there is similar difficulty of evaluation, use of the germination in the pod test, in principle, proved to be more promising. Unfortunately, there is difficulty in showing that this trait reflects tolerance to high moisture under field conditions, above all, due to the lower experimental precision in the evaluations under field conditions. This fact contributed so that the correlated response by selection in PWT and expected gain in PGSP was less than that directly seen in the trait, though still expressive (Table 4).
Viviparity in common bean has been little stud-ied, and in the studies already undertaken, the em-phasis was on identification of the variation between lines for the trait (Yuste-Lisbona, 2014). In the corn crop, studies are more numerous, and different genes involved in expression of viviparity have been identi-fied. These genes act in different manners, above all by production of the hormone abscisic acid (ABA) (Mc-Carty, 1991; Neuffer et al., 1997; Suzuki et al., 2006). In wheat, there is growing concern about early seed germination, because early germination also brings about expressive economic losses. It is known that for this crop, the main resistance to viviparity is associated with overcoming seed dormancy. However, in spite of the various studies published, information in relation to genetic control is still in the early stages (Flintham, 2000; Groos et al., 2002; Li et al., 2004; Gubler et al., 2005; Tan et al., 2006; Rikiishi and Maekawa, 2010; Lan et al., 2012; Zhang et al., 2014).
Conclusions
Taking into account the genetic and phenotypic parameters estimates, especially the high heritability, selection for less viviparity in common bean has to be done evaluating the PGSP in progenies.
Table 6 − Estimates of the mean and variance components of the trait, percentage of germination of seeds while still in the pods (PGSP). Sowing in Feb and July, 2013.
Mean Genetic Component Feb July
Estimate Standard Deviation Estimate Standard Deviation
ˆ
m 78.2612 2.7846** 73.230 1.3374**
ˆ
a 8.2016 2.7404** 18.391 1.4548**
ˆ
d -37.1106 5.2105** -17.632 3.5453**
1R2 (%) 99.71 97.34
Variance Component Feb July
Estimate Standard Deviation Estimate Standard Deviation
ˆ
VE 826.178 112.952** 254.583 45.536**
ˆ
VA 13.000 323.262 289.492 72.974**
ˆ
VD 437.822 302.050 659.134 103.478**
1R²(%) 98 96
hr
2 1 24
1Coefficient of determination of the model; **estimate different from zero at the level of 1 % probability by the t test.
Acknowledgements
To the Coordination for the Improvement of High-er Level PHigh-ersonnel (CAPES), and the Brazilian National Council for Scientific and Technological Development (CNPq) for granting the scholarship; to the Minas Gerais State Foundation for Research Support (FAPEMIG) finan-cial support for the realization of the research Project.
References
Bernardo, R. 2010. Breeding for Quantitative Traits in Plants. 2ed. Stemma Press, Woodbury, MN, USA.
Falconer, D.S.; Mackay, T.F.C. 1996. Introduction to Quantitative Genetics. 4ed. Pearson, England, UK.
Flintham, J.E. 2000. Different genetic components control coat-imposed and embryo-coat-imposed dormancy in wheat. Seed Science Research 10: 43-50.
Groos, C.; Gay, G.; Perretant, M.R.; Gervais, L.; Bernard, M.; Dedryver, F.; Charmet, G. 2002. Study of the relationship between pre-harvest sprouting and grain color by quantitative trait loci analysis in a white X red grain bread- wheat cross. Theoretical and Applied Genetics 104: 39-47.
Gubler, F.; Millar, A.A.; Jacobsen, J.V. 2005. Dormancy release, ABA and pre- harvest sprouting. Current Opinion in Plant Biology 8: 183-187.
Knapp, S.J.; Stroup, W.W.; Ross, W.M. 1985. Exact confidence intervals for heritability on a progeny mean basis. Crop Science 25: 192-194. Lan, X.J.; Wang, J.R.; Wei, Y.M.; Chen, G.Y.; Jiang, Q.T.; Peng, Y.Y.;
Dai, S.F.; Zheng, Y.L. 2012. Identification of seed dormancy on chromosome 2BS from wheat cv. African Journal of Agricultural Research 7: 6191-6196.
Lima, K.L.; Ramalho, M.A.P.; Abreu, A.F.B. 2012. Selection of common bean inbred lines with tolerance to high moisture at harvest. Ciência e Agrotecnologia 37: 152-158.
McCarty, D.R.; Hattori, T.; Carson, C.B.; Vasil, V.; Lazar, M.; Vasil, I.K. 1991. The viviparous I developmental gene of maize encodes a novel transcriptional activator. Cell 66: 895-905. Ministério da Agricultura, Pecuária e Abastecimento [MAPA].
2009. Rules for Seedtesting = Regras para Análise de Sementes. MAPA, Brasília, DF, Brazil (in Portuguese).
Neuffer, G.N.; Coe, E.H.; Wessler, S.R. 1997. Mutants of Maize. Cold Spring Harbor Laboratory, New York, NY, USA.
Pryke, P.I. 1978. The genetic base of vivipary in phaseolus vulgaris. Annual Report of the Bean Improvement Cooperative 21: 40-41.
Rikiishi, K.; Maekawa, M. 2010. Characterization of a novel wheat (Triticumaestivum L.) mutant with reduced seed dormancy. Journal of Cereal Science 51: 292-298.
Suzuki, M.; Settles, A.M.; Tseung, C.H.; Li, Q.B.; Latshaw, S.; Wu, S.; Porch, T.G.; Schmelz, E.A.; James, M.G.; McCarty, D.R. 2006. The maize viviparous 15 locus encodes the molybdopterin synthase small subunit. The Plant Journal 45: 264-274. Tan, M.K.; Sharp, P.J.; Lu, M.Q.; Howes, N. 2006. Genetics of
grain dormancy in a white wheat. Australian Journal of Agricultural Research 57: 1157-1165.
Yuste-Lisbona, F.J.; Gonzalez, A.M.; Capel, C.; Garcia-Alcazar, M.; Capel, J.; Ron, A.M.D.; Santalla, M.; Lozano, R. 2014. Genetic variation underlying pod size and color traits of common bean depends on quantitative trait loci with epistatic effects. Molecular Breeding 33: 939-952.