The Social side of fertility in Portugal and Spain
– evidence from the European Social Survey (Round 2)Mendes, Maria Filomena
Universidade de Évora, Departamento de Sociologia Largo dos Colegiais, 2
7000 – 803 Évora, Portugal Tel. 351266740805
E- mail:[email protected]
Santos, José Rebelo dos
Escola Superior de Ciências Empresariais do Instituto Politécnico de Setúbal, Departamento de Comportamento Organizacional e Gestão de Recursos Humanos Campus do IPS, Estefanilha,
2914-503 Setúbal, Portugal, Tel. 351265790406
E- mail:[email protected]
1. Introduction and motivation
Recently, Portugal and Spain had experienced, as all the others Southern European Countries, the lowest-low period fertility levels (Kohler, Billari and Ortega, 2002). This paper considers the levels and trends of fertility in those countries in the last decades (since 1975 till 2000) and the different characteristics of their young populations that could contribute for the future childbearing tendency. The explanation of fertility decision is usually connected with the behaviour of a set of variables which includes a person’s educational level, his/her participation in the labour market and his/her marital status (Engelhardt and Prskawetz, 2004; Billari, 2004). The childbearing decision may also vary with the sex, the age. Besides, it is also assumed that the fertility decision may be related with social and psychological variables (Mendes, 1992). It is very difficult to find those variables that permit to identify the values which are relevant to define some specific fertility behaviour. We believe that belonging to a particular religion, not to be born in the country, to inhabit in a big city or in its surrounds, to vote, the positioning in the left right political scale, to give importance to the family in a person’s life, could be considered as variables that could characterise different values and attitudes. The planning of childbearing concerning the next three years following the inquiries date was questioned in the European Social Survey (Round 2). Using those data we used a multivariate model to analyse, in an exploratory way, which characteristics of the southern Europeans (particularly Spanish and Portuguese) are more relevant for deciding to be parents?
Fertility Curve (1980)
0 0,1 0,2 0,3 0,4 0,5 0,6 0,7 0,8 0,9 1
15-19 20-24 25-29 30-34 35-39 40-44
Ages
T
F
R
i
Greece Spain Italy Portugal
Figure 1 - Total Fertility Rates, by group of ages, in 1980
Fertility Curve ( 2000)
0 0,1 0,2 0,3 0,4 0,5 0,6 0,7 0,8 0,9 1
15-19 20-24 25-29 30-34 35-39 40-44
Ages
T
F
R
i
Greece
Spain Italy
Portugal
Figure 2 - Total Fertility Rates, by group of ages, in 2000
It is visible the difference in the design of the curves, as in what concerns the periods of time (1980 and 2000), as in what refers to the countries themselves. In the last period, Portugal and Spain shows a total different behaviour of the fertility rates by group of ages, namely in the chose of those which concentrated the highest number of births. Besides, in the most recent years the period fertility rate, in Spain, experienced a slight increase while the Portuguese one decreased continuously. The paper intents to give an answer to the following question: What are the main characteristics that differentiate the people who plan to have a child in the next three years, in Southern Europe?
The rest of the paper has the following structure: section 2 presents the data and the methodology; section 3, the results; section 4, concludes.
We use the European Social Survey (Round 2 – 2004/2005) data1 . The survey had been carried
out between the final of 2004 and the beginning of 2005 (exception for Italy, 2006). The sample includes 1511 Portuguese, 1729 Spanish, 2566 Greeks and 1207 Italians. We use a multivariate model for analyses of qualitative data (HOMALS) to estimate the optimal quantifications for the parameters and to analyse the associations between the multiple variables (Carvalho, 2004). The description of the variables used is presented in Table 1.
Table 1 – Variables used in the analyses
Observations 4120
Fit 0,200396
Dim. 1 Dim. 2 Eingenvalues
por Dimensões 0,111 0,089
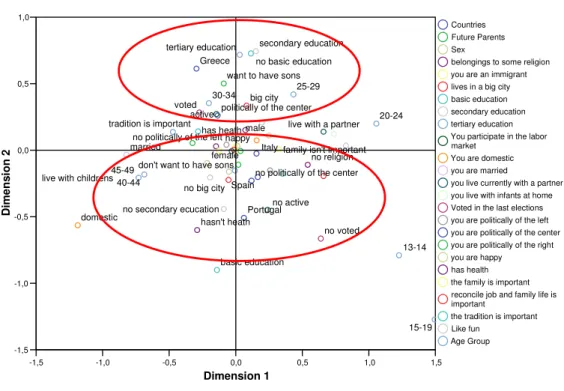
The results of the homogeneity analyses evidence, in the dimension 1, the age group, “to do the housework”, “to be married”, “to live with children in the household” and “to have voted in the last national election” (Figure 2)
-1,5 -1,0 -0,5 0,0 0,5 1,0 1,5
Dimension 1 -1,5 -1,0 -0,5 0,0 0,5 1,0 D im e n s io n 2 Spain Greece Italy Portugal want to have sons
don't want to have sons male
female no religion
big city
no big city
basic education no basic education
secondary education
no secondary ecucation tertiary education
active
no active domestic
married
live with a partner
live with childrens
voted
no voted no politically of the left
politically of the center
no politically of the center happy
has heath
hasn't heath
family isn't important tradition is important
13-14 15-19 20-24 25-29 30-34 40-44 45-49 Countries Future Parents Sex
belongings to some religion you are an immigrant lives in a big city basic education secondary education tertiary education You participate in the labor market
You are domestic you are married
you live currently with a partner you live with infants at home Voted in the last elections you are politically of the left you are politically of the center you are politically of the right you are happy
has health the family is important reconcile job and family life is important
the tradition is important Like fun
Age Group
Quantifications
Figure 3 - Homals
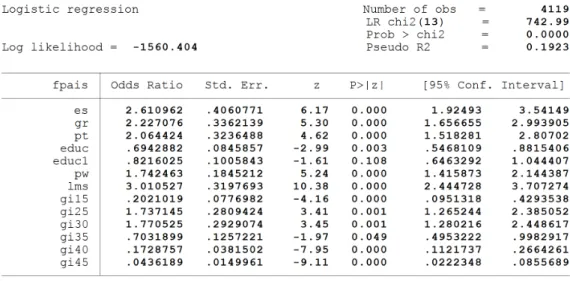
After this exploratory treatment of the data we used a logit model to evaluate the differences in the probability of planning proximate fertility in a positive way. We find that the majority of the model variables influence significantly the plan of childbearing (variable fpais), specially the educational level (educ and educ1), the participation in the labour market (pw) and the marital status (lms). See Table 3.
1 We use data from the European Social Survey (Round 2), 2004/2005, available in
Table 3 – Logit model
3. Results
For the same level of education and for each type of labour market participation, the planning of childbearing has higher probabilities inside the 25-29 and 30-34 years old group ages. Spanish young people always showed higher probabilities of being parents than the Portuguese ones for all the fertile ages. The marital status still is a key variable explaining the fertility decision. Concerning the human values, religion belonging, placement on left right political scale and the importance of the family in a person’s life did not significantly influence the childbearing decision. So, we can expect that the fertility rates in Spain will maintain higher values than the Portuguese ones, in the next future.
REFERENCES
Billari, F. (2004). Becoming an Adult in Europe: a Macro (/Micro)- Demographic Perspective.
Demographic Research, Special Collection 3, Article 2, April 2004, Max Planck Institute for
Demographic Research, Rostock, www.demographic-research.org;
Carvalho, H. (2004). Análise Multivariada de dados Qualitativos, utilização da HOMALS com
o SPSS, Lisboa, Edições Sílabo.
Engelhardt, H. &. Prskawetz, A. (2004).On the Changing Correlation Between Fertility and
Female Employment over Space and Time. European Journal of Population, 20, pp. 35-62.
Kohler, H., Billari, F. & Ortega, J. A. (2002). The emergency of lowest-low fertility in Europe during the 1990s. Population and Development Review, 28 (4): 641-680.
Mendes, M. (1992). Análise sociodemográfica do declínio da fecundidade da população
portuguesa na década de 90. Universidade de Évora.
Powers, D. & Xie, Y. (2000). Statistical Methods for Categorical Analyses. Academic Press.