THE IMPACT OF QUESTIONS ROTATION
IN RESPONSE ACCURACY
Inês Baptista da Silva
2
The impact of questions rotation in response accuracy
Inês B. Silva Pedro S. Coelho
Universidade Nova de Lisboa(New University of Lisbon)
In market research, with regard to measuring customer satisfaction, it is necessary to translate clearly and concisely the respondent's perception in which concerns the different questions under consideration. Therefore, problems relating to the questions presented in questionnaires are quite frequent, both regarding to the characteristics of the question itself, like the type of scale to be used or the number of scale items, and the position of the question in the questionnaire like sequence of the questions or grouping questions.
The main goal of studying the items rotation in the questionnaire is to understand behaviors that can reduce the response accuracy.
In this study, it was used the effect of rotating questions in a questionnaire with view to conclude how this can or cannot influence the answers of the respondents. To perform this analysis it was used the survey “ECSI-Index National Customer Satisfaction” (area of telecommunications), which was divided into two blocks to check for differences in responses depending on the question’s rotation in the questionnaire.
We conclude that there are no significant differences between the responses given in both circumstances: with item rotation and without rotation.
Introduction
In market research, with regard to measuring customer satisfaction, it is necessary to translate clearly and concisely the respondent's perception in which concerns the different questions under consideration. Therefore, the questionnaire design is really interesting to studying as it allows
understanding how it is possible to obtain response accuracy.
Many authors developed studies about the questionnaires designs both in terms of the number of scale items or type of scale, and the position of the questions in questionnaires or grouping questions. According to Lietz (2010) the evidence on research into question design suggests that questions should be constructed to be as clear, simple, specific and relevant for the study’s research aims as possible.
3
The structure of this paper initiates with an introduction where the problem and the main goals of the study are presented. In the next section, the effects of sequence of questions in surveys are explained and the previous works about this subject are analyzed. In the description of the study it is made a summary explanation about ECSI and its subjacent model and are exposed the steps of this study, explaining the data collection and respective analysis. The next section presents and explains the main results obtained, being divided in two sub-sections: descriptive analysis and validity assessment. The last section discusses these results and presents the conclusions.
The problem of order question in questionnaires
To reduce the problems about response accuracy, first of all, it is necessary to consider the questionnaire design. Over time, researchers have been aware of the importance of questionnaire and interview schedule design on the quality and quantity of response (Perreault Jr, 1975).
Including in the questionnaire design analysis, the study of order questions was developed by some authors.
Schwarz, Strack, & Mai (1991) studied this subject by asking to respondents about their marital satisfaction and their general life satisfaction. When the question about life satisfaction is preceded by the question about marital satisfaction, the second response is affected by the previous one, because the respondents associate quickly the life satisfaction to the marital satisfaction. Other studies developed by Simmons, Bickart, & Lynch Jr (1993) and Crespi & Morris (1984) show that when was asked specific questions about the strength of election candidates before the general voting intentions, the respondents associate the general voting intention to the previous specific questions. In more technical terms, order effects were expressed as differences in averages and correlations for specific and general questions and results from changes in the placement of the questions in the survey (W. DeMoranville & C. Bienstock, 2003).
According to these studies it is possible to conclude that the question order is important to determine the response accuracy, because question responses tend to be constructed and they are susceptible to contaminating influences (Peterson, 2005). This influence increases as less cognitive sophistication the respondents has, sincerespondents with less formal education and more limited vocabularies are more influenced by manipulation (Krosnick & Alwin, 1987).
4
Other type of order effects was also analyzed by Dickinson & Kirzner (1985) who studied the order effects within groups of questions. They conclude that the questions that appear early within their respective groups, as well as the questions that appear early in the questionnaire, are more likely to be answered. These situations are so more frequent as longer and tiring is the study (Welch & Swift, 1992). In their study these authors analyze the influence of order position in case of product taste trials and they verified that the first trial serves as a frame of reference against which subsequent trials are compared.
The survey method is also an influence to order effects. Couper, Traugott, & Lamias (2001) developed a study about order question in web surveys and they verify that when respondents can see the entire survey before answering a single question, the order effect is minimized. Furthermore, in case of telephone interviews, substantively related questions affect responses to the target question only when asked firstly (Schwarz & Hippler, 1995).
In face of the above, it appears as very important to have a special attention to the effects produced by the order of the concerned items within the questionnaire and even by the order of the questions within each group. This procedure must be considered, not only when we analyze the results of a questionnaire in function of the several answers given, but also when we are taking charge of designing such a document or preparing an interview for inquiry purposes.
A study of these important effects is the main objective of the present work, as well as the interpretation and understanding of differences found, in order to enabling to establish a consolidated and reliable conclusion.
Description of the study
The ECSI model
The European Customer Satisfaction Index (ECSI) is a system used to measuring customer satisfaction created in 1999 that studies different sectors as for example banking, insurance and telecommunications and, in Portugal, it was developed by a consortium constituted by APQ – Associação Portuguesa para a Qualidade, IPQ – Instituto Português da Qualidade and ISEGI – Instituto Superior de Estatística e Gestão de Informação da Universidade Nova de Lisboa (Vilares, Coelho, & Magalhães, 2009). This Index is adapted from the ACSI (American Customer Satisfaction Index) (Fornell, Johnson, Anderson, Jaesung, & Bryant, 1996) and from the Swedish Costumer Satisfaction Index, known as CSB (Customer Satisfaction Barometer) (Fornell, 1992). Contrarily to the traditional methodology, the methodology adopted in ESCI is not limited to conducting a market study to clients of the companies or organizations in the sectors under study, since it also includes the estimation of a model to explain customer satisfaction (Vilares et al., 2009).
5 The measurement model relates latent variables to the manifest variables and identifies these last in the survey questions, as shown in Table 1.
Figure 1 ECSI structural model
Table 1 Indicators of each latent variable
Latent Variable Indicators
Image
Q4A: It is a reliable operator Q4B: It is well established
Q4C: It gives a positive contribution to society Q4D: It is concerned about its customers Q4E: It is innovative and forward looking
Expectations
Q5A: Expectations concerning overall quality
Q5B: Expectations concerning the fulfillment of personal needs
Q5C: Expectations concerning reliability
Perceived quality
Q6: Perceived overall quality
Q7A: Technical quality of the network Q7B: Personal attention
Q7C: Quality of services provided Q7D: Diversity of products and services Q7E: Product reliability
Q7F: Quality of information provided Q7G: Coverage of the network
Perceived value Q10: Evaluation of price given quality Q11: Evaluation of quality given price
Satisfaction
Q3: Overall satisfaction Q9: Fulfillment of expectations Q18: Distance to the ideal company
Loyalty Q12: Intention of remaining as a customer Q17: Recommendation to colleagues and friends
6 To estimate this model it was used PLS (Partial Least Squares), using two data sets, as explained in the next section. PLS is an iterative procedure for estimating causal models, which does not impose distributional assumptions on the data, and accommodates continuous as well as categorical variables (Fornell et al., 1996) and has been the standard estimation method in the context of the ECSI and in the American Customer Satisfaction Index (ACSI) (P. S. Coelho & Henseler, 2011). All data analyses were done using SmartPLS (Ringle, Christian Marc/Wende, Sven/Will, & Alexander, 2005).
Data
Data proceed from ECSI – Portugal 2010 study for the mobile telecommunications industry and was collected between November and December 2010 through telephone interviews supported by a CATI system and following the criteria defined in ECSI.
To select the respondents for the survey it was used a random-digit dialing where in each household one resident is randomly selected and qualified as a member of the target population. The respondents were divided in two samples and for one sample it was used the questionnaire with items rotation in question 4; for the other sample it was used the same questionnaire but without items rotation.
The questionnaire includes a set of socio-demographic questions and a set of questions regarding the six constructs of a structural satisfaction model (image, expectation, perceived quality, perceived value, satisfaction and loyalty). For the sample with items rotation there are 374 records and for the sample without item rotation there are 373 records.
Results
Descriptive analysis
Table 2 shows the non-response rate for the five paragraphs of question 4 with rotation and without rotation. We can see that generally in the sample without item rotation there are a higher proportion of non-responses when compared with the sample with item rotation.
When we formally test the difference between the proportion of non-responses in the samples with and without rotation using the hypothesis
H0: pi, with rotation = pi, without rotation H1: pi, with rotation≠ pi, without rotation
7 Table 2 Non-response rate of Question 4
With Rotation Without Rotation % Non
-Responses
% Non -Responses
Question 4A 0,000% 1,340%
Question 4B 0,000% 0,804%
Question 4C 5,615% 4,290%
Question 4D 1,872% 2,949%
Question 4E 2,139% 2,413%
Regarding to mean values in question 4, presented in Table 3, results show that the differences are not significative except in paragraph E where the mean value without rotation is bigger than with rotation in approximately one point.
When we formally test the difference of mean values using the hypothesis H0: µi, with rotation = µi, without rotation
H1: µi, with rotation≠ µi, without rotation
being µi, with rotation the mean values of responses for variable i when the items rotation is applied and being µi, without rotation the mean values of responses for variable i when the items rotation is not applied, the null hypothesis is only rejected in question 4E, at a 5% significance level.
Despite the difference of mean values in question 4E, we can not conclude that in general these mean values are significatively different in the two samples.
Table 3 Mean Values of Question 4
With Rotation Without Rotation
Difference Mean Value Mean Value
Question 4A 7,97 7,83 -0,14
Question 4B 8,5 8,53 0,03
Question 4C 7,61 7,5 -0,11
Question 4D 7,32 7,5 0,18
Question 4E 8,17 9 0,83
Table 4 shows the correlations between items in Question 4. In samples with and without rotation correlations are tendency higher between the last three paragraphs of the question.
8 Table 4 Correlations between items in Question 4
With Rotation Without Rotation Correlation Correlation
4A & 4B 0,4216 0,5904
4A & 4C 0,4833 0,4905
4A & 4D 0,6295 0,5427
4A & 4E 0,4562 0,4880
4B & 4C 0,4718 0,4321
4B & 4D 0,3714 0,3847
4B & 4E 0,5001 0,5128
4C & 4D 0,5884 0,5770
4C & 4E 0,5838 0,5317
4D & 4E 0,6066 0,6249
In Figure 2 it can be analyzed the response rate to question 4. The scale of response has 10 points and in these graphics they are grouped for a better analysis. Looking at the responses in the five paragraphs it is clear that the points 7, 8, 9 and 10 of scale have higher response rates. The highest response rate occurs in question 4B in points 9 and 10 (0,53 with rotation and 0,54 without rotation). The lowest response rates occur always in the first four point of the scale.
When we formally test the adjustment of the two samples using the hypotheses
H0: Variable i has the same distribution in the two groups H1: Variable i has not the same distribution in the two groups
being the two groups the samples with items rotation and without rotation, the null hypothesis is rejected for all variables, at a 5% significance level.
9 Figure 2 Graphics of response rate in Question 4
Validity assessment
According to Gadotti, Vieira, & Magee (2006) the quality of a measurement is frequently understood by different criteria as reliability, validity and responsiveness.
Considering the existence of two subcategories or subtypes of construct validity (convergent and discriminant), it is important to recognize that they have to work together. If only one of those subcategories is verified, this is not enough to establish construct validity (Trochim, 2006).
This construct validity is very important to perceive the different types of measurement error, as errors in measures can produce degrading reliability (Trochim, 2006).
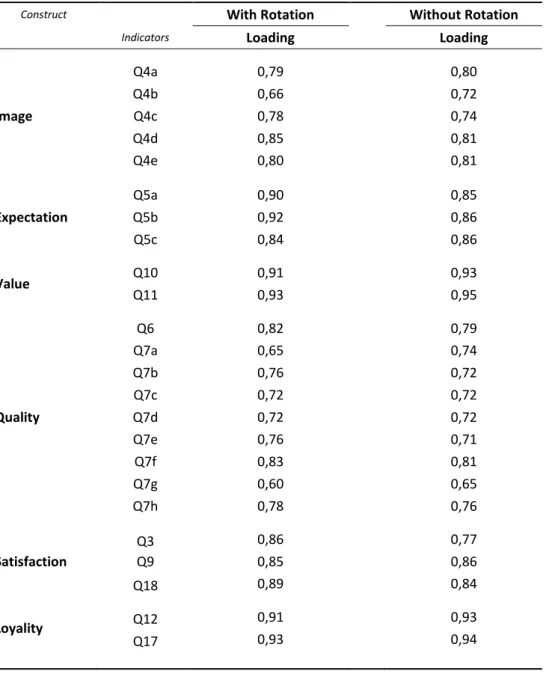
10 items rotation we verify that they are similar and that there is no pattern for each one of the groups in particular.
Table 5 Standardized loadings of manifest variables
Construct With Rotation Without Rotation
Indicators Loading Loading
Image
Q4a 0,79 0,80
Q4b 0,66 0,72
Q4c 0,78 0,74
Q4d 0,85 0,81
Q4e 0,80 0,81
Expectation
Q5a 0,90 0,85
Q5b 0,92 0,86
Q5c 0,84 0,86
Value Q10 0,91 0,93
Q11 0,93 0,95
Quality
Q6 0,82 0,79
Q7a 0,65 0,74
Q7b 0,76 0,72
Q7c 0,72 0,72
Q7d 0,72 0,72
Q7e 0,76 0,71
Q7f 0,83 0,81
Q7g 0,60 0,65
Q7h 0,78 0,76
Satisfaction
Q3 0,86 0,77
Q9 0,85 0,86
Q18 0,89 0,84
Loyality Q12 0,91 0,93
Q17 0,93 0,94
11 we cannot conclude that it depends on the items rotation, because there are no differences between the two samples.
Table 6 Reliability and validity measures
Latent Variables
With Rotation Without Rotation
Cronbach’s Alpha Composite Reliability Average Variance Extracted Cronbach’s Alpha Composite Reliability Average Variance Extracted
Image 0,835299 0,88284 0,602732 0,837371 0,884411 0,605382
Expectation 0,860195 0,914925 0,782143 0,821856 0,893817 0,737256
Value 0,819278 0,917047 0,846807 0,869578 0,938577 0,884268
Quality 0,89594 0,915773 0,549406 0,894236 0,914208 0,543074
Satisfaction 0,835861 0,901144 0,752472 0,763382 0,863808 0,6793
Loyality 0,809723 0,912922 0,839807 0,85206 0,931003 0,870918
The discriminant validity is the degree to which the absolute value of the correlation between the two constructs differs from one (Reichardt & Coleman, 1995). To analyze discriminant validity we compare the square root of the AVE for each construct with the correlations with all other constructs in the model, as shown in table 7. Except for variable quality, the square roots of Average Variance Extracted (values in bold) are always higher than the absolute correlations between constructs. When compared the samples with item rotation and without item rotation, values are similar. So, it is possible to conclude that all the constructs except quality show evidence for acceptable validity, but this discriminant validity does not depend on items rotation.
Table 7 Correlations between latent variables and square roots of average variance extracted
With Rotation Without Rotation
E xp e ctat io n Im ag e Loyal ity Qu al ity S atis fact io n Val u e Exp e ctat io n Im ag e Loyal ity Qu al ity S atis fact io n Val u e
Expectation 0,88 0,86
Image 0,78 0,78 0,75 0,78
Loyality 0,66 0,6 0,92 0,59 0,59 0,93
Quality 0,84 0,76 0,64 0,74 0,82 0,76 0,66 0,74
Satisfaction 0,79 0,71 0,76 0,8 0,87 0,75 0,73 0,76 0,79 0,82 Value 0,64 0,59 0,52 0,67 0,66 0,92 0,53 0,51 0,58 0,65 0,67 0,94
12 and 0,68 in case without items rotation) and for customer satisfaction (0,68 in case with items rotation and 0,71 in case without items rotation). The impact of expectation on perceived quality is 0,84 in case with items rotation and 0,82 in case without items rotation. Once again the results can not be attributed to the presence or not of items rotation.
Table 8 Structural model results
With Rotation Without Rotation
Criterion Predictors R² Path coefficient R² Path coefficient
Loyality Image 0,576988 0,114839 0,57974 0,073878
Satisfaction 0,67329 0,705594
Quality Expectation 0,707015 0,840842 0,67526 0,821742
Satisfaction Image 0,684068 0,218262 0,705384 0,306694
Quality 0,502549 0,379827
Value 0,193405 0,269741
Expectation Image 0,600948 0,775209 0,566253 0,752498
Value Expectation 0,469901 0,283289 0,420067 -0,005854
Quality 0,429921 0,652927
Table 9 shows the total effects (direct and indirect effects) between constructs. The highest total effect is verified in quality originated by expectation (0,84 in case with items rotation and 0,82 in case without items rotation). The total effect of expectation originated by image is also relevant (0,78 in case with items rotation and 0,75 in case without items rotation). Comparing the two samples we note that results are consistent, because the total effects are generally of the same magnitude for the samples with and without items rotation. Under these circumstances, the results can not be attributed to the presence or not of items rotation.
Table 9 Total effects
Criterion
With Rotation Without Rotation
Predictor E xp e cta ti o n Qu al it y Val u e Sat is fact ion Lo y al it y E xp e cta ti o n Qu al it y Val u e Sat is fact ion Lo y al it y
Image 0,78 0,65 0,50 0,64 0,55 0,75 0,62 0,40 0,65 0,53
Expectation - 0,84 0,64 0,55 0,37 - 0,82 0,53 0,46 0,32
Quality - - 0,43 0,59 0,39 - - 0,65 0,56 0,39
Value - - - 0,19 0,67 - - - 0,27 0,19
Satisfaction - - - - 0,13 - - - - 0,71
13 Discussion and conclusions
With this study we intended to analyze the impact of items rotation in questionnaires and its effect on response profile and reliability in the context of ECSI Portugal – Portuguese Customer Satisfaction Index.
Bradlow & Fitzsimons (2001) and Paulhus (1991) verified that a common approach in dealing with order effect biases is to use several forms of the same survey (e.g., multiple randomized orderings, a frontward and backward order). This procedure was followed in this study, where the same questionnaire was created with two forms, having one fixed order and the other variable order (only for the image construct which has five indicators).
The analysis includes the response distribution, non-response rates and the convergent and discriminant validity of constructs used in ECSI model.
Relatively to response distribution, it is possible to conclude that the response distribution in each question is different in the group with items rotation and in the group without items rotation. Also in case of non-responses, although the proportion of non-response is higher in the sample without rotation, these differences are not significant, so we cannot conclude that generally the proportion of non-responses in cases with rotation and without rotation is different in the population.
In which concerns to validity assessment, we conclude that all the constructs except quality show evidence for acceptable validity, but this discriminant validity does not depend on items rotation.
It was verified that it exists a high convergent validity; however, we cannot conclude that this depends on the items rotation, because there are no differences between the two samples.
In face of the above, the results of the study of item rotation in the image block showed that there are no significant differences between the samples with item rotation and without rotation. Although it has been demonstrated that the order of the items in the questionnaire (item rotation) influence the responses of inquiries DeMoranville, Bienstock, & Judson (2008); Ryan & Chiu (2001); Moore (2002), in the present study we could not verify it.
According to Welch & Swift (1992) when the questionnaires are too long it verifies higher non-response rate in the last questions of survey. So, in this case, as we did not verify higher non-non-response rate in the last paragraphs of the image block, we can conclude that the same group is not so long as to create saturation or tiring by the part of the respondents.
As significant correlations between the questions of image block do not exist (we could not find any strong relation between the various paragraphs), we can conclude that the questions within this group are independent each others.
14 Appendix A
17 References
Ball, A. D., Coelho, P. S., & Machás, A. (2004). The role of communication and trust in explaining customer loyalty: An extension to the ECSI model. European Journal of Marketing, 38. Bradburn, N. M., & Mason, W. M. (1964). The Effect of Question Order on Responses. Journal of
Marketing Research (JMR), 1(4), 57-61.
Bradlow, E. T., & Fitzsimons, G. J. (2001). Subscale Distance and Item Clustering Effects in Self-Administered Surveys: A New Metric. Journal of Marketing Research (JMR), 38(2), 254-261. Coelho, P. S., & Esteves, S. P. (2007). The choice between a five-point and a ten-point scale in the
framework of customer satisfaction measurement. International Journal of Market Research, 49(3), 313-339.
Coelho, P. S., & Henseler, J. (2011). Creating Customer Loyalty through Service Customization: European Journal of Marketing.
Couper, M. P., Traugott, M. W., & Lamias, M. J. (2001). WEB SURVEY DESIGN AND ADMINISTRATION. Public Opinion Quarterly, 65(2), 230-253.
Crespi, I., & Morris, D. (1984). Question Order Effect and the Measurement of Candidate Preference in the 1982 Connecticut Elections. Public Opinion Quarterly, 48(3), 578-591.
DeMoranville, C. W., Bienstock, C. C., & Judson, K. (2008). Using question order for predictive service quality measures. The Journal of Services Marketing, 22(2-3), 255-262.
Dickinson, J. R., & Kirzner, E. (1985). Questionnaire Item Omission as a Function of Within-Group Question Position. Journal of Business Research, 13(1), 72-75.
Fornell, C. (1992). A National Customer Satisfaction Barometer: The Swedish Experience. [Article]. Journal of Marketing, 56(1), 6-21.
Fornell, C., Johnson, M. D., Anderson, E. W., Jaesung, C., & Bryant, B. E. (1996). The American Customer Satisfaction Index: Nature, Purpose, and Findings. Journal of Marketing, 60(4), 7-18. Fornell, C., & Larcker, D. F. (1981). Evaluating Structural Equation Models with Unobservable Variables
and Measurement Error. Journal of Marketing Research (JMR), 18(1), 39-50.
Gadotti, I., Vieira, E., & Magee, D. (2006). Importance and clarification of measurement properties in rehabilitation. Revista Brasileira de Fisioterapia, 10(2), 137-146.
Krosnick, J. A., & Alwin, D. F. (1987). An evaluation of a cognitive theory of response-order effects in survey measurement. Public Opinion Quarterly, 51(2), 201.
Lietz, P. (2010). Research into questionnaire design. International Journal of Market Research, 52(2), 249-272.
McFarland, S. G. (1981). Effects of Question Order on Survey Responses. Public Opinion Quarterly, 45(2), 208-215.
Moore, D. W. (2002). Measuring new types of question-order effects additive and subtractive. Public Opinion Quarterly, 66(1), 80-91.
Paulhus, D. L. (1991). Measurement and Control of Response Bias. In E. S. Diego (Ed.), Measures of Personality and Social Psychological Attitudes (pp. 17-59): Academic Press.
Perreault Jr, W. D. (1975). Controlling order-effect bias. Public Opinion Quarterly, 39(4), 544. Peterson, R. A. (2005). Response construction in consumer behavior research. Journal of Business
Research, 58(3), 348 -353.
Reichardt, C. S., & Coleman, S. C. (1995). The Criteria for Convergent and Discriminant Validity in a Multitrait-multimethod Matrix. Multivariate Behavioral Research, 30(4), 513.
Ringle, Christian Marc/Wende, Sven/Will, & Alexander. (2005). SmartPLS Release 2.0 (beta). Retrieved November 2011, 2011, from http://www.smartpls.de
Ryan, K. E., & Chiu, S. (2001). An Examination of Item Context Effects, DIF, and Gender DIF. Applied Measurement in Education, 14(1), 73-90.
18 Schwarz, N., Strack, F., & Mai, H. P. (1991). Assimilation and Contrast Effects in Part-Whole Question
Sequences: A Conversational Logic Analysis. Public Opinion Quarterly, 55(1), 3-23.
Sigelman, L. (1981). Question-Order Effects on Presidential Popularity. Public Opinion Quarterly, 45(2), 199-207.
Simmons, C. J., Bickart, B. A., & Lynch Jr, J. G. (1993). Capturing and Creating Public Opinion in Survey Research. Journal of Consumer Research, 20(2), 316-329.
Snidero, S., Zobec, F., Berchialla, P., Corradetti, R., & Gregori, D. (2009). Question Order and Interviewer Effects in CATI Scale-up Surveys. Sociological Methods & Research, 38(2), 287-305. Trochim, W. M. K. (2006). Research Methods Knowledge Base, from
http://www.socialresearchmethods.net
Vilares, M., Coelho, P., & Magalhães, S. (2009). ECSI Portugal 2009 - A satisfação de clientes por sectores. Qualidade - Associação Portuguesa para a Qualidade, 1, 15-20.
W. DeMoranville, C., & C. Bienstock, C. (2003). Question order effects in measuring service quality. International Journal of Research in Marketing, 20, 217-231.