The protected areas system in Brazil as a baseline condition for
wetlands management and fish conservancy: the example of the
Pantanal National Park
Carla N. M. Polaz
1,2, Fabio C. Ferreira
3and Miguel Petrere Júnior
4Considering the need for the Brazilian government to develop tools for environmental monitoring for biodiversity conservancy purposes in the national protected areas system, this paper focuses on determining reference site metrics (or baselines) for adapting the Index of Biotic Integrity (IBI) based on the fish assemblages in the Pantanal National Park (PNP). The habitats in the PNP were grouped into four categories: main rivers, corixos (channels connecting the floodplain), permanent bays, and temporary bays. Fish samplings were performed at 12 points during the dry season (Oct-Nov 2010 and 2011). 146 fish species were identified from the total 18,954 individuals collected with standardized fishing gear. There was no association between the structure of the fish assemblage and categories, suggesting a theory on homogeneity of habitats. The final IBIPNP consists of nine metrics, most of them were framed in excellent class, some in fair, and none in poor. There was no significant difference
in IBIPNP scores between the two sampled years. This approach provides a direct application for wetland management purposes. Keywords: Conservation unit, Fish assemblages, Floodplain, Index of biotic integrity, Multimetric indices.
É iminente que o Brasil desenvolva ferramentas para monitorar o sistema de áreas protegidas do país, formado especialmente pelas Unidades de Conservação e tendo como foco a proteção efetiva da biodiversidade. Nesse contexto, esse trabalho discute métricas de referência (ou linhas de base) para compor um Índice de Integridade Biótica (IIB) baseado nas comunidades de peixes, tendo como área de estudo o Parque Nacional do Pantanal Matogrossense. Os hábitats encontrados no Parque foram agrupados em quatro estratos ambientais: rios, corixos (cursos d´água que se conectam à planície de inundação) e baías permanentes e temporárias. As coletas de peixes foram realizadas em 12 pontos amostrais durante o período seco (out/nov de 2010 e 2011). Foram identificadas 146 espécies de peixes, totalizando 18.954 exemplares coletados em amostragens padronizadas. Não houve associação entre a estrutura da comunidade e os estratos ambientais, sugerindo homogeneidade de hábitats. O IIB final foi composto por nove métricas, a maior parte alocada na classe excelente de integridade biótica, poucas na classe regular e nenhuma na classe pobre. Não houve diferença significativa no IIB entre os dois anos consecutivos. Esses resultados oferecem subsídios técnicos para a tomada de decisão sobre a gestão das áreas alagáveis no Pantanal brasileiro.
Palavras-chave: Assembleia de peixes, Índice de integridade biótica, Índices multimétricos, Planície de inundação, Unidade de conservação.
1Programa de Pós-Graduação em Ciências da Engenharia Ambiental, Escola de Engenharia de São Carlos, Centro de Recursos Hídricos e Ecologia Aplicada, Universidade de São Paulo, Rod. Domingos Innocentini, km 13, 292, São Carlos, São Paulo, Brasil. 2Centro Nacional de Pesquisa e Conservação da Biodiversidade Aquática Continental, Instituto Chico Mendes de Conservação da Biodiversidade, Rod. Pref. E. Nemésio Pereira de Godoy (SP 201) km 6.5, 64, Pirassununga, São Paulo, Brazil. [email protected] (corresponding author)
3Departamento de Ciências do Mar, Campus Baixada Santista, Universidade Federal de São Paulo, Avenida Almirante Salda -nha da Gama, 89, Ponta da Praia, 11030-400, Santos, São Paulo, Brazil. [email protected]
4Programa de Pós-Graduação em Sustentabilidade de Ecossistemas Costeiros e Marinhos, UNISANTA, Rua Oswaldo Cruz, 277 (Boqueirão), 11045-907, Santos, São Paulo, Brazil. [email protected]
Introduction
Human disturbances interact in a complex way with aquatic ecosystems, and their effects can rarely be evaluated using only physical or chemical variables as indirect measures of environmental integrity. Assessing the response of the aquatic biota (e.g., freshwater fish)
often provides a more integrated view of environmental impacts (Fausch et al., 1990). These are the principles
The applications of the IBI in the U.S. and Europe demonstrated the effectiveness of the method and highlighted the need to modify or adapt the index to particularities of regions and systems under study (Hughes, Oberdorff, 1999; Simon, Sanders, 1999; Roset et al., 2007).
In Brazil, the first adaptation of the IBI based on fish assemblages was carried out in 1998 (Araújo et al., 2003) in one of the most critical segments of the highly polluted Paraíba do Sul River, which runs through the main industrial region of the country. In the Upper Paraná River, small streams (Ferreira, Casatti, 2006; Casatti et al., 2009) and
reservoirs (Petesse et al., 2007; Terra et al., 2010) were also investigated by adapting the IBI to these systems.
According to the original proposition (Karr, 1981; Karr et al., 1986), the intensity of environmental degradation should be evaluated by comparing the modified habitats with pristine environments in the same or a nearby region (such as a protected area) taken as reference conditions or baselines. However, pristine sites are frequently not found, explained by an environmental and cultural “illness” known as SBS - Shifting Baseline Syndrome (Pauly, 1995). In those cases, some authors have considered the site with the lowest degree of modification to represent reference conditions (Hughes et al., 1986; McDonough, Hickman, 1999; Pont et al., 2006). From this moment on, the baseline becomes shifted in a contagious and probably irreversible process. One generation later (25-30 yrs.), there will last no environmental collective memory of the prior baseline.
In the face of rapid degradation of aquatic environments around the world, it is argued that adaptations of IBI should also be undertaken for the few environments where human modifications are still not apparent. For these environments, reference conditions can and should be established before
human modification becomes evident and irreversible. This idea is, again, in line with the SBS concept: after an anthropogenic impacts are disseminated, there are no reference points that could be used as a base for future evaluation of ongoing stresses on ecosystem functionality (Pauly, 1995). The problem arises because there are few situations in which a monitoring tool is implemented before the impact is present. Nonetheless, efforts should be made to change this scenario, at least for the few ecosystems that still have pristine conditions, so that the reference point could drive policy makers in proposing environmental and conservation programs.
Thus, the present study aims to adapt the IBI for the fish community of the Pantanal National Park, a large wetland area in Brazil. The most remarkable characteristic of wetlands of the Pantanal is seasonal variation in water levels, which controls ecosystem dynamics. The Pantanal is a Biosphere Reserve by UNESCO and can be considered a biodiversity refuge among Brazilian wetlands.
Material and Methods
Study area. The Pantanal National Park (PNP) is located in the extreme southwest of the Mato Grosso State in the municipality of Poconé at the junction of the Paraguay and Cuiabá rivers (Fig. 1). This unique Park retains a considerable sample of the original lowland with a total area of 1,350 km2, equivalent to 1% of the Brazilian Pantanal biome (Instituto Brasileiro do Meio Ambiente e dos Recursos Naturais Renováveis, 2003). Founded in September 1981, this national protected area (Ministério do Meio Ambiente, 2000) has been managed since 2007 by the Instituto Chico Mendes de Conservação da Biodiversidade, an agency of the Brazilian government.
Sampling design and fish collection. Based on cartographic charts of habitat distribution and photographic records, four regions, totaling 12 sampling sites (named P1 through P12), were pre-established and visited in the field for confirmation. Strata were defined based on water flow (lotic or lentic) and connectivity with main river channel (permanent or temporary connection). Category A (lotic environments represented by P4 and P6) was characterized by two major rivers, Cuiabá and Paraguay, in the Pantanal floodplain. These rivers are permanent water bodies with well-defined channels, and, henceforth, this category is designated as main channel sites. Category B (lentic environments; P3, P7, and P8) is composed of floodplain lakes with permanent connection to the main river channel throughout the hydrological cycle (Burro, Três Bocas, and Morro bays). This category is identified as permanent bays. With the exception of Três Bocas Bay, which is deeper, the other two are shallower and are about 50 cm deep during the dry season. Category C (lentic environments; P5, P10, and P11) is represented by smaller bays (Nove, Morro, and Biguerinho river bays), called baiotas, with intermittent connection with the main river and average depths ranging from 1 to 2 meters during the high-water season. These river bays can dry out completely in the low water season (except in years with higher flows) and, hereinafter, are referred to as temporary bays. Lastly, category D (lotic environments; P1, P2, P9, and P12) is represented by connected channels linking the main rivers and other elements of the floodplain, such as bays, and are referred locally as corixos (Boca do Ricardo, Morro do
Caracara, Caracarazinho do Morro river, and Biguerinho river). As they link the main rivers to the floodplain, the current is weaker than in the main channel, and they have no delimited headwater and mouth. However, they may exhibit very well defined channels. When the channels are not well defined, they are called vazante (ebb), where the water simply overflows. This type of body is identified as corixos.
In a preliminary recognition campaign in the PNP area (Sep-2009), these 12 sampling points were selected out of 40 other potential locations based on: a) typology of habitat structure, b) cartographic analysis, and c) access by boat, considering that the core area of the PNP is unreachable. The samples were taken during the dry season of 2010 and 2011 because, during wet season, the four categories are indistinguishable and fish capture is less efficient due to high water level.
The sampling effort was characterized by 30 sequential hauls, separated by a minimum distance of 3 m along the marginal vegetation. Medium to large fish were collected with two cast nets (with 2 and 8 cm between opposite knots and with 15 hauls of each cast net in each sampling point) and gillnets (set of 7 nets with mesh ranging from 4 to 16 cm between opposite knots that were set for 2 hours in the water during sunlight). The sequence of nets was set at random. The small-sized fish species, usually associated
with macrophytes, were collected with sieves built from net shading (nylon 1.5 mm opposite knots mesh size) that had dimensions of 1.5 m x 1.5 m and 0.7 m depth.
Metrics selection and description. The IBIPNP metrics were adapted from Karr et al. (1986), Ganasan, Hughes (1998), Araújo et al. (2003), Bozzetti, Schulz (2004),
Petesse et al. (2007), and Ferreira (2011). 34 candidate metrics were selected and grouped into four categories (Tab. 1) considering the following traits of the fish community structure: (i) richness and species assemblages (8 metrics); (ii) fish abundance (8 metrics); (iii) composition of feeding groups (10 metrics) and; (iv) indicators of environmental health at community level (8 metrics). All metrics were calculated in numbers of fish, as the measurement of biomass is difficult to obtain in the field due to the amount of fish collected. With exception of metrics 32 (number of introduced species) and 33 (number of hybrid species) only native species of the Pantanal ecosystem were considered. In order to select appropriate metrics to compose the IBIPNP, 3 tests were conducted (i) a range test to assess the magnitude and variability of the metrics in the sampling sites, (ii) a responsiveness test to evaluate the response of each metric to habitat modification, and (iii) a redundancy test to exclude highly correlated metrics of modification (Stoddard et al., 2008; Petesse et al., 2014). Metrics with ranges equal or smaller than 4 or with 75% of identical values (range test) were excluded, since they would be unable to detect differences among the sampling locations (Whittier et al., 2007) and therefore would have low discriminatory power. The metric responses to environmental modification (responsiveness test) were verified by the Spearman correlation coefficient (rS) between each remaining metric and the following abiotic characteristics: macrophyte cover-MC, macrophyte integrity-MI, presence of communal bird nests-PN, air temperature-AT, water temperature-WT, water transparency-WTp, depth-D, electrical conductivity-EC, dissolved oxygen-DO, and oxidation/reduction potential-ORP (Polaz, 2013). Metrics that showed significant correlation (p<0.05) passed the test. The Spearman correlation was also calculated to identify pairs of redundant metrics (redundancy test). For pairs of metrics that had a correlation coefficient above 0.7 (Whittier et al., 2007), the ones that exhibited the lowest number of significant correlations in the responsiveness test were excluded (McCormick et al., 2001; Whittier et al., 2007).
Criteria for scoring and classes of integrity. As in most applications of IBI, ordinal scores were used to standardize metrics in different scales considering the categories: impacted biota (1), fair or intermediate (3), and not impaired (5).
In order to exclude the effect of outliers, only the interval between the 5th and 95th percentiles were considered. For the remaining metrics, the 25th percentile of the distribution as the inferior limit was assumed. Values above the 25th percentile were considered unimpaired (score 5), and values below the 25th percentile were bisected. Those in the top half received a score of 3, and those in the bottom half received a score of 1. Gerritsen et al. (2003) recommended
this procedure for scoring when most sites are undisturbed. This score attribution was inverted for metrics that increase with disturbance intensity such as the number of introduced species. Finally, the scores were summed to obtain the final IBI, which was classified as “poor”, “fair”, or “excellent” classes of biotic integrity. A two-way Analysis of Variance was used to test the effects of water body categorization and year of sampling on the final IBIPNP (Zar, 2010).
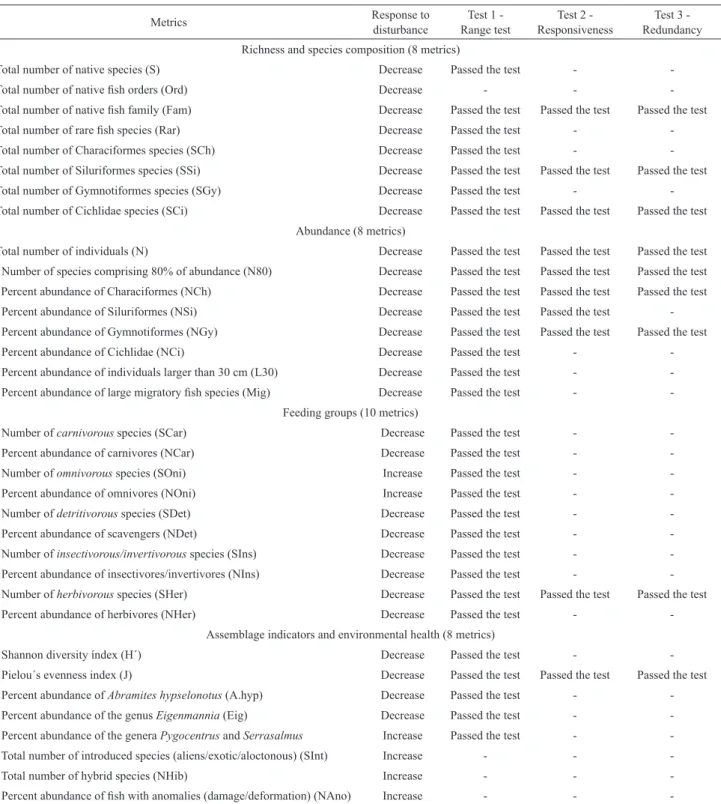
Tab. 1. Candidate metrics, expected responses to disturbance and results of criteria tests (1, 2 and 3) to compose the IBIPNP. The sign (-) indicates that the measure did not pass the test.
Metrics Response to
disturbance
Test 1
-Range test ResponsivenessTest 2 - RedundancyTest 3 - Richness and species composition (8 metrics)
1. Total number of native species (S) Decrease Passed the test -
-2. Total number of native fish orders (Ord) Decrease - -
-3. Total number of native fish family (Fam) Decrease Passed the test Passed the test Passed the test
4. Total number of rare fish species (Rar) Decrease Passed the test -
-5. Total number of Characiformes species (SCh) Decrease Passed the test -
-6. Total number of Siluriformes species (SSi) Decrease Passed the test Passed the test Passed the test
7. Total number of Gymnotiformes species (SGy) Decrease Passed the test -
-8. Total number of Cichlidae species (SCi) Decrease Passed the test Passed the test Passed the test Abundance (8 metrics)
9. Total number of individuals (N) Decrease Passed the test Passed the test Passed the test 10. Number of species comprising 80% of abundance (N80) Decrease Passed the test Passed the test Passed the test 11. Percent abundance of Characiformes (NCh) Decrease Passed the test Passed the test Passed the test
12. Percent abundance of Siluriformes (NSi) Decrease Passed the test Passed the test
-13. Percent abundance of Gymnotiformes (NGy) Decrease Passed the test Passed the test Passed the test
14. Percent abundance of Cichlidae (NCi) Decrease Passed the test -
-15. Percent abundance of individuals larger than 30 cm (L30) Decrease Passed the test - -16. Percent abundance of large migratory fish species (Mig) Decrease Passed the test -
-Feeding groups (10 metrics)
17. Number of carnivorous species (SCar) Decrease Passed the test -
-18. Percent abundance of carnivores (NCar) Decrease Passed the test -
-19. Number of omnivorous species (SOni) Increase Passed the test -
-20. Percent abundance of omnivores (NOni) Increase Passed the test -
-21. Number of detritivorous species (SDet) Decrease Passed the test -
-22. Percent abundance of scavengers (NDet) Decrease Passed the test -
-23. Number of insectivorous/invertivorous species (SIns) Decrease Passed the test - -24. Percent abundance of insectivores/invertivores (NIns) Decrease Passed the test - -25. Number of herbivorous species (SHer) Decrease Passed the test Passed the test Passed the test
26. Percent abundance of herbivores (NHer) Decrease Passed the test -
-Assemblage indicators and environmental health (8 metrics)
27. Shannon diversity índex (H´) Decrease Passed the test -
-28. Pielou´s evenness index (J) Decrease Passed the test Passed the test Passed the test
29. Percent abundance of Abramites hypselonotus (A.hyp) Decrease Passed the test -
-30. Percent abundance of the genus Eigenmannia (Eig) Decrease Passed the test -
-31. Percent abundance of the genera Pygocentrus and Serrasalmus Increase Passed the test -
-32. Total number of introduced species (aliens/exotic/aloctonous) (SInt) Increase - -
-33. Total number of hybrid species (NHib) Increase - -
-Results
Fish assemblage composition. 18,954 individuals were collected and distributed in nine orders for 31 families and 146 species of freshwater fish (Britski et al., 2007; Oliveira et al., 2011; Eschmeyer et al., 2017) (Tab. 2). Some of these
species are listed in Polaz et al. (2014). The phylogenetic
orders comprising the highest percentage of the richness were Characiformes (69 species; 47.3%) and Siluriformes (50 species; 34.2%), followed by Perciformes (11 species; 7.5%), and Gymnotiformes (11 species; 7.5%). These four orders represented 96.5% of the total fish assemblages. The highest number of species was within the Characidae family (25.3%), followed by Loricariidae (10.3%) and Cichlidae (6.8%).
Tab. 2. Taxonomic list of sampled species according to Eschmeyer, Fricke (2017) and species abundance, feeding and migratory guilds in the region sampled in the Pantanal National Park, during the dry season (Oct-Nov, 2010 and 2011). PB - permanent bays, TB - temporary bays, CR - “corixos”, MR - main rivers. TG - trophic guilds; C - carnivores; I - insectivores/ invertivores; O - omnivores; D - detritivores; H - herbivores; ND - not determined trophic guild; LdM - long-distance migratory species.
ID SPECIES PB TB CR MR Total TG LdM
ACTINOPTERYGII BELONIFORMES
Belonidae
1 Potamorhaphis eigenmanni Miranda Ribeiro, 1915 0 1 1 0 2 C CHARACIFORMES
Acestrorhynchidae
2 Acestrorhynchus pantaneiro Menezes, 1992 0 1 4 0 5 C
Anostomidae
3 Abramites hypselonotus (Günther, 1868) 44 9 24 13 90 H
4 Leporinus friderici Bloch, 1794 1 0 6 0 7 O
5 Leporinus lacustris Amaral Campos, 1945 9 22 16 6 53 O
6 Leporinus striatus Kner, 1858 13 1 8 11 33 O
7 Megaleporinus macrocephalus (Garavello & Britski, 1988) 1 0 7 1 9 O Yes 8 Megaleporinus obtusidens (Valenciennes, 1837) 0 1 2 0 3 O
9 Schizodon borellii (Boulenger, 1900) 8 12 42 7 69 H
10 Schizodon isognathus Kner, 1858 2 0 1 0 3 H
Bryconidae
11 Brycon hilarii (Valenciennes, 1850) 0 1 1 0 2 O Yes
Characidae
12 Aphyocharax anisitsi Eigenmann & Kennedy, 1903 0 12 0 0 12 I 13 Aphyocharax dentatus Eigenmann & Kennedy, 1903 4 27 16 2 49 O 14 Aphyocharax nattereri (Steindachner, 1882) 18 108 45 2 173 I 15 Aphyocharax rathbuni Eigenmann, 1907 0 34 3 0 37 I 16 Astyanax abramis (Jenyns, 1842) 0 68 0 1 69 I 17 Astyanax asuncionensis Géry, 1972 1 3 2 0 6 O 18 Bryconamericus exodon Eigenmann, 1907 15 0 21 63 99 I 19 Bryconamericus stramineus Eigenmann, 1908 25 16 47 4 92 I
20 Charax leticiae Lucena, 1987 1 20 1 1 23 C
ID SPECIES PB TB CR MR Total TG LdM 32 Moenkhausia forestii Benine, Mariguela & Oliveira, 2009 46 190 45 10 291 O
33 Moenkhausia oligolepis (Günther, 1864) 1 0 0 0 1 O 34 Odontostilbe paraguayensis Eigenmann & Kennedy, 1903 102 0 30 0 132 O 35 Odontostilbe pequira (Steindachner, 1882) 224 71 83 46 424 O 36 Poptella paraguayensis (Eigenmann, 1907) 5 3 5 0 13 I 37 Prionobrama paraguayensis (Eigenmann, 1914) 298 854 336 22 1510 O 38 Psellogrammus kennedyi (Eigenmann, 1903) 7 16 105 10 138 O 39 Roeboides descalvadensis Fowler, 1932 0 14 5 3 22 C 40 Roeboides microlepis (Reinhardt, 1851) 1 1 5 7 14 C 41 Serrapinnus calliurus (Boulenger, 1900) 403 323 108 55 889 O 42 Serrapinnus kriegi (Schindler, 1937) 0 0 24 0 24 O 43 Serrapinnus microdon (Eigenmann, 1915) 53 1005 395 0 1450 O 44 Tetragonopterus argenteus Cuvier, 1816 3 3 10 0 16 O
Crenuchidae
45 Characidium laterale (Boulenger, 1895) 150 487 306 72 1015 I 46 Characidium aff. zebra Eigenmann, 1909 8 0 2 27 37 I
Curimatidae
47 Curimatella dorsalis (Eigenmann & Eigenmann, 1889) 0 5 0 0 5 D
48 Curimatopsis myersi Vari, 1982 0 96 2 0 98 D
49 Cyphocharax gillii (Eigenmann & Kennedy, 1903) 0 6 2 4 12 D 50 Potamorhina squamoralevis (Braga & Azpelicueta, 1983) 27 37 57 20 141 D 51 Psectrogaster curviventris Eigenmann & Kennedy, 1903 3 20 63 1 87 D
Cynodontidae
52 Rhaphiodon vulpinus Spix & Agassiz, 1829 6 0 1 2 9 C
Erythrinidae
53 Hoplerythrinus unitaeniatus (Spix & Agassiz, 1829) 2 0 1 0 3 O 54 Hoplias aff. malabaricus (Bloch, 1794) 12 5 16 9 42 C
Gasteropelecidae
55 Gasteropelecus sternicla (Linnaeus, 1758) 7 7 50 1 65 I 56 Thoracocharax stellatus (Kner, 1858) 0 0 0 5 5 I
Hemiodontidae
57 Hemiodus orthonops Eigenmann & Kennedy, 1903 1 0 0 1 2 O
Iguanodectidae
58 Piabucus melanostoma Holmberg, 1891 10 0 5 0 15 H
Lebiasinidae
59 Pyrrhulina australis Eigenmann & Kennedy, 1903 45 187 86 17 335 I
Prochilodontidae
60 Prochilodus lineatus (Valenciennes, 1837) 26 8 1 2 37 D Yes
Serrassalmidae
61 Metynnis maculatus (Kner, 1858) 0 2 0 0 2 H
62 Myleus levis Eigenmann & McAtee, 1907 0 4 11 1 16 H 63 Mylossoma duriventre (Cuvier, 1818) 6 7 25 11 49 H
64 Piaractus mesopotamicus (Holmberg, 1887) 4 1 9 2 16 H Yes 65 Pygocentrus nattereri Kner, 1858 62 36 65 17 180 C
66 Serrasalmus maculatus Kner, 1858 9 56 25 4 94 C 67 Serrasalmus marginatus Valenciennes, 1837 57 10 39 3 109 C
Triportheidae
ID SPECIES PB TB CR MR Total TG LdM CLUPEIFORMES
Engraulidae
71 Anchoviella sp. 0 20 4 0 24 ND
ORDER CYPRINODONTIFORMES
Poeciliidae
72 Pamphorichthys hasemani (Henn, 1916) 0 0 1 0 1 I
Cynolebiidae
73 Melanorivulus punctatus (Boulenger, 1895) 0 0 4 0 4 I ORDER GYMNOTIFORMES
Apteronotidae
74 Apteronotus albifrons (Linnaeus, 1766) 7 3 4 0 14 I 75 Apteronotus caudimaculosus de Santana, 2003 8 15 18 8 49 O 76 Sternarchorhynchus curvirostris (Boulenger, 1887) 0 0 2 0 2 I
Gymnotidae
77 Gymnotus inaequilabiatus (Valenciennes, 1839) 7 7 5 0 19 I 78 Gymnotus paraguensis Albert & Crampton, 2003 0 1 6 1 8 I
Hypopomidae
79 Brachyhypopomus spp. 60 96 53 25 234 ND
Ramphichthyidae
80 Gymnorhamphichthys britskii Carvalho, Ramos & Albert, 2011 2 5 1 2 10 I 81 Rhamphichthys hahni (Meiken, 1937) 0 1 0 1 2 I
Sternopygidae
82 Eigenmannia trilineata López & Castello, 1966 960 638 180 323 2101 I 83 Eigenmannia virescens (Valenciennes, 1836) 22 29 126 9 186 I 84 Sternopygus macrurus (Bloch & Schneider, 1801) 83 68 61 36 248 I
ORDER PERCIFORMES
Cichlidae
85 Aequidens plagiozonatus Kullander, 1984 5 0 10 0 15 O 86 Apistogramma borellii (Regan, 1906) 20 9 45 0 74 I 87 Apistogramma commbrae (Regan, 1906) 3 4 3 2 12 I 88 Apistogramma trifasciata (Eigenmann & Kennedy, 1903) 82 116 141 30 369 I 89 Astronotus crassipinnis (Heckel, 1840) 0 0 2 0 2 I 90 Cichlasoma dimerus (Heckel, 1840) 11 14 22 10 57 D 91 Crenicichla lepidota Heckel, 1840 39 52 65 24 180 C
92 Crenicichla vittata Heckel, 1840 1 0 0 0 1 O
93 Laetacara dorsigera (Heckel, 1840) 1 0 0 0 1 O 94 Mesonauta festivus (Heckel, 1840) 0 4 2 3 9 H
Sciaenidae
95 Plagioscion ternetzi Boulenger, 1895 6 0 1 2 9 C ORDER SILURIFORMES
Aspredinidae
96 Amaralia oviraptor Friel & Carvalho, 2016 1 0 0 0 1 C 97 Pseudobunocephalus rugosus (Eigenmann & Kennedy, 1903) 3 1 0 0 4 D
Auchenipteridae
98 Auchenipterus nigripinnis (Boulenger, 1895) 2 0 0 0 2 C 99 Auchenipterus osteomystax (Miranda Ribeiro, 1918) 3 0 1 0 4 C 100 Entomocorus benjamini Eigenmann, 1917 3 2 0 0 5 I
101 Tatia neivai (Ihering, 1930) 0 0 1 0 1 I
ID SPECIES PB TB CR MR Total TG LdM
Callichthydae
105 Callichthys callichthys (Linnaeus, 1758) 7 0 3 0 10 O 106 Corydoras hastatus Eigenmann & Eigenmann, 1888 0 110 144 3 257 I 107 Hoplosternum littorale (Hancock, 1828) 0 0 2 0 2 I
Doradidae
108 Anadoras weddellii (Castelnau, 1855) 0 1 3 0 4 O 109 Ossancora eigenmanni (Boulenger, 1895) 3 7 15 14 39 I
110 Oxydoras kneri Bleeker, 1862 13 0 12 2 27 O
111 Platydoras armatulus (Valenciennes, 1840) 5 1 2 5 13 O 112 Pterodoras granulosus (Valenciennes, 1821) 1 0 8 2 11 O
Heptapteridae
113 Imparfinis spp. 12 20 77 4 113 ND
114 Phenacorhamdia hoehnei (Miranda Ribeiro, 1914) 0 0 4 0 4 I 115 Pimelodella gracilis (Valenciennes, 1835) 0 7 1 15 23 O 116 Pimelodella mucosa Eigenmann & Ward, 1907 0 0 1 0 1 I 117 Pimelodella notomelas Eigenmann, 1917 1 0 0 0 1 I 118 Rhamdia aff. quelen (Quoy & Gaimard, 1824) 3 1 1 2 7 O
Loricariidae
119 Ancistrus spp. 3 0 0 0 3 ND
120 Farlowella paraguayensis Retzer & Page, 1997 0 0 2 8 10 D 121 Hemiodontichthys acipenserinus (Kner, 1853) 0 0 0 1 1 I 122 Hypoptopoma inexspectatum (Holmberg, 1893) 433 314 474 120 1341 D 123 Hypostomus cochliodon Kner, 1854 18 43 28 22 111 D 124 Hypostomus latifrons Weber, 1986 32 3 23 0 58 D
125 Hypostomus spp. 83 55 69 44 251 D
126 Loricaria spp. 3 0 0 0 3 D
127 Loricariichthys labialis (Boulenger, 1895) 1 0 0 0 1 D 128 Loricariichthys platymetopon Isbrücker & Nijssen, 1979 3 0 0 0 3 D 129 Otocinclus vittatus Regan, 1904 488 462 347 116 1413 H 130 Pterygoplichthys ambrosettii (Holmberg, 1893) 3 8 7 30 48 D 131 Rineloricaria parva (Boulenger, 1895) 409 236 214 166 1025 D 132 Spatuloricaria evansii (Boulenger, 1892) 1 0 0 0 1 D
133 Sturisoma barbatum (Kner, 1853) 0 0 5 0 5 D
Pimelodidae
134 Hemisorubim platyrhynchos (Valenciennes, 1840) 0 0 1 1 2 C Yes 135 Hypophthalmus edentatus Spix & Agassiz, 1829 0 1 0 0 1 O
136 Pimelodus argenteus Perugia, 1891 5 4 2 0 11 O 137 Pimelodus pantaneiro Souza-Filho & Shibatta, 2007 1 1 4 1 7 O
138 Pseudoplatystoma corruscans (Spix & Agassiz, 1829) 1 0 0 0 1 C Yes 139 Pseudoplatystoma reticulatum Eigenmann & Eigenmann, 1889 1 1 4 1 7 C Yes 140 Sorubim lima (Bloch & Schneider, 1801) 1 0 1 1 3 C Yes
Scoloplacidae
141 Scoloplax distolothrix Schaefer, Weitzman & Britski, 1989 2 0 0 8 10 I 142 Scoloplax empousa Schaefer, Weitzman & Britski, 1989 1 2 0 0 3 I
Trichomycteridae
143 Ituglanis eichorniarum (Miranda Ribeiro, 1912) 1 0 0 1 2 I 144 Ituglanis herberti (Miranda Ribeiro, 1940) 1 0 0 0 1 I 145 Trichomycterus johnsoni (Fowler, 1932) 0 1 0 0 1 I
SYNBRANCHIFORMES
Synbranchidae
146 Synbranchus marmoratus Bloch, 1795 0 1 2 1 4 I
5280 7154 4902 1621 18954
Five feeding groups were recognized with the most common being insectivory/invertivory (47 species; 32.2%), followed by omnivory with 44 species (30.1%), carnivory/piscivory (21 species, 14.4%), detritivory (20 species, 13.7%), and herbivory represented by 10 species (6.9%). Four entities were considered undetermined (2.7%): Anchoviella sp., Ancistrus spp., Brachyhypopomus
spp., and Imparfinis spp. Additional information on species list and categorization into feeding and migratory guilds could be also consulted in Polaz (2013, chapter 2, p.106-8).
Metrics selection. Nine of the 34 candidate metrics passed the criteria established by the range, responsiveness, and redundancy tests (Tab. 1). The number of native orders (metric 2) ranged from 3 to 6, and, therefore, they did not pass the range test (range < 4). Introduced species or hybrids were not sampled (metrics 32 and 33, respectively), and only 4 of the 24 samples exhibited had single individual anomaly (metric 34). In all these cases, the metrics did not meet the first criteria, as more than 75% of the values were zero.
Ten of the remaining 30 metrics (3, 6, 8, 9, 10, 11, 12, 13, 25, and 28) passed the second test (responsiveness), as they were correlated with at least one environmental variable. Most metrics (3, 8, 9, 25, and 28) showed a significant correlation with only one of the abiotic factors, one metric (10) with two factors, three metrics (6, 12, and 13) with three factors, and one metric (11) with four factors. Among
the abiotic variables, the macrophyte cover (MC) and the oxidation-reduction potential (ORP) showed the highest number of metrics correlation. In particular, four metrics were correlated with MC, while there were four others with ORP. A test was proposed for the communal bird nests (locally known as ninhais) as a metrics because, especially in the reproductive season, they can provide a relevant feeding microhabitat for the fish community. Nonetheless, this factor and water depth were not correlated with any metrics.
From the 10 metrics accepted by the second test, the pairwise correlation matrix was calculated using the Spearman correlation coefficient (see more in supplementary material), resulting in only one redundant pair (metrics 11 and 12, rS = -0.863). It was decided to keep metric 11 as it had the greater number of significant correlations (four correlations) with the environmental variables (responsiveness test). Therefore, only metric 12 did not pass in the test of redundancy.
Metrics scoring and IBI
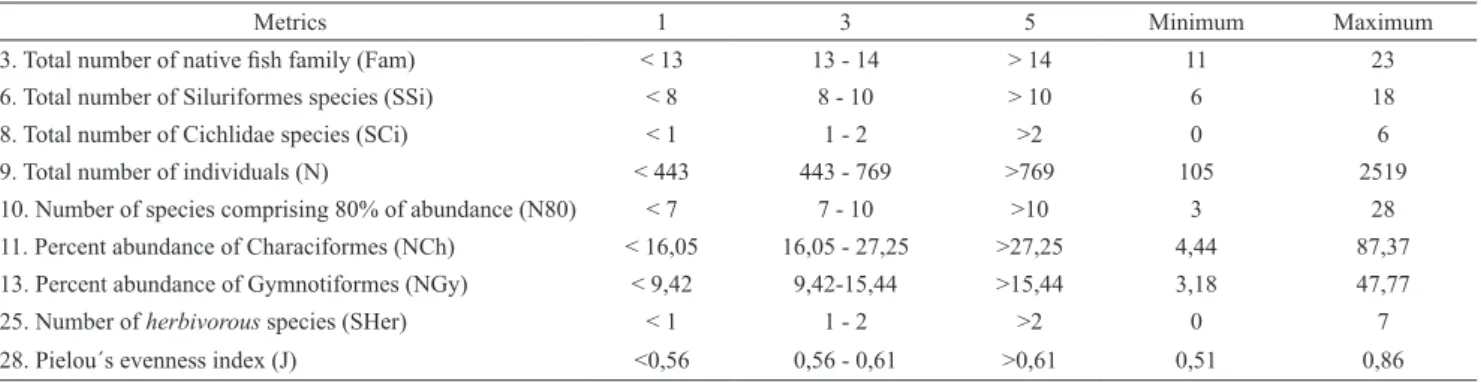
PNP calculation. All nine selected metrics are expected to decrease their values with increasing intensities of disturbance. Therefore, lower scores indicate worse conditions, and the highest scores indicate the best conditions. As there are nine metrics, the final IBIPNP for a site could range from 9 (the worst condition in which all of the metrics are given the value 1) to 45 (the best condition in which all metrics are given the value 5) (Tab. 3).
Tab. 3. Score intervals and ranges of values of the metrics for calculating the IBIPNP.
Metrics 1 3 5 Minimum Maximum
3. Total number of native fish family (Fam) < 13 13 - 14 > 14 11 23
6. Total number of Siluriformes species (SSi) < 8 8 - 10 > 10 6 18
8. Total number of Cichlidae species (SCi) < 1 1 - 2 >2 0 6
9. Total number of individuals (N) < 443 443 - 769 >769 105 2519
10. Number of species comprising 80% of abundance (N80) < 7 7 - 10 >10 3 28
11. Percent abundance of Characiformes (NCh) < 16,05 16,05 - 27,25 >27,25 4,44 87,37
13. Percent abundance of Gymnotiformes (NGy) < 9,42 9,42-15,44 >15,44 3,18 47,77
25. Number of herbivorous species (SHer) < 1 1 - 2 >2 0 7
28. Pielou´s evenness index (J) <0,56 0,56 - 0,61 >0,61 0,51 0,86
Sites with excellent biotic integrity (ranging from 35 to 45) represented the best-observed situations. The community composition includes the most intolerant forms in all ranges of age category and sex ratio. They have a diverse and balanced trophic structure, the presence of large species and migratory fish, and the expected fish diversity for the biome. Fair conditions (ranging from 22 to 34) are those sites in which the number of species is close the expected richness, having a relatively balanced trophic structure but with some species decreasing their relative abundance and size below the values expected for the best condition. This fish community begins to show some signs of stress and needs to be monitored. The poor sites (ranging from 9 to 21) have low diversity, simplified trophic structure, dominance of tolerant
and introduced species (non-native and/or exotic ones), and may show a high percentage of individuals with anomalies and parasites.
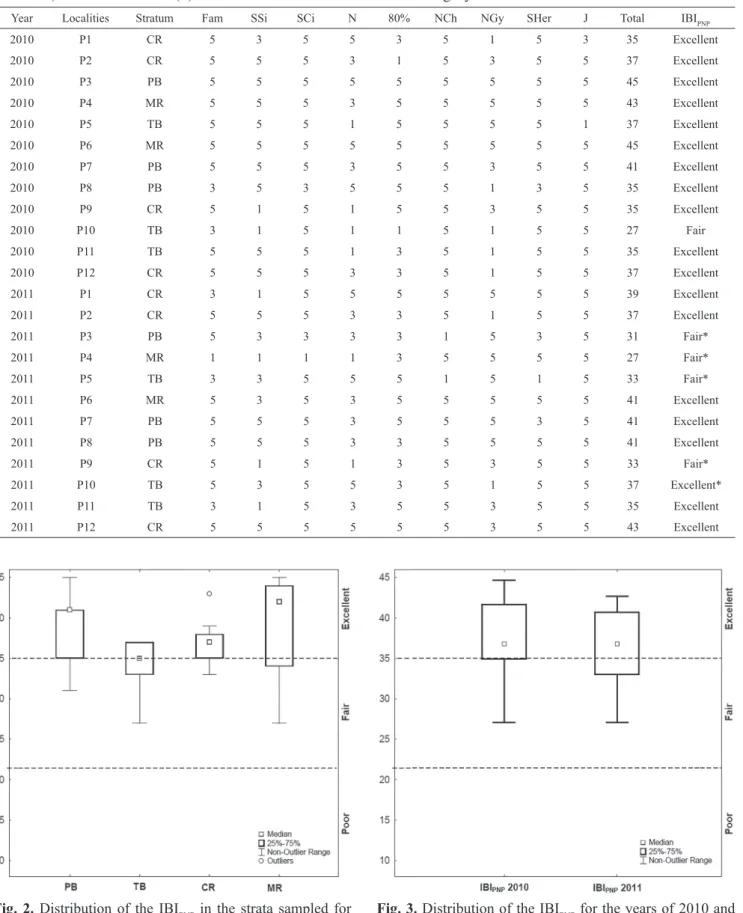
The IBIPNP ranged from 27 to 45. No sites were classified as poor, 19 were excellent (IBIPNP ≥ 35), and only 5 were classified as fair (IBIPNP between 22 and 34). In 2010, with the exception of P10 (“fair”), all sites fit in the best class of integrity (“excellent”), and in 2011, while P10 increased from “fair” to “excellent”, four points (P3, P4, P5, and P9) had their scores decreased (from “excellent” to “fair”) (Tab. 4).
Fig. 2. Distribution of the IBIPNP in the strata sampled for the Pantanal National Park during the dry season (Oct-Nov, 2010 and 2011). PB - permanent bays, TB - temporary bays, CR - corixos, MR - main rivers.
Fig. 3. Distribution of the IBIPNP for the years of 2010 and 2011.
Tab. 4. Scores of selected metrics for IBIPNP in 24 sampling points in the Pantanal National Park during the dry period (Oct-Nov) of 2010 and 2011. (*) Metrics that had different classes of integrity in 2010 and 2011.
Year Localities Stratum Fam SSi SCi N 80% NCh NGy SHer J Total IBIPNP
2010 P1 CR 5 3 5 5 3 5 1 5 3 35 Excellent
2010 P2 CR 5 5 5 3 1 5 3 5 5 37 Excellent
2010 P3 PB 5 5 5 5 5 5 5 5 5 45 Excellent
2010 P4 MR 5 5 5 3 5 5 5 5 5 43 Excellent
2010 P5 TB 5 5 5 1 5 5 5 5 1 37 Excellent
2010 P6 MR 5 5 5 5 5 5 5 5 5 45 Excellent
2010 P7 PB 5 5 5 3 5 5 3 5 5 41 Excellent
2010 P8 PB 3 5 3 5 5 5 1 3 5 35 Excellent
2010 P9 CR 5 1 5 1 5 5 3 5 5 35 Excellent
2010 P10 TB 3 1 5 1 1 5 1 5 5 27 Fair
2010 P11 TB 5 5 5 1 3 5 1 5 5 35 Excellent
2010 P12 CR 5 5 5 3 3 5 1 5 5 37 Excellent
2011 P1 CR 3 1 5 5 5 5 5 5 5 39 Excellent
2011 P2 CR 5 5 5 3 3 5 1 5 5 37 Excellent
2011 P3 PB 5 3 3 3 3 1 5 3 5 31 Fair*
2011 P4 MR 1 1 1 1 3 5 5 5 5 27 Fair*
2011 P5 TB 3 3 5 5 5 1 5 1 5 33 Fair*
2011 P6 MR 5 3 5 3 5 5 5 5 5 41 Excellent
2011 P7 PB 5 5 5 3 5 5 5 3 5 41 Excellent
2011 P8 PB 5 5 5 3 3 5 5 5 5 41 Excellent
2011 P9 CR 5 1 5 1 3 5 3 5 5 33 Fair*
2011 P10 TB 5 3 5 5 3 5 1 5 5 37 Excellent*
2011 P11 TB 3 1 5 3 5 5 3 5 5 35 Excellent
Discussion
The PNP is a large area within the Pantanal biome representing the wetlands of Central-West Brazil. This national park is closed for public visitation as of this publication. However, tourism will soon be allowed, which may result in additional sources of environmental impact if this activity is poorly managed. The building of small reservoirs in the headwaters of its main rivers may also lead to changes in the hydrological cycle and consequently modify the ecosystem dynamics. The multimetric indices are best suited to assess the impact on aquatic environments from multiple sources, as they take into account different ecological attributes of communities (Seegert, 2000). Thus, this attempt to conduct the first implementation of an index of biotic integrity to PNP is aimed to provide a monitoring tool and a reference condition for assessing future environmental impairment within the park and its surroundings.
Applying the IBI to a preserved area has the unique possibility of gathering information with confidence on the distribution of reference values. As the metrics are measured before the beginning of disturbance processes and virtually all sites can be considered in good or excellent biotic integrity, there is no need to model sample values for baseline conditions in this case. A logical difficulty, however, is that in the absence of human impacts, the IBIPNP values become difficulty to validate. Considering scenarios of strong disturbance, some responses are easily predicted, such as the reduction of species richness, migratory fishes, and intolerant species. On the other hand, predicting the responses in advance of these impacts may be difficult and challenging when the disturbances are subtle. Because the PNP is a conservation unit not severely impacted, small values for a metric distribution were not expected. Score 1 should represent clear evidence of human impact, but within the range of observations on hand, sites classified as 1 are considered as far as possible from the best potential condition (score 5) for a determined metric. This is expected due to natural variation, even when analyzing pristine environments (Gerritsen et al., 2003). The challenge of adapting an IBI to an undisturbed area is just as difficult as adapting it to a heavily disturbed one, where natural conditions are no longer available. In both cases, not all classes of disturbance-integrity are present, and the researchers have only a partial view of the range of possibilities for the metrics distribution.
Due to this limitation, the choice for candidate metrics on IBI’s adapted for other environments was investigated and the appropriate metrics were selected based on the three established criteria: range test, responsiveness, and redundancy (Whittier et al. 2007, Petesse et al., 2014). The
second criteria, for example, attempted to identify metrics that were sensitive to environmental conditions, expecting that these responses will exacerbate in the presence of anthropogenic impacts. In addition, following Gerritsen et
al. (2003), the choice for the kind of metric scoring reflected
the fact that the observed values will act as reference for future impacts within the region.
Significant differences among the types of water bodies and between years on the mean values of IBIPNP were not detected. This suggests that despite being clearly heterogeneous, the categories of water bodies analyzed have similar integrities, and these patterns do not change significantly from one year to another. In other applications of the IBI, temporal variability have been generally less important than spatial variability (Petesse et al., 2007;
Casatti et al., 2009; Terra, Araújo, 2010; Ferreira, 2011),
being the reason why Casatti et al. (2009) reinforced the
importance of investing in the spatial variability instead of seasonality in early adaptations of multimetric indices. Terra, Araújo (2010), for instance, reported that seasonality had no effect on Reservoir Fish Assemblage Index (RFAI; an adaptation of IBI for reservoirs) in a transitional river-dam stretch of the Paraíba do Sul River that covers the Funil reservoir.
Considering this question, the current temporal study and sampling did not investigate the variation during the hydrological cycle (drought, flood, ebb, and flow), which l is the most important factor controlling community dynamics in the Pantanal. It was expected that large changes in fish communities during hydrological cycle would occur, but the similarity found in the IBIPNP between the dry seasons of 2010 and 2011 suggests that the fish populations are adapted to such phenomena. When year to year variability is not important, Karr et al. (1986) recommended that fish
sampling should be conducted in a season that minimizes variation in fish community, due to discrete events such as fish recruitment. Several factors contribute to variations in the observed values for the IBI of a particular place and time because the index is entirely dependent on the composition and abundance of the collected fish population. Some pattern of movements and the collectors experience, for example, interfere decisively in the species and individuals sampled (e.g., larger or smaller) (Fore et al., 1994). This makes the multimetric indices behave as a random variable, adding a stochastic component upon the estimate of biotic integrity. In the Pantanal, recruitment takes place mainly during flood periods. As such, more variation in the community composition during flow and flood periods due to fish migrations and recruitment can be expected. Fish sampling is also less efficient during these seasons due to the higher water volume. In the dry season, the aquatic environments are more constrained, and sampling is more efficient, yielding a better characterization of fish communities (Junk et al., 1989; Junk, 2001). These facts provide us a better picture of how fish community structures are organized, which is a practical concern if the IBIPNP is established as a monitoring tool.
groups (1 metric), and indicators at the community levels (1 metric). Four metrics handle with the patterns observed at higher taxonomic levels such as order (total number of Siluriformes species or abundance of Characiformes and Gymnotiformes) or family (total number of Cichlidae species). As an advantage, these taxonomic levels are easily recognized by non-specialists. Other metrics, such as total number of individuals or number of species comprising 80% of total abundance, are easily calculated. For example, there is no need to determine each species when counting how many species comprise 80% of total population. In addition, Petesse et al. (2007) concluded that calculating the index in terms of fish biomass or fish numbers generates similar results in a previous application of a multimetric index to reservoirs. If the same applies for the IBIPNP, the application in numbers would require less field effort because it would be impracticable to weigh the high numbers of fish captured in the field (mainly the small ones).
The IBIPNP values are subject to the environmental characteristics observed within the park. In this case, it should be considered that the type of gear employed tended to catch the fish living in shallow habitats (<2m depth). Thus, there is a need to standardize the sampling method for future comparisons.
By combining indicators into an overall multimetric index to summarize biological condition, it is reinforced that the presented results in metrics combination always carried to the same baseline: PNP sites can be considered as references. Although the IBIPNP can be used as a reference for future adaptations, further studies are needed on the biology of each species and how they interact with their habitats. It is also suggested that wetland areas outside of the park with evident signs of anthropogenic degradation be selected to validate our results and to provide new opportunities to test the IBIPNP.
In addition, research that has the opportunity to investigate pristine areas should be encouraged and supported by governments and international organizations because information in these areas, even if already available, cannot be easily transferred to multimetric indices. Given that budget and time to conduct additional studies is always a limitation, in addition to considering the degree of human impact on aquatic environments, such information will be of great value to substantiate management decisions.
Acknowledgments
This study is a partial result of a Ph.D thesis of CNMP advised by MP-Jr and FCP at University of São Paulo, Brazil. It was financially supported by Instituto Chico Mendes de Conservação da Biodiversidade (ICMBio). The authors are grateful to Dra. Maria Letizia Petesse for her valuable comments on previous versions of this manuscript. We would like to thank Dr(s). José Augusto F. de Lima, Cláudio Oliveira, Fábio di Dário, Marina Loeb, Flávio C.T. Lima, Flávio Bockmann and Fernando Apone for helping us
with fish identification; to IBAMA for fish collection license and Dr(s). Bruno F. Melo and Ricardo Britzke that helped us with the fish sampling and identification in the field. We would also like to thank Michael James Stablein of the University of Illinois Urbana-Champaign for his translation services and review of this work.
References
Araújo FG, Fichberg I, Pinto BCT, Peixoto MG. A preliminary index
of biotic integrity for monitoring the condition of the rio Paraiba
do Sul, Southeast Brazil. Environ Manage. 2003; 32(4):516-26. Bozzetti M, Schulz UH. An index of biotic integrity based on
fish assemblages for subtropical streams in southern Brazil. Hydrobiologia [serial on the Internet]. 2004; 529(1–3):133-44. Available from: http://dx.doi. org/10.1007/s10750-004-5738-6 Britski HA, Silimon KZS, Lopes BS. Peixes do Pantanal: Manual
de identificação. 2nd ed. Brasília: Embrapa Informação Tecnológica; 2007.
Casatti L, Ferreira CP, Langeani F. A fish-based biotic integrity
index for assessment of lowland streams in southeastern Brazil.
Hydrobiologia. 2009; 623(1):173-89.
Eschmeyer WN, Fricke R, van der Laan R. (eds). Catalog of fishes: genera, species, references [internet]. San Francisco: California Academy of Science; 2017 [updated 2017 Aug 31].
Available from: http://researcharchive.calacademy.org/research/
ichthyology/catalog/fishcatmain.asp
Fausch KD, Lyons J, Karr JR, Angermeier PL. Fish communities as indicators of environmental degradation. Am Fish Soc Symp. 1990; 8:123-44.
Ferreira CP, Casatti L. Integridade biótica de um córrego na bacia do alto rio Paraná avaliada por meio da comunidade de peixes.
Biota Neotrop. 2006; 6(3):1-25.
Ferreira FC. Adaptação do índice de assembleia de peixes em
reservatórios (IAPR) às áreas das PCH’s - usinas Batista e Jorda Flor, rio Turvo (SP). [PhD Thesis]. Rio Claro, SP: Universidade Estadual Paulista; 2011.
Fore LS, Karr JR, Conquest LL. Statistical properties of an index of
biological integrity used to evaluate water resources. Can J Fish
Aq Sci. 1994; 51(5):1077-87.
Ganasan V, Hughes RM. Application of an index of biological integrity (IBI) to fish assemblages of the rivers Khan and Kshipra (Madhya Pradesh), India. Freshwater Biol. 1998; 40(2):367-83. Gerritsen J, Carlson RE, Dycus DL, Faulkner C, Gibson GR,
Harcum J, Markowitz SA. Lake and reservoir bioassessment and biocriteria: Technical guidance document. US Environmental
Protection Agency. 2003 [updated 2014 Oct]. Available from:
http:www.epa.gov/owow/monitoring/tech/lakes.html
Hughes RM, Larsen DP, Omernik JM. Regional reference sites: a method for assessing stream potentials. Environ Manage. 1986; 10(5):629-35.
Hughes RM, Oberdoff T. Applications of IBI concepts and metric to waters outside the Unites State and Canada. In: Simon TP,
editor. Assessing the sustainability and biological integrity
Instituto Brasileiro do Meio Ambiente e dos Recursos Naturais Renováveis (IBAMA). Plano de manejo do Parque Nacional do
Pantanal Matogrossense. 2003 [updated 2013 Jun]. Available from: http://www.icmbio.gov.br/portal/images/stories/imgs-unidades-conservacao/parna_matogrossense.pdf
Junk WJ, Bayley PB, Sparks RE. The flood pulse concept in river-floodplain systems. Can Spec Publ Fish Aquat Sci. 1989; 106:
110-27.
Junk WJ. The flood pulse concept of large rivers: learning from the tropics. Verh Internat Verein Limnol. 2001; 27:3950-53. Karr JR. Assessment of biotic integrity using fish communities.
Fisheries. 1981; 6(6):21-27.
Karr JR, Fausch KD, Angermeier PL, Yant PR, Schlosser IJ.
Assessing biological integrity in running waters: A method and
its rationale. Ill Nat Hist Surv. 1986; special publication 5:1-28. McCormick FH, Hughes RM, Kaufmann PR, Peck DV, Stoddard
JL, Herlihy AT. Development of an index of biotic integrity for the mid-Atlantic highlands region. Trans Am Fish Soc [serial on the Internet]. 2001; 130(5):857-77. Available from: http:// dx.doi.org/10.1577/1548-8659(2001)130<0857:DOAIOB>2.0 .CO;2
McDonough TA, Hickman GD. Reservoir Fish Assemblage
Index development: a tool for assessing ecological health in
Tennessee Valley Authority impoundments. In: Simon TP,
editor. Assessing the sustainability and Biological Integrity of
water resources using fish communities. Boca Raton: CRC Press; 1999. p.523-40.
Ministério do Meio Ambiente (MMA). Sistema Nacional de Unidades de Conservação da Natureza. Lei Federal nº 9.985, de 18 de julho de 2000. Brasília (DF): Diário Oficial da União;
2000.
Oliveira C, Avelino GS, Abe KT, Mariguela TC, Benine RC, Ortí
G et al. Phylogenetic relationships within the speciose family
Characidae (Teleostei: Ostariophysi: Characiformes) based
on multilocus analysis and extensive ingroup sampling. BMC
Evol Biol. 2011; 11:275-325. Available from: https://doi. org/10.1186/1471-2148-11-275
Pauly D. Anecdotes and the shifting baseline syndrome of fisheries. Trends Ecol Evol. 1995; 10(10):430.
Petesse ML, Petrere Júnior M, Agostinho, AA. Defining a fish
bio-assessment tool to monitoring the biological condition of
a cascade reservoirs system in tropical area. Ecol Eng. 2014; 69:139–150. Available from: http://dx.doi.org/10.1016/j.
ecoleng.2014.03.070
Petesse ML, Petrere Júnior M, Spigolon RJ. Adaptation of the Reservoir Fish Assemblage Index (RFAI) for assessing the Barra Bonita Reservoir (São Paulo, Brazil). River Res Appl [serial on the Internet]. 2007; 23(6):595-612. Available from:
http://dx.doi.org/10.1002/rra.1001
Polaz CNM. Caracterização da Ictiofauna e Aplicação do Índice de Integridade Biótica no Parque Nacional do Pantanal
Mato-grossense, Poconé, MT. [PhD Thesis on the Internet]. São
Carlos: Universidade de São Paulo; 2013 [cited 2013 Aug 28]. Available from: Biblioteca digital Universidade de São Paulo. http://www.teses.usp.br/teses/disponiveis/18/18139/ tde-26082013-091018/pt-br.php
Polaz CNM, Melo BF, Britzke R, Resende EK, Machado FA, Lima
JAF, Petrere Júnior M. Fishes from the Parque Nacional do
Pantanal Matogrossense, upper Paraguai River basin, Brazil. Check List. 2014; 10(1):122-30.
Pont D, Hugueny B, Beier U, Goffaux D, Melcher A, Noble R, Rogers C, Roset N, Schmutz S. Assessing river biotic condition at a continental scale: a European approach using functional metrics and fish assemblage. J Appl Ecol [serial on the Internet]. 2006; 43(1):70-80. Available from: http://onlinelibrary.wiley. com/doi/10.1111/j.1365-2664.2005.01126.x/abstract
Roset N, Grenouillet G, Goffaux D, Pont D, Kestemont P. A review of existing fish assemblage indicators and methodologies. Fisheries Manag Ecol [serial on the Internet]. 2007; 14(6):393-405. Available from: http://dx.doi.org/10.1111/ j.1365-2400.2007.00589.x
Seegert G. Considerations regarding development of index of biotic integrity metrics for large rivers. Environ Sci Policy. 2000; 3(S1):99-106.
Simon TP, Sanders RE. Applying an index of biotic integrity based on great river fish communities: considerations in sampling and interpretation. In: Simon TP, editor. Assessing the
sustainability and Biological Integrity of water resources using
fish communities. Boca Raton: CRC Press; 1999. p.475-505. Stoddard JL, Herlihy AT, Peck DV, Hughes RM, Whittier TR,
Tarquinio E. A process for creating multimetric indices for large-scale aquatic surveys. J N Am Benthol Soc. 2008; 27(4):878-91.
Terra BF, Araújo FG. A preliminary fish assemblage index for a transitional river-reservoir system in southeastern Brazil. Ecol Indic. 2010; 11:874-81.
Whittier TR, Hughes RM, Stoddard JL, Lomnicky GA, Peck DV, Herlihy AT. A structured approach for developing indices of
biotic integrity: three examples from streams and rivers in the
Western USA. Trans Am Fish Soc. 2007; 136(3):718-35. Zar JH. Biostatistical Analysis. 5th ed. New Jersey: Upper Saddle
River; 2010.