Characterization of a Gene Expression
Signature in Normal Rat Prostate Tissue
Induced by the Presence of a Tumor
Elsewhere in the Organ
Hanibal Hani Adamo*, Sofia Halin Bergström, Anders Bergh
Department of Medical Biosciences, Pathology, UmeåUniversity, Umeå, Sweden
Abstract
Implantation of rat prostate cancer cells into the normal rat prostate results in tumor-stimu-lating changes in the tumor-bearing organ, for example growth of the vasculature, an altered extracellular matrix, and influx of inflammatory cells. To investigate this response further, we compared prostate morphology and the gene expression profile of tumor-bearing normal rat prostate tissue (termed tumor-instructed/indicating normal tissue (TINT)) with that of prostate tissue from controls. Dunning rat AT-1 prostate cancer cells were injected into rat prostate and tumors were established after 10 days. As controls we used intact animals, an-imals injected with heat-killed AT-1 cells or cell culture medium. None of the controls showed morphological TINT-changes. A rat Illumina whole-genome expression array was used to analyze gene expression in AT-1 tumors, TINT, and in medium injected prostate tis-sue. We identified 423 upregulated genes and 38 downregulated genes (p<0.05,2-fold change) in TINT relative to controls. Quantitative RT-PCR analysis verified key TINT-changes, and they were not detected in controls. Expression of some genes was changed in a manner similar to that in the tumor, whereas other changes were exclusive to TINT. On-tological analysis using GeneGo software showed that the TINT gene expression profile was coupled to processes such as inflammation, immune response, and wounding. Many of the genes whose expression is altered in TINT have well-established roles in tumor biolo-gy, and the present findings indicate that they may also function by adapting the surround-ing tumor-bearsurround-ing organ to the needs of the tumor. Even though a minor tumor cell contamination in TINT samples cannot be ruled out, our data suggest that there are tumor-induced changes in gene expression in the normal tumor-bearing organ which can probably not be explained by tumor cell contamination. It is important to validate these changes fur-ther, as they could hypothetically serve as novel diagnostic and prognostic markers of prostate cancer.
a11111
OPEN ACCESS
Citation:Adamo HH, Halin Bergström S, Bergh A (2015) Characterization of a Gene Expression Signature in Normal Rat Prostate Tissue Induced by the Presence of a Tumor Elsewhere in the Organ. PLoS ONE 10(6): e0130076. doi:10.1371/journal. pone.0130076
Academic Editor:Aamir Ahmed, King's College London, UNITED KINGDOM
Received:May 16, 2014
Accepted:May 19, 2015
Published:June 15, 2015
Copyright:© 2015 Adamo et al. This is an open access article distributed under the terms of the Creative Commons Attribution License, which permits unrestricted use, distribution, and reproduction in any medium, provided the original author and source are credited.
Data Availability Statement:All relevant data are within the paper and its Supporting Information files.
Funding:This work was supported by grants from the Swedish Research Council(AB) [Grant numbers: Co257301 (http://www.vr.se/inenglish.4.
Introduction
Prostate cancer, a very common multifocal disease with highly variable behavior, is difficult to
diagnose and prognosticate [1,2]. The diagnosis is dependent on microscopic examination of
needle biopsies of prostate tissue. Unfortunately, current imaging techniques cannot identify prostate cancers and safely guide biopsy needles towards tumors. The current way of overcom-ing this problem is to take multiple biopsies, but as biopsies only sample a minute part of the whole prostate they can miss all the tumor tissue present, or the most malignant tissue. Global-ly, of the millions of men who have prostate examinations every year due to the suspicion of cancer, most have biopsies that are negative for cancer [2]. Whether this indicates that cancer is not present at all or has been missed is not generally known, but in 20% of the men exam-ined, cancer is detected in a subsequent round of biopsies [2]. If, however, the benign tissue sampled in prostate biopsies is in some way altered by the presence and nature of tumors else-where in the organ, this could possibly lead to an improvement in diagnosis.
In order to grow and spread, tumors need to interact with adjacent and more remote tissues [3,4]. Tumor cells, for example, interact with the closely adjacent tumor stroma, and also with
distant organs such as the bone marrow and pre-metastatic niches [3,5]. One additional—
often neglected—site that is likely to be affected both by the needs of the growing tumor and
the host defense is the tumor-bearing organ. We have therefore hypothesized that aggressive cancers affect the tumor-bearing organ in ways that are quantitatively and qualitatively differ-ent from the effects of more indoldiffer-ent tumors, and that a better understanding of this might lead to better diagnosis and treatment of prostate cancer [1].
We have shown that implantation of a rat prostate tumor induces tustimulating mor-phological changes in the surrounding normal rat prostate tissue. The density of inflammatory cells, such as macrophages and mast cells, is increased and facilitates both growth of the feeding
vasculature and tissue remodeling [1,6–8]. The extracellular matrix is altered; expression of
hyaluronan, for example, is increased and this promotes tumor growth [9]. Although appear-ing morphologically unaffected, luminal glandular epithelial cells show a delayed apoptosis re-sponse to castration [6]. Similarly, in patients, alterations in the epithelium and stroma of the non-malignant prostate tissue surrounding tumors are related to prognostically important tumor characteristics such as Gleason score and tumor stage, and can be used to evaluate the
risk of death from prostate cancer in a watchful waiting cohort [1,8–14]. We have suggested a
novel term for this type of normal tissue affected by the presence of an adjacent tumor: tumor-instructed (and thus indicating) normal tissue (TINT) [1]. TINT contains both morphological-ly normal-appearing epithelium and stroma of the tumor-bearing organ and is not in direct contact with the tumor epithelial cells; it is thus different from the already well-established tumor stroma.
To explore the TINT concept in more detail we now investigated if the gene expression pat-tern in TINT was different from that in non tumor-bearing prostates. We compared the pros-tate tissue surrounding the poorly differentiated and locally aggressive Dunning AT-1 prospros-tate tumor with that in prostate tissue from tumor-free animals and found 461 genes whose expres-sion was altered (423 up-regulated and 38 down-regulated) in TINT compared to controls. This suggested that the presence of a tumor altered gene expression in the tumor-bearing organ. The TINT gene signature was linked to processes such as extracellular matrix organiza-tion, immune responses, and inflammation. Alterations in gene expression in TINT suggest that tumors exploit the surrounding tumor-bearing organ for their own benefit, and such changes could therefore serve as potential therapeutic targets and/or as diagnostic/prognostic markers for prostate cancer.
collection and analysis, decision to publish, or preparation of the manuscript.
Materials and Methods
Cells and animals
The fast-growing, androgen-insensitive, anaplastic and low-metastatic Dunning rat AT-1 pros-tate tumor cells (ECACC; Sigma Aldrich, Stockholm, Sweden) were grown in culture as de-scribed earlier [15]. For implantation of the AT-1 tumor cells, adult male Copenhagen rats were used (Charles River, Sulzfeld, Germany) [6]. All the animal work was approved by the Umeå ethical committee for animal research (Permit Number: A110-12) and strong efforts were made to minimize animal discomfort and suffering.
Animals for morphological analyses
To study tissue morphology and to label hypoxic and proliferating cells, animals were
anesthe-tized and injected with 2000 AT-1 cells in 40μl RPMI-1640 cell culture medium into one lobe
of the ventral prostate (VP) using a Hamilton syringe (n= 7). Control animals were injected
with heat killed AT-1 cells (100°C for 30 minutes) in RPMI (n= 8) or with RPMI medium
alone (n= 9). At day 10 (when the tumors occupied about 60% of the prostate volume, see
below), the animals were injected with Hypoxyprobe (Millipore, Bedford, MA) and bromo-deoxyuridine, BrdU (Roche, Mannheim, Germany) one hour before sacrifice, as previously de-scribed [6], and the prostates, livers, and kidneys were formalin-fixed and embedded in paraffin. Paraffin-embedded tissues were sectioned and stained with an antibody to Hypoxyp-robe (NPI, Inc. Burlington, MA, US), and the percentage of hypoxic prostate tissue was deter-mined as previously described [6]. Sections were also stained with antibodies against factor VIII (Dako, Denmark), CD68 (Serotec, Oxford, UK) and BrdU (BD Biosciences, CA, US) and with toluidine blue to label blood vessels, macrophages, proliferating cells and mast cells, re-spectively, and to determine the volume density of these tissue components and the endothelial
BrdU labelling index using methods earlier described [6–8]. The Mann-Whitney U test was
used for comparisons between groups and anyp-value<0.05 was considered significant.
Animals for gene expression analyses
For the microarray studies, animals were implanted with AT-1 cells (n= 11) or RPMI as
con-trols (n= 15) as described above. The animals were sacrificed at day 10 and the prostate lobes
were quickly removed, frozen in liquid nitrogen, and stored at -80°C.
For the RT-PCR, a new set of animals with AT-1 tumors (n= 8), RPMI only (n= 10) or
with heat-killed AT-1 cells (n= 8) was used.
Five-μm thick cryostat sections of the VP lobe were taken for pathological evaluation, in
order determine the size and location of the tumor and the surrounding non-malignant pros-tate tissue in the samples, and verify that the VP lobe from control animals was free of tumors and other pathologies. Surrounding non-malignant prostate tissue and prostate tumor tissue were dissected with a margin of 0.5 to 1 mm to avoid contamination from each other (S1 Fig). When sufficient tissue had been collected an additional cryo-section was cut to verify that the tissue dissected contained only the intended tissue type.
RNA extraction
Total RNA from 35 samples (8 tumors, 11 TINT, 15 normal prostate controls, and one batch
of AT-1 cells) was extracted using TRIzol according to the manufacturer’s instructions
The integrity of the RNA was determined using an Agilent 2100 BioAnalyzer (Agilent, Will-mington, DE).
Preparation of cRNA and Illumina chip hybridization. Biotin-labeled cRNA was
syn-thesized from 200 ng total RNA using the IlluminaTotalPrep RNA Amplification kit (Applied
Biosystems, Austin, TX) according to the manufacturer’s protocol. The quality of labeled
cRNA was verified using a Nanodrop ND-1000 spectrophotometer. A total of 750 ng biotin-la-beled cRNA from each sample was loaded onto the 12-sample RatRef Illumina BeadChip gene
expression array (Illumina, San Diego, CA) according to the manufacturer’s protocols. The
ar-rays were scanned and fluorescence signals measured using the Illumina BeadArray Reader (Illumina, San Diego, CA, USA).
Data analysis
The array data were analyzed with GenomeStudio software (version 2009.2; Illumina). Rank invariant normalization was used to remove or minimize non-biological systematic variation. Differences in gene expression between TINT, tumor, or cell line samples and normal prostate
control reference samples were compared using the Mann-Whitney U test.P-values for each
gene were adjusted to minimize false-positive results by using the Benjamini and Hochberg procedure. To examine similarities in gene expression in the different samples, we performed average linkage clustering with Pearson correlation on the whole dataset of 35 samples (8 tu-mors, 11 TINT, 15 normal prostate controls, and 1 AT-1 cell line).
Next, fold changes in gene expression were calculated by dividing the mean signal for each probe in the TINT group by the mean signal for each probe in the control group. A list of dif-ferentially expressed candidate genes in TINT vs. control prostate tissue was created by
selec-tion of those that had (a) ap-value of<0.05, (b)2-fold variation in expression, and (c) a
probe signal of at least twice the background signal in at least one of the two groups.
Genes that were significantly differently expressed in TINT compared to control prostate, and also their corresponding expression in AT-1 tumor tissue, were visualized in a heatmap
using MultiExperiment Viewer software (MeV version 4.9;www.tm4.org). Hierarchical gene
clustering was performed using average linkage clustering with Pearson correlation. The genes that were significantly expressed in TINT were further analyzed for enriched biological pro-cesses and pathways using GeneGo MetaCore software (www.genego.com). GeneGo software includes a manually annotated database of biological pathways and processes obtained from the scientific literature. The software uses algorithms to create lists of networks and pathways, ranked according to calculated statistical significance (https://portal.genego.com/help/P-value_calculations.pdf).
Real-time RT-PCR
RT-PCR was used to confirm some of the microarray data. Eleven genes (Hmox1,Lox,Cd68,
Lpl,Cebp-beta,Cyr61,Mmp3,S100a4,Tgf-bi,Mme,and Gtsm1) that represent different clusters
(see below) were selected for validation.Psmc4was used as a reference gene. Total RNA was
ex-tracted as above and treated with DNA-freeKit (Ambion, Austin, TX) to remove DNA
contami-nation and reverse transcription was performed using superscript III (Invitrogen, Carlsbad, CA). Taqman assays with gene-specific primers and probes set (Applied Biosystems, Foster
City, CA) for each gene were used (Hmox1: Rn01536933_m1,Lox: Rn01491829_m1,Cd68:
Rn01495634_g1,Lpl: Rn00561482_m1,Mmp3: Rn00591740_m1,Gstm1: Rn00755117_m1,
Cebp-beta: Rn00824635_s1,Cyr61: Rn01523136_g1,S100a4: Rn01451938_m1,Tgf-bi:
test was used for comparisons between groups and anyp-value<0.05 was considered significant.
Results and Discussion
TINT-changes are different from those induced by injection of tissue
culture medium or heat-killed tumor cells
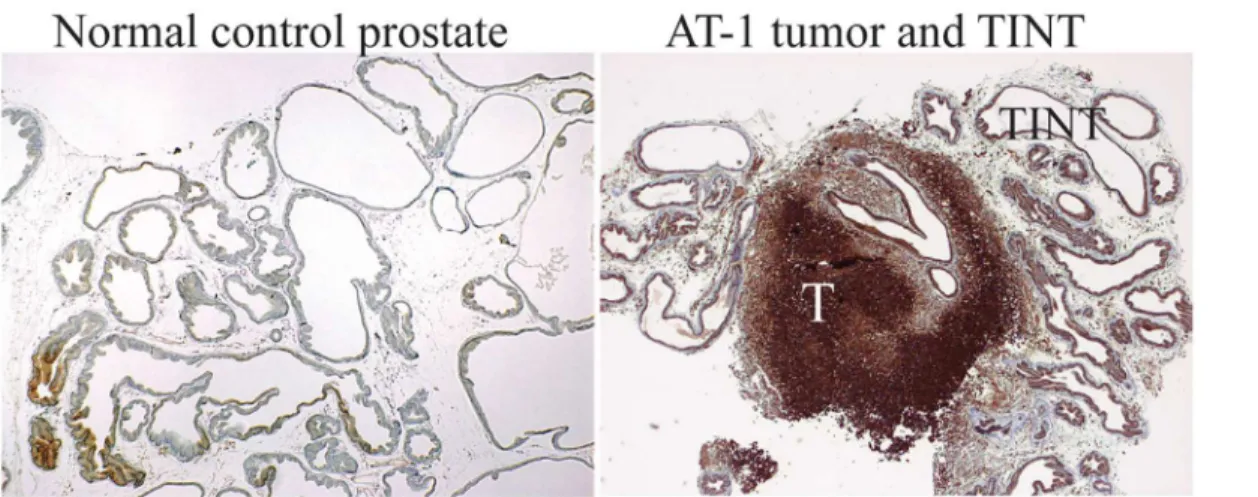
In order to study the effect of a tumor on the surrounding normal prostate tissue (TINT), we implanted rat AT-1 prostate tumor cells into the prostates of immune-competent rats and sac-rificed the animals at day 10 when the tumors were still surrounded by normal prostate tissue. In this animal model, TINT is the tumor-adjacent non-malignant rat prostate tissue, which contains both morphologically normal-appearing epithelium and stroma (S1 Fig).
As we injected presumably antigenic cells into fully immune-competent syngenic animals this should induce an acute immune response. This reaction could be unspecific and its magni-tude could be largely unrelated to the presence of a growing tumor, particularly as the time-point when we were able to examine TINT was early after tumor cell injection (already at day
10 the tumors occupied 64 ± 28% (SD),n= 11 of the whole prostate lobe). However, the host
response to a tumor in experimental models and in patients is strikingly similar to an
inflam-mation-like wound-response [3,5,16–19]. Tumors actually exploit their capacity to induce an
inflammatory reaction (characterized by accumulation of inflammatory cells, angiogenesis and altered extracellular matrix), by secreting factors that reeducate the accumulating
inflammato-ry cells to support tumor growth [20,21].
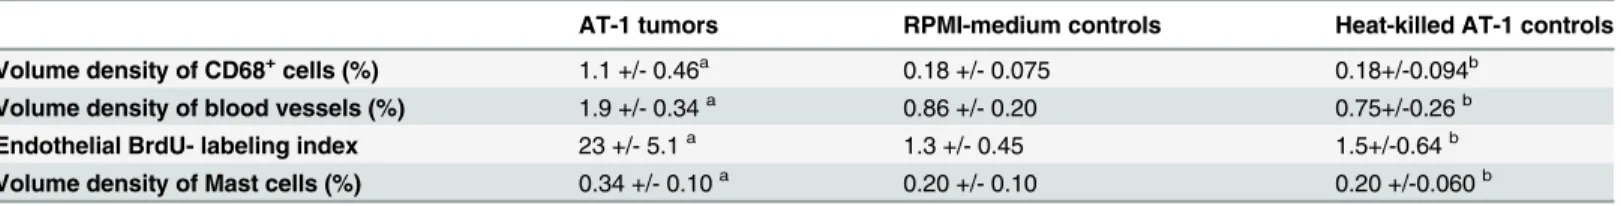
We therefore first considered whether our controls were appropriate before drawing any conclusions on how tumors may influence the tumor-bearing organ. By comparing and quanti-fying the normal prostate tissue reaction to local injection of RPMI medium, heat-killed tumor cells or to growing tumors, we conclude that the prostate tissue response to medium is very dis-crete and similar to that of heat-killed tumor cells and that these responses are of considerably lower magnitude that those induced by growing tumors (Table 1). Additionally, the morpholo-gy of the control injected prostate lobes was similar to that in the corresponding contralateral non-injected lobes (data not shown). Against this background we consider it appropriate to use RPMI-injected prostates as a control when describing tumor-induced gene expression changes in prostate tissue. Particularly as qRT-PCR examination showed only discrete differ-ences in gene expression between RPMI and heat-killed tumor cell injected prostates, and that gene expression in TINT was different from that in both these controls (see below).
The presence of a prostate tumor alters gene expression in the
surrounding tumor-bearing organ
In this study we are not able to completely exclude that single tumor cells could be present in the micro-dissected TINT tissue. However, the AT-1 tumors grew as single rounded tumors
with well defined borders and dissection with a margin>0.5 mm therefore likely avoided
tumor cell contamination (S1 Fig). Particularly as we never observed small clusters of AT1 cells, separated from the main tumor, in our immune-stained and extensively examined
paraf-fin embedded tissue samples. As the gene expression profile in AT-1 tumorsin vivowas
deter-mined we could also simulate (in-silico) AT-1 tumor contamination of different degrees in our normal samples. Adding from 0.1 to 20% of the average gene expression signals in tumor tissue to all our individual normal control samples did not make their gene expression pattern TINT-like and the individual samples still clustered at the same position as before (i.e. individual sam-ples initially found in group A1 did not move to group A2, data not shown). This and the find-ing that expressions of several genes were larger in TINT than in both tumor and normal tissue (see below) suggest that the TINT gene expression pattern is unlikely to be explained by tumor Table 1. Quantification of morphological changes in the tumor-bearing organ (TINT-changes) in rats carrying AT-1 tumors and in different controls.
AT-1 tumors RPMI-medium controls Heat-killed AT-1 controls
Volume density of CD68+cells (%) 1.1 +/- 0.46a 0.18 +/- 0.075 0.18+/-0.094b
Volume density of blood vessels (%) 1.9 +/- 0.34a 0.86 +/- 0.20 0.75+/-0.26b Endothelial BrdU- labeling index 23 +/- 5.1a 1.3 +/- 0.45 1.5+/-0.64b
Volume density of Mast cells (%) 0.34 +/- 0.10a 0.20 +/- 0.10 0.20 +/-0.060b
Values are means +/- SD,n= 7–9 animals in each group. aSigni
ficantly different than in both controls,
bNot signi
ficantly different from that in RPMI injected animals,p<0.05
doi:10.1371/journal.pone.0130076.t001
Fig 1. Unsupervised hierarchical clustering of samples based on the genome-wide expression profiles.Control-, TINT-, tumor samples, and the AT-1 cell line were clustered based on the entire microarray dataset. The dendogram shows two major groups; A) containing TINT- and normal prostate tissue samples, and B) containing all AT-1 tumor tissue samples and the AT-1 cell line. TINT: tumor-adjacent normal prostate tissue.
cell contamination. However, it should be noted that we cannot completely ensure that TINT samples were 100% tumor free.
Genes differentially expressed in TINT compared to normal prostate
control tissue suggest that there is an inflammatory and
matrix-reorganizing response in the tumor-bearing organ
We identified 5,888 genes with significantly different expression in TINT compared to control
samples (p<0.05, data not shown). To identify strong candidate genes that characterize TINT,
we selected genes with2-fold change,p<0.05, and a probe signal at least twice the
back-ground signal in at least one of the two groups.
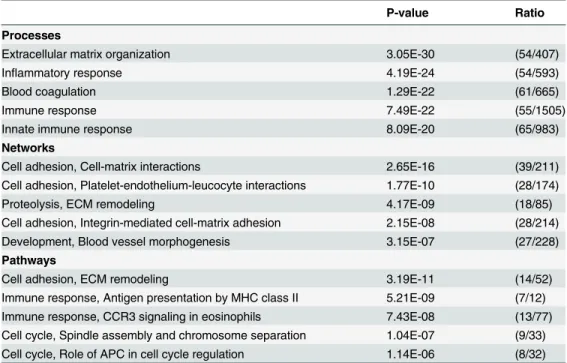
A total of 461 genes were identified; of these, expression of 423 genes was up-regulated and expression of 38 was down-regulated in TINT relative to normal prostate tissue (S1 Table). In addition, gene expression of the 461 candidate genes in AT-1 tumor tissue was compared to normal prostate control tissue using the same procedure (S1 Table). To characterize TINT and determine what biological processes the 461 candidate genes selected were associated with, we preformed a gene ontology analysis using GeneGo MetaCore software. As could be predicted
from our previous findings in this rat model (seeIntroduction), many of the genes altered in
TINT were related to processes such as inflammatory responses and organization of the extra-cellular matrix (ECM) (Table 2).
Irrespective of the obvious differences between a short-term rat tumor-implantation model and patients, our studies in prostate cancer patients suggest that some of the changes in TINT
seen in the rat model are also present in and related to tumor aggressiveness in patients—for
example, increased vascular density, accumulation of inflammatory cells, and alterations in the
extracellular matrix [1,8,9,13,22]. Altered gene expression in histologically normal
tumor-ad-jacent tissue relative to that in normal prostate tissue from men without prostate cancer has
Table 2. Ontology analysis of 461 TINT candidate genes.
P-value Ratio
Processes
Extracellular matrix organization 3.05E-30 (54/407)
Inflammatory response 4.19E-24 (54/593)
Blood coagulation 1.29E-22 (61/665)
Immune response 7.49E-22 (55/1505)
Innate immune response 8.09E-20 (65/983)
Networks
Cell adhesion, Cell-matrix interactions 2.65E-16 (39/211)
Cell adhesion, Platelet-endothelium-leucocyte interactions 1.77E-10 (28/174)
Proteolysis, ECM remodeling 4.17E-09 (18/85)
Cell adhesion, Integrin-mediated cell-matrix adhesion 2.15E-08 (28/214)
Development, Blood vessel morphogenesis 3.15E-07 (27/228)
Pathways
Cell adhesion, ECM remodeling 3.19E-11 (14/52)
Immune response, Antigen presentation by MHC class II 5.21E-09 (7/12) Immune response, CCR3 signaling in eosinophils 7.43E-08 (13/77) Cell cycle, Spindle assembly and chromosome separation 1.04E-07 (9/33) Cell cycle, Role of APC in cell cycle regulation 1.14E-06 (8/32)
Ratio: significantly altered genes in the experiment of all genes in the respective process/network/pathway.
also been found in other studies [17,23–26]. Collectively, they all show similarities in gene ex-pression between tumor-adjacent prostate tissue and tumor tissue. Importantly, and in line with our rat model, tumor-adjacent prostate tissue in patients is characterized by processes such as inflammation and wounding (see below) [17]. Gene expression in tumor-adjacent tis-sue in breast cancer patients is also characterized as a wounding response [27].
Changes in TINT could be induced by tumor-secreted factors and tissue
hypoxia
Some of the changes in gene expression in TINT are probably due to signals coming from the tumor to the surrounding tumor-bearing organ. Such signals may be soluble factors and/or microvesicles/exosomes [28]. For example, prostate tumor epithelial cells secrete factors that
attract inflammatory cells [7,29–32] and the TINT in turn expressed macrophage
chemo-at-tractants such as chemokine (C-C) ligand 2 (Ccl2) and colony-stimulating factor 1(Csf1).
Ex-pression of genes encoding markers of macrophages (Cd68) particularly of the
tumor-stimulating“M2 type”(Cd163,Mrc1,Mgl1,Folr2, andHmox1), lymphocytes (Cd8a), and mast
cells (the mast cell chymase geneCma1and the gene for mast cell antigen 32,Mca32) was thus
upregulated in TINT.
One key factor that induces changes in stroma cells in wounds and tumors is transforming
growth factorβ1 (Tgfb1) [33] and asTgfb1mRNA expression was increased in TINT and
tumor tissue (S1 Table), it could be an important inducer of TINT. Other regulatory systems of importance for prostate development and growth such as the Wnt- [34] and Slit-robo systems [35] could also be involved. Genes coupled to these systems and whose expression was found
to be upregulated in TINT includeSfrp2,Slit3,Robo-1, and the gene for disabled-2 (Dab2).
SFRP2 is an androgen-regulated inhibitor of Wnt signalling that is important during prostate development [34]. SLIT3, which is produced by the prostate stroma and stimulated by andro-gens, is important both during prostate development and for prostate cancer progression [34, 35]. DAB2 is a modulator of signalling downstream of the androgen receptor AR [36].
Interest-ingly, expression ofBcl2a1was also found to be upregulated in TINT, possibly making the
tis-sue more resistant to apoptosis. Altered AR function and up-regulation of expression of anti-apoptotic factors might explain the blunted response to castration in TINT prostate [6].
Prostate tumor epithelial cells also secrete factors that affect the fibromuscular stroma and
ECM within the tumor and in the surrounding TINT [1,37]. In line with this, we found here
that expression of genes encoding stroma-related factors, such asS100A4, periostin (
Postn_per-dicted),Sparc,CXCL12, various collagens (Col1a1,Col1a2,Col3a1,Col4a1,Col5a1,Col5a2,
Col6a1_predicted,Col6a3_predicted,Col8a1_predicted,Col14a1_predicted,Col15a), vimentin
(Vim), elastin (Eln), fibronectin (Fn1), and lysyl oxidase (Lox) was higher in TINT than in
con-trol tissue. Similarities between tumor stroma and TINT stroma [37] may suggest common un-derlying mechanisms. We therefore suggest that tumor cells send signals to both the adjacent tumor stroma and further away to the tumor-bearing organ to facilitate subsequent tumor growth. Some of these signals probably also have systemic effects. Changes seen in TINT have also been described in pre-metastatic niches, for example up-regulation of genes encoding
LOX, fibronectin, periostin, MMPs, and S100 proteins [5,28,38], suggesting that they could be
caused by similar signals from the tumor.
Rapid growth of a tumor inside the prostate may also result in some degree of hypoxia in the surrounding normal tissue. As many of the genes whose expression is upregulated in TINT
relative to normal prostate tissue are hypoxia-regulated—for example,Hmox,Lox, osteopontin
(Spp1), periostin (Postn_perdicted), and stroma-derived factor 1 (Cxcl12/Sdf-1), we evaluated
mmHg. In the AT-1 tumors, large areas of tumor epithelial cells were stained as previously
de-scribed [6,7]. The most intense staining was observed in areas remote from visible blood
ves-sels, whereas cells adjacent to vessels were largely unstained (Fig 2). In the tumor-adjacent tissue, some of the normal prostate epithelial cells also showed staining (Fig 2) and the percent-age of hypoxic prostate epithelial cells in TINT was larger than in medium injected controls
(8.6 ± 2.8% vs. 1.8 ± 1.4%;n= 7 to 10 in each group,p<0.001, Mann-Whitney U- test).
Al-though most of the hypoxia regulation of HIF does not occur at the mRNA level [39],Hif-1α
expression was upregulated 1.7-fold in TINT relative to normal prostate tissue (p= 0.01).
Hyp-oxia is therefore a likely underlying mechanism for some of the up-regulation of genes in TINT.
Gene expression patterns characterizing TINT
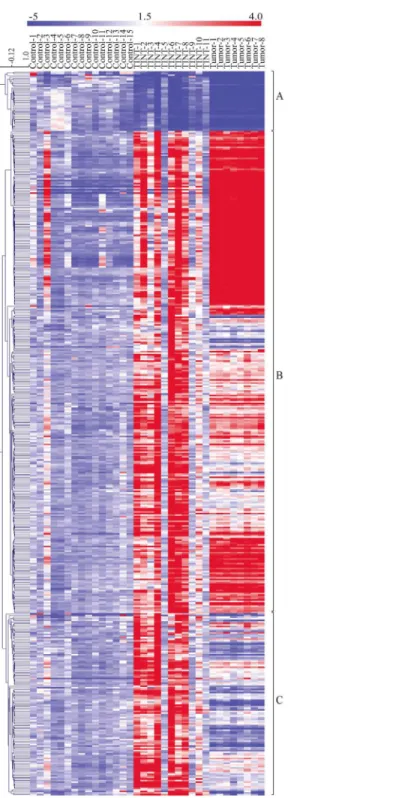
Furthermore, the differential expression in TINT relative to that in normal prostate tissue, with 461 significantly altered genes, was visualized in a clustering-based heatmap (Fig 3). The heat-map also included the expression levels of selected candidate genes in AT-1 tumor tissue rela-tive to controls. Hierarchical clustering of all samples resulted in 3 major groups of gene expression profiles (Fig 3).
Cluster A: Genes down-regulated in TINT relative to normal controls. The first cluster
contained 38 genes that were downregulated in TINT relative to controls (Fig 3). Expression of all of these genes was also found to be reduced in the tumor samples (Fig 3). This shows that tumor implantation can suppress expression of genes that are commonly repressed in tumors also in the surrounding normal tissue. In this group we, for example, find genes such as those
for glutathione S-transferases (Gst) M1,Gstm2,Gstm3,Gstm6, the membrane
metallo-endo-peptidase gene (Mme/Cd10), and the microseminoprotein gene (Msmb) (S2 Fig). Ontological
analyses show that the genes whose expression is downregulated in TINT are involved in bio-logical networks such as response to hypoxia and oxidative stress, and pathways such as gluta-thione metabolism (Table 3).
GTS enzymes protect against DNA damage and hypermethylation. Another GST enzyme, P1, is downregulated in human prostate epithelial cells as a consequence of chronic inflamma-tion. In addition, GST P1 is involved in the pathogenesis of prostate cancer and is commonly due to epigenetic changes downregulated in human prostate tumors [40]. It is therefore plausi-ble that inflammation also results in decreased expression of the other GST enzymes in the tumor-adjacent prostate tissue that we identified in this model.
Microseminoprotein is produced almost exclusively by prostate epithelial cells. In the pros-tate it is known to be a tumor suppressor, and reduced MSMB expression has been shown to be a potentially useful diagnostic and prognostic biomarker of prostate cancer in tissue and
serum [41,42]. Our results suggest that reduced synthesis of microseminoprotein in TINT
could contribute to reduced serum levels in patients with prostate cancer.
In line with our microarray results, although not fully verified by qRT-PCR, CD10 expres-sion has also been shown to be downregulated in the normal prostate tissue adjacent to
high-grade (Gleason 8–10) tumors [24]. However, Risk and co-workers found that 18 genes were
upregulated and 16 were down-regulated in human tumor-adjacent prostate tissue but none,
exceptCD10, were similar to those found in our rat model.
Cluster B: Genes altered in both TINT and tumor tissue relative to controls. The
sec-ond cluster contained 307 genes with altered gene expression in both TINT and tumor samples
relative to controls (Figs3andS2). The cluster mostly contained genes that had a similar
up-regulation in both TINT and tumor tissue and up-regulated genes with higher expression in
involvement of biological processes such as the immune system; stress and wounding re-sponses; biological networks such as cell adhesion, chemotaxis; and pathways such as Immune response, Antigen presentation by MHC class II (Table 3). The processes that lead to formation
of tumor stroma show similarities to the stroma of healing wounds [3,18,19,43]. The current
data suggest that TINT and tumor stroma could in part be shaped by similar factors.
Three genes of potential importance that were upregulated in both tumors and TINT were
osteopontin (Spp1),Tgfb1, and periostin (Postn). Osteopontin is produced by prostate cancer
epithelial cells [44] and macrophages, and serves as a signal from tumors to the bone marrow
to recruit cancer-supporting stroma cells [3,16]. Increased osteopontin levels in blood are
asso-ciated with poor prognosis in prostate cancer [45]. The present study suggests that osteopontin could also be produced by the tumor-adjacent normal prostate tissue. Increased expression and secretion of factors from the tumor-adjacent prostate tissue could thus amplify tumor sig-nals to the circulation. Small but aggressive tumor could by creating a large TINT zone there-fore have major systemic effects, for example by secretion of LOX and osteopontin also from the surrounding normal tissue (see [6] for discussion). Additional studies are needed to test this hypothesis and clarify the role of osteopontin in TINT.
Periostin, a TGF-beta and hypoxia-inducible protein whose expression has previously been shown to be upregulated in the stroma of a variety of tumors [46], was also found to be upregu-lated in rat prostate TINT and tumors. Periostin is mainly produced by prostate tumor stroma
cells, and high stoma periostin levels are associated with poor outcome [47–49]. As periostin is
an important regulator of several aspects of cancer including EMT [46] and metastatic coloni-zation [38], further studies are needed to investigate its role in TINT of the prostate.
Our results may indicate that current strategies to screen for novel cancer markers are
insuf-ficient, as—to date—only factors that are altered in tumors relative to surrounding (normal)
tissue have been considered to be potentially useful. However, this strategy may actually over-look some really useful markers, those highly altered in both the tumor and the tumor-bearing organ. Our results suggest that both tumors and TINT may actually share common factors (S2 FigandFig 3).
Cluster C: Genes that are exclusively up-regulated in TINT. The third cluster contained
116 genes that had greater expression in TINT than in controls and tumor tissue (Fig 3), sug-gesting that there may be markers that can differentiate TINT from both control prostate and tumor tissue. Some genes had upregulated expression in TINT and down-regulated expression Fig 2. Hypoxic areas in tumor and TINT tissues.Pimidazole staining (brown) of hypoxic tissue areas in normal sham injected control prostate tissue, in AT-1 tumors (T), and in the tumor-adjacent normal prostate tissue (TINT) and at day 10.
Fig 3. Heatmap showing the relative expression levels of genes differentially expressed between TINT and controls.The rows represent expression levels for each of the 461 genes that were differentially expressed between TINT and normal prostate control tissue and the columns represent the signature of each sample (normal, TINT and tumor). Red color illustrates higher expression than the mean expression in normal prostate tissue and blue illustrates lower expression. Genes were hierarchical clustered using average linkage clustering with a pearson correlation. Three major gene clusters were identified: A) genes down-regulated in TINT and tumour vs. normal tissue, B) genes mainly up-regulated in both TINT and tumor tissue vs. normal tissue and C) genes exclusively up-regulated in TINT vs. normal control tissue. TINT: tumor-adjacent normal prostate tissue.
in tumors—for example, the mast cell chymase gene (Cma1), the tumor necrosis factor
recep-tor superfamily member 11b (osteoprotegerin) gene (Tnfrsf11b), and the secreted frizzled
relat-ed protein 2 gene (Sfrp2). This demonstrates that changes in gene expression in TINT are
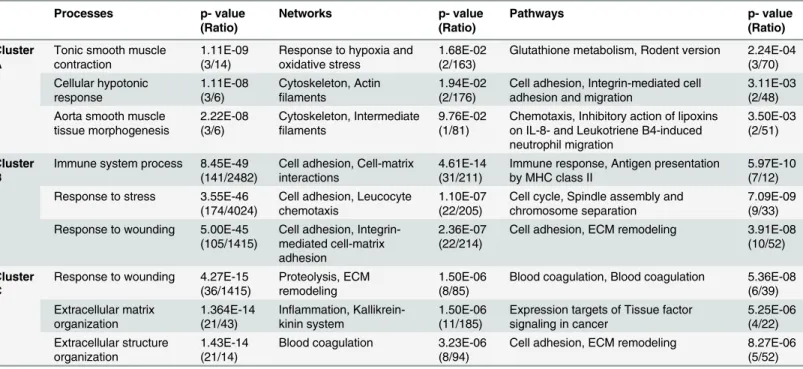
unlikely to be explained by the presence of tumor cells in the tissue (also see above). Factors that are specifically upregulated in TINT could be functionally important, as they indicate that certain processes have to be changed differently in TINT than in tumors. Ontological analysis showed that this group of genes is characterized by processes such as wounding and organiza-tion of the extracellular matrix, networks such as inflammaorganiza-tion and blood coagulaorganiza-tion, and pathways such as tissue factor signaling in cancer (Table 3).
Many genes in this cluster are associated with inflammation, for example those for
macro-phage markers (Cd68,Cd163, andHmox1), those for blood and lymph vessels (Lyve-1), and
those for extracellular matrix (Lox)and blood-coagulation proteins (Pai1,F3,F5,F13a1,A2m,
andPlat).
Several individual genes that were found to be differentially expressed in TINT are interest-ing and deserve special study, as they already have known biological functions in tumor stroma and as signals to remote organs. One highly upregulated factor was heme oxygenase 1 (from theHmox1gene), which has been shown to be regulated by cellular stress caused by for exam-ple hypoxia and inflammatory cytokines [50]. As HMOX-1 protects against cell damage, it is possible that some TINT-specific changes may be part of the host defense, but as HMOX-1
produces CO—resulting in vasodilatation and angiogenesis—it could also have
tumor-stimu-lating properties [50]. HMOX-1 has also been shown to facilitate tumor progression by sup-pressing the tumoral immune response [51]. Separate studies investigating the role of HMOX-1in TINT are in progress.
Lysyl oxidase (LOX) is an enzyme that is also stimulated by TGF-β1 and hypoxia and causes
cross-linkage between collagen and elastin (which were also upregulated in TINT) [52–55]. In
Table 3. Ontology analysis of genes in cluster A, B and C.
Processes p- value (Ratio)
Networks p- value
(Ratio)
Pathways p- value
(Ratio)
Cluster A
Tonic smooth muscle contraction
1.11E-09 (3/14)
Response to hypoxia and oxidative stress
1.68E-02 (2/163)
Glutathione metabolism, Rodent version 2.24E-04 (3/70) Cellular hypotonic response 1.11E-08 (3/6) Cytoskeleton, Actin filaments 1.94E-02 (2/176)
Cell adhesion, Integrin-mediated cell adhesion and migration
3.11E-03 (2/48) Aorta smooth muscle
tissue morphogenesis 2.22E-08 (3/6) Cytoskeleton, Intermediate filaments 9.76E-02 (1/81)
Chemotaxis, Inhibitory action of lipoxins on IL-8- and Leukotriene B4-induced neutrophil migration
3.50E-03 (2/51)
Cluster B
Immune system process 8.45E-49 (141/2482)
Cell adhesion, Cell-matrix interactions
4.61E-14 (31/211)
Immune response, Antigen presentation by MHC class II
5.97E-10 (7/12) Response to stress 3.55E-46
(174/4024)
Cell adhesion, Leucocyte chemotaxis
1.10E-07 (22/205)
Cell cycle, Spindle assembly and chromosome separation
7.09E-09 (9/33) Response to wounding 5.00E-45
(105/1415)
Cell adhesion, Integrin-mediated cell-matrix adhesion
2.36E-07 (22/214)
Cell adhesion, ECM remodeling 3.91E-08 (10/52)
Cluster C
Response to wounding 4.27E-15 (36/1415)
Proteolysis, ECM remodeling
1.50E-06 (8/85)
Blood coagulation, Blood coagulation 5.36E-08 (6/39) Extracellular matrix
organization
1.364E-14 (21/43)
Inflammation, Kallikrein-kinin system
1.50E-06 (11/185)
Expression targets of Tissue factor signaling in cancer
5.25E-06 (4/22) Extracellular structure organization 1.43E-14 (21/14)
Blood coagulation 3.23E-06 (8/94)
Cell adhesion, ECM remodeling 8.27E-06 (5/52)
Ratio: significantly altered genes in the experiment of all genes in the respective process/network/pathway.
this way, LOX may increase matrix stiffness and facilitate tumor growth [56]. Primary tumors, in response to hypoxia, secrete LOX that facilitates metastatic establishment by increasing the
stiffness in pre-metastatic niches [57,58]. LOX may therefore promote tumor growth by also
increasing stiffness in TINT. Further studies examining LOX in more detail are in progress. Other factors of possible importance that are upregulated in TINT are alpha-1
macroglobu-lin (encoded by theA2mgene) and alpha-1 anti-chymotrypsin (encoded bySerpina3n),
Serpi-na3nis upregulated in both TINT and tumor. Both of these proteases, which are produced by
prostate epithelial cells, form complexes with PSA and are therefore of importance for both PSA physiology in the prostate and for measuring PSA levels in blood [59]. The observation that their expression may be specifically increased in TINT should therefore be examined in greater detail.
Conformation of microarray data by qRT-PCR
Real-time PCR was performed to validate some of the observed changes in gene expression in TINT. Eleven of the 461 genes were selected because of their known biological function and
importance in prostate tissue (Hmox1,Lox,Cd68,Lpl,Cebp-beta,Cyr61,Mmp3,S100a4,
Tgf-bi,Mme,and Gtsm1). In line with the microarray results, expression ofHmox1,Cd68, Cebp-beta,Cyr61,Tgf-bi,Lox,Mmp3, andS100a4was found to be higher in TINT than in normal
prostate tissue (Table 4). Furthermore,Gstm1was conformed to be downregulated in TINT
relative to controls (Table 4). However, the expression of theLpl and Mmegenes in TINT was
not significantly different between groups (Table 4). The degree of variance between the RT-PCR and microarray data is unknown, but the variation seen could be due to the use of dif-ferent sets of animals. Despite this, nine of eleven genes were conformed to be altered in TINT using qRT-PCR. This shows that the differences in gene expression between TINT and normal prostate tissue that were identified by the microarray analysis were reliable. However, more studies are needed to confirm their expression and significance in prostate cancer patients.
Again, we examined if the choice of control was of importance for gene expression changes in TINT. Expressions of the selected genes in RPMI injected prostates were compared with heat-killed tumor cell injected controls (Table 4). Six of the eleven genes examined had signifi-cantly lower expression in prostates with heat-killed AT-1 cells compared to RPMI controls (Table 4), although the difference in fold change was low (-1.2 to -3.4). Five of the six signifi-cantly down-regulated genes in heat-killed vs. RPMI controls, were actually upregulated in
Table 4. qRT-PCR validation of selected gene.
Genes Fold-change TINT vs. RPMI control (microarray)
p-value Fold-change TINT vs. RPMI control (qRT-PCR)
p-value Fold-change heat-killed AT-1 vs. RPMI control (qRT-PCR)
p-value
Lox 5.2 0.001 3.4 0.021 -1.9 0.043
Hmox1 14.5 0.001 50.9 0.000 -1.2 0.290
Cd68 4.9 0.007 11.3 0.007 -1.1 0.211
Lpl 5.3 0.027 -1.7 0.630 -1.2 0.749
Cebp-beta
2.3 0.009 7.8 0.001 -2.6 0.008
Cyr61 2.2 0.010 5.4 0.002 1.6 0.298
Mmp3 2.6 0.017 5.1 0.003 -3.4 0.013
S100a4 5.2 0.003 20.2 0.002 -1.2 0.036
Tgf-beta 2.4 0.008 31.3 0.003 -1.3 0.037
Mme -2.0 0.009 -1.7 0.211 -1.5 0.012
Gstm1 -2.0 0.001 -1.5 0.016 1.0 0.923
TINT compared to RPMI controls (Table 4). The remaining 5 genes were not significantly dif-ferent between the two control groups. The morphological changes (Table 1) and the changes in gene expression pattern in TINT thus appear to be related to the presence of a growing tumor and not to the choice of control.
Conclusion
Using an animal model, we have shown that histologically normal prostate tissue adjacent to a tumor has a unique gene expression signature relative to normal tumor-free prostate tissue. This shows that the presence of a tumor induces changes in gene expression in the surrounding tumor-bearing organ. Studies are now underway to determine the kinetics of this response and how it differs in prostate tissue surrounding tumors with different aggressiveness. The ultimate aim is to identify candidate genes that could possibly serve as novel diagnostic or prognostic markers and/or therapeutic targets for prostate cancer.
Supporting Information
S1 Fig. Orthotopic AT-1 tumor model.2x103AT-1 rat prostate tumor cells were injected to
the one of the ventral prostate lobes of immune competent Copenhagen rats and tumors were analyzed at day 10. Tumor instructed normal tissue (TINT) is defined as prostate tissue more than 0.5mm from the tumor border.
(TIF)
S2 Fig. High resolution Heatmap. (TIF)
S1 Table. Candidate genes.List of 461 significantly altered genes in TINT relative to normal
prostate tissue. (DOCX)
Acknowledgments
We thank Sigrid Kilter, Pernilla Andersson, Susanne Gidlund, and Birgitta Ekblom for skilful technical assistance.
Author Contributions
Conceived and designed the experiments: HA SHB AB. Performed the experiments: HA SHB AB. Analyzed the data: HA AB SHB. Contributed reagents/materials/analysis tools: HA SHB AB. Wrote the paper: HA SHB AB.
References
1. Halin S, Hammarsten P, Adamo H, Wikstrom P, Bergh A. Tumor indicating normal tissue could be a new source of diagnostic and prognostic markers for prostate cancer. Expert Opin Med Diagn. 2011; 5 (1):37–47. Epub 2011/01/01. doi:10.1517/17530059.2011.540009PMID:23484475.
2. Van Neste L, Herman JG, Otto G, Bigley JW, Epstein JI, Van Criekinge W. The epigenetic promise for prostate cancer diagnosis. Prostate. 2012; 72(11):1248–61. Epub 2011/12/14. doi:10.1002/pros.
22459PMID:22161815.
3. Hanahan D, Weinberg RA. Hallmarks of cancer: the next generation. Cell. 2011; 144(5):646–74. Epub
2011/03/08. doi:10.1016/j.cell.2011.02.013PMID:21376230.
4. McAllister SS, Weinberg RA. The tumour-induced systemic environment as a critical regulator of can-cer progression and metastasis. Nature cell biology. 2014; 16(8):717–27. doi:10.1038/ncb3015PMID:
5. Sleeman JP. The metastatic niche and stromal progression. Cancer Metastasis Rev. 2012; 31(3–
4):429–40. Epub 2012/06/16. doi:10.1007/s10555-012-9373-9PMID:22699312; PubMed Central
PMCID: PMC3470821.
6. Halin S, Hammarsten P, Wikstrom P, Bergh A. Androgen-insensitive prostate cancer cells transiently respond to castration treatment when growing in an androgen-dependent prostate environment. Pros-tate. 2007; 67(4):370–7. Epub 2006/12/29. doi:10.1002/pros.20473PMID:17192959.
7. Halin S, Rudolfsson SH, Van Rooijen N, Bergh A. Extratumoral macrophages promote tumor and vas-cular growth in an orthotopic rat prostate tumor model. Neoplasia. 2009; 11(2):177–86. Epub 2009/01/
30. PMID:19177202; PubMed Central PMCID: PMC2631142.
8. Johansson A, Rudolfsson S, Hammarsten P, Halin S, Pietras K, Jones J, et al. Mast cells are novel in-dependent prognostic markers in prostate cancer and represent a target for therapy. Am J Pathol. 2010; 177(2):1031–41. Epub 2010/07/10. doi:10.2353/ajpath.2010.100070PMID:20616342; PubMed
Central PMCID: PMC2913352.
9. Josefsson A, Adamo H, Hammarsten P, Granfors T, Stattin P, Egevad L, et al. Prostate cancer in-creases hyaluronan in surrounding nonmalignant stroma, and this response is associated with tumor growth and an unfavorable outcome. Am J Pathol. 2011; 179(4):1961–8. Epub 2011/08/23. doi:10.
1016/j.ajpath.2011.06.005PMID:21854754; PubMed Central PMCID: PMC3181394.
10. Wikstrom P, Marusic J, Stattin P, Bergh A. Low stroma androgen receptor level in normal and tumor prostate tissue is related to poor outcome in prostate cancer patients. Prostate. 2009; 69(8):799–809.
Epub 2009/02/04. doi:10.1002/pros.20927PMID:19189305.
11. Hammarsten P, Karalija A, Josefsson A, Rudolfsson SH, Wikstrom P, Egevad L, et al. Low levels of phosphorylated epidermal growth factor receptor in nonmalignant and malignant prostate tissue predict favorable outcome in prostate cancer patients. Clin Cancer Res. 2010; 16(4):1245–55. Epub 2010/02/
11. doi:10.1158/1078-0432.CCR-09-0103PMID:20145160.
12. Hagglof C, Hammarsten P, Josefsson A, Stattin P, Paulsson J, Bergh A, et al. Stromal PDGFRbeta ex-pression in prostate tumors and non-malignant prostate tissue predicts prostate cancer survival. PloS one. 2010; 5(5):e10747. Epub 2010/05/28. doi:10.1371/journal.pone.0010747PMID:20505768; PubMed Central PMCID: PMC2873980.
13. Josefsson A, Wikstrom P, Egevad L, Granfors T, Karlberg L, Stattin P, et al. Low endoglin vascular den-sity and Ki67 index in Gleason score 6 tumours may identify prostate cancer patients suitable for sur-veillance. Scand J Urol Nephrol. 2012; 46(4):247–57. Epub 2012/03/29. doi:10.3109/00365599.2012.
669791PMID:22452635.
14. Stenman K, Stattin P, Stenlund H, Riklund K, Grobner G, Bergh A. H HRMAS NMR Derived Bio-mark-ers Related to Tumor Grade, Tumor Cell Fraction, and Cell Proliferation in Prostate Tissue Samples. Biomark Insights. 2011; 6:39–47. Epub 2011/04/19. doi:10.4137/BMI.S6794PMID:21499438;
PubMed Central PMCID: PMC3076017.
15. Isaacs JT, Isaacs WB, Feitz WF, Scheres J. Establishment and characterization of seven Dunning rat prostatic cancer cell lines and their use in developing methods for predicting metastatic abilities of pros-tatic cancers. Prostate. 1986; 9(3):261–81. Epub 1986/01/01. PMID:3774632.
16. McAllister SS, Gifford AM, Greiner AL, Kelleher SP, Saelzler MP, Ince TA, et al. Systemic endocrine in-stigation of indolent tumor growth requires osteopontin. Cell. 2008; 133(6):994–1005. doi:10.1016/j.
cell.2008.04.045PMID:18555776.
17. Chandran UR, Dhir R, Ma C, Michalopoulos G, Becich M, Gilbertson J. Differences in gene expression in prostate cancer, normal appearing prostate tissue adjacent to cancer and prostate tissue from cancer free organ donors. BMC Cancer. 2005; 5:45. doi:10.1186/1471-2407-5-45PMID:15892885; PubMed Central PMCID: PMC1173092.
18. Dvorak HF. Tumors: wounds that do not heal. Similarities between tumor stroma generation and wound healing. The New England journal of medicine. 1986; 315(26):1650–9. doi:10.1056/
NEJM198612253152606PMID:3537791.
19. Schafer M, Werner S. Cancer as an overhealing wound: an old hypothesis revisited. Nat Rev Mol Cell Biol. 2008; 9(8):628–38. doi:10.1038/nrm2455PMID:18628784.
20. Qian BZ, Pollard JW. Macrophage diversity enhances tumor progression and metastasis. Cell. 2010; 141(1):39–51. doi:10.1016/j.cell.2010.03.014PMID:20371344.
21. Quail DF, Joyce JA. Microenvironmental regulation of tumor progression and metastasis. Nature medi-cine. 2013; 19(11):1423–37. doi:10.1038/nm.3394PMID:24202395; PubMed Central PMCID:
PMC3954707.
23. Kosari F, Cheville JC, Ida CM, Karnes RJ, Leontovich AA, Sebo TJ, et al. Shared gene expression al-terations in prostate cancer and histologically benign prostate from patients with prostate cancer. Am J Pathol. 2012; 181(1):34–42. doi:10.1016/j.ajpath.2012.03.043PMID:22640805; PubMed Central
PMCID: PMC3388167.
24. Risk MC, Knudsen BS, Coleman I, Dumpit RF, Kristal AR, LeMeur N, et al. Differential gene expression in benign prostate epithelium of men with and without prostate cancer: evidence for a prostate cancer field effect. Clin Cancer Res. 2010; 16(22):5414–23. doi:10.1158/1078-0432.CCR-10-0272PMID:
20935156; PubMed Central PMCID: PMC2992073.
25. Rizzi F, Belloni L, Crafa P, Lazzaretti M, Remondini D, Ferretti S, et al. A novel gene signature for mo-lecular diagnosis of human prostate cancer by RT-qPCR. PloS one. 2008; 3(10):e3617. doi:10.1371/ journal.pone.0003617PMID:18974881; PubMed Central PMCID: PMC2570792.
26. Yu YP, Landsittel D, Jing L, Nelson J, Ren B, Liu L, et al. Gene expression alterations in prostate cancer predicting tumor aggression and preceding development of malignancy. J Clin Oncol. 2004; 22 (14):2790–9. doi:10.1200/JCO.2004.05.158PMID:15254046.
27. Troester MA, Lee MH, Carter M, Fan C, Cowan DW, Perez ER, et al. Activation of host wound re-sponses in breast cancer microenvironment. Clin Cancer Res. 2009; 15(22):7020–8. doi:10.1158/
1078-0432.CCR-09-1126PMID:19887484; PubMed Central PMCID: PMC2783932.
28. Peinado H, Lavotshkin S, Lyden D. The secreted factors responsible for pre-metastatic niche formation: old sayings and new thoughts. Semin Cancer Biol. 2011; 21(2):139–46. doi:10.1016/j.semcancer.
2011.01.002PMID:21251983.
29. Vindrieux D, Escobar P, Lazennec G. Emerging roles of chemokines in prostate cancer. Endocr Relat Cancer. 2009; 16(3):663–73. doi:10.1677/ERC-09-0109PMID:19556286.
30. Sfanos KS, De Marzo AM. Prostate cancer and inflammation: the evidence. Histopathology. 2012; 60 (1):199–215. doi:10.1111/j.1365-2559.2011.04033.xPMID:22212087.
31. Macoska JA. Chemokines and BPH/LUTS. Differentiation. 2011; 82(4–5):253–60. doi:10.1016/j.diff.
2011.04.003PMID:21600689; PubMed Central PMCID: PMC3161128.
32. Zhang J, Patel L, Pienta KJ. CC chemokine ligand 2 (CCL2) promotes prostate cancer tumorigenesis and metastasis. Cytokine Growth Factor Rev. 2010; 21(1):41–8. Epub 2009/12/17. doi:10.1016/j.
cytogfr.2009.11.009S1359-6101(09)00116-6 [pii]. PMID:20005149; PubMed Central PMCID: PMC2857769.
33. Drabsch Y, ten Dijke P. TGF-beta signalling and its role in cancer progression and metastasis. Cancer Metastasis Rev. 2012; 31(3–4):553–68. Epub 2012/06/21. doi:10.1007/s10555-012-9375-7PMID:
22714591.
34. Pritchard CC, Nelson PS. Gene expression profiling in the developing prostate. Differentiation. 2008; 76(6):624–40. doi:10.1111/j.1432-0436.2008.00274.xPMID:18462436.
35. Latil A, Chene L, Cochant-Priollet B, Mangin P, Fournier G, Berthon P, et al. Quantification of expres-sion of netrins, slits and their receptors in human prostate tumors. Int J Cancer. 2003; 103(3):306–15.
Epub 2002/12/10. doi:10.1002/ijc.10821PMID:12471613.
36. Zhoul J, Hernandez G, Tu SW, Huang CL, Tseng CP, Hsieh JT. The role of DOC-2/DAB2 in modulating androgen receptor-mediated cell growth via the nongenomic c-Src-mediated pathway in normal pros-tatic epithelium and cancer. Cancer Res. 2005; 65(21):9906–13. doi:
10.1158/0008-5472.CAN-05-1481PMID:16267015.
37. Hagglof C, Bergh A. The stroma-a key regulator in prostate function and malignancy. Cancers (Basel). 2012; 4(2):531–48. doi:10.3390/cancers4020531PMID:24213323; PubMed Central PMCID:
PMC3712705.
38. Malanchi I, Santamaria-Martinez A, Susanto E, Peng H, Lehr HA, Delaloye JF, et al. Interactions be-tween cancer stem cells and their niche govern metastatic colonization. Nature. 2012; 481(7379):85–9.
doi:10.1038/nature10694PMID:22158103.
39. Semenza GL. Hypoxia-inducible factors in physiology and medicine. Cell. 2012; 148(3):399–408. doi:
10.1016/j.cell.2012.01.021PMID:22304911; PubMed Central PMCID: PMC3437543.
40. Nelson WG, De Marzo AM, Yegnasubramanian S. Epigenetic alterations in human prostate cancers. Endocrinology. 2009; 150(9):3991–4002. doi:10.1210/en.2009-0573PMID:19520778; PubMed
Cen-tral PMCID: PMC2736081.
41. Dahlman A, Rexhepaj E, Brennan DJ, Gallagher WM, Gaber A, Lindgren A, et al. Evaluation of the prognostic significance of MSMB and CRISP3 in prostate cancer using automated image analysis. Mod Pathol. 2011; 24(5):708–19. doi:10.1038/modpathol.2010.238PMID:21240253.
in tissue and urine. PloS one. 2010; 5(10):e13363. doi:10.1371/journal.pone.0013363PMID: 20967219; PubMed Central PMCID: PMC2954177.
43. Arwert EN, Hoste E, Watt FM. Epithelial stem cells, wound healing and cancer. Nat Rev Cancer. 2012; 12(3):170–80. doi:10.1038/nrc3217PMID:22362215.
44. Forootan SS, Foster CS, Aachi VR, Adamson J, Smith PH, Lin K, et al. Prognostic significance of osteo-pontin expression in human prostate cancer. Int J Cancer. 2006; 118(9):2255–61. doi:10.1002/ijc.
21619PMID:16331611.
45. Thoms JW, Dal Pra A, Anborgh PH, Christensen E, Fleshner N, Menard C, et al. Plasma osteopontin as a biomarker of prostate cancer aggression: relationship to risk category and treatment response. Br J Cancer. 2012; 107(5):840–6. doi:10.1038/bjc.2012.345PMID:22871886; PubMed Central PMCID:
PMC3425969.
46. Morra L, Moch H. Periostin expression and epithelial-mesenchymal transition in cancer: a review and an update. Virchows Arch. 2011; 459(5):465–75. doi:10.1007/s00428-011-1151-5PMID:21997759;
PubMed Central PMCID: PMC3205268.
47. Tischler V, Fritzsche FR, Wild PJ, Stephan C, Seifert HH, Riener MO, et al. Periostin is up-regulated in high grade and high stage prostate cancer. BMC Cancer. 2010; 10:273. doi: 10.1186/1471-2407-10-273PMID:20534149; PubMed Central PMCID: PMC2903527.
48. Tsunoda T, Furusato B, Takashima Y, Ravulapalli S, Dobi A, Srivastava S, et al. The increased expres-sion of periostin during early stages of prostate cancer and advanced stages of cancer stroma. Pros-tate. 2009; 69(13):1398–403. doi:10.1002/pros.20988PMID:19479898.
49. Sun C, Zhao X, Xu K, Gong J, Liu W, Ding W, et al. Periostin: a promising target of therapeutical inter-vention for prostate cancer. J Transl Med. 2011; 9:99. doi:10.1186/1479-5876-9-99PMID:21714934; PubMed Central PMCID: PMC3146429.
50. Was H, Dulak J, Jozkowicz A. Heme oxygenase-1 in tumor biology and therapy. Curr Drug Targets. 2010; 11(12):1551–70. Epub 2010/08/14. BSP/CDT/E-Pub/00150 [pii]. PMID:20704546.
51. Arnold J, Magiera L, Kraman M, Fearon D. Tumoral Immune Suppression by Macrophages Expressing Fibroblast Activation Protein-a and Heme Oxygenase-1. Cancer Immunol Res. 2014; 2:121–6. doi:10.
1158/2326-6066.CIR-13-0150PMID:24778275
52. Erler JT, Giaccia AJ. Lysyl oxidase mediates hypoxic control of metastasis. Cancer Res. 2006; 66 (21):10238–41. doi:10.1158/0008-5472.CAN-06-3197PMID:17079439.
53. Denko NC, Fontana LA, Hudson KM, Sutphin PD, Raychaudhuri S, Altman R, et al. Investigating hyp-oxic tumor physiology through gene expression patterns. Oncogene. 2003; 22(37):5907–14. Epub
2003/08/30. doi:10.1038/sj.onc.12067031206703 [pii]. PMID:12947397.
54. Ren C, Yang G, Timme TL, Wheeler TM, Thompson TC. Reduced lysyl oxidase messenger RNA levels in experimental and human prostate cancer. Cancer Res. 1998; 58(6):1285–90. Epub 1998/03/27.
PMID:9515817.
55. Taylor MA, Amin JD, Kirschmann DA, Schiemann WP. Lysyl oxidase contributes to mechanotransduc-tion-mediated regulation of transforming growth factor-beta signaling in breast cancer cells. Neoplasia. 2011; 13(5):406–18. Epub 2011/05/03. PMID:21532881; PubMed Central PMCID: PMC3084617.
56. Levental KR, Yu H, Kass L, Lakins JN, Egeblad M, Erler JT, et al. Matrix crosslinking forces tumor pro-gression by enhancing integrin signaling. Cell. 2009; 139(5):891–906. doi:10.1016/j.cell.2009.10.027
PMID:19931152; PubMed Central PMCID: PMC2788004.
57. Erler JT, Bennewith KL, Nicolau M, Dornhofer N, Kong C, Le QT, et al. Lysyl oxidase is essential for hypoxia-induced metastasis. Nature. 2006; 440(7088):1222–6. doi:10.1038/nature04695PMID:
16642001.
58. Erler JT, Bennewith KL, Cox TR, Lang G, Bird D, Koong A, et al. Hypoxia-induced lysyl oxidase is a crit-ical mediator of bone marrow cell recruitment to form the premetastatic niche. Cancer Cell. 2009; 15 (1):35–44. doi:10.1016/j.ccr.2008.11.012PMID:19111879; PubMed Central PMCID: PMC3050620.