Decarboxylase 65 Using DQ8 Tetramers Reveals a
Pathogenic Role of GAD65 121–140 and GAD65 250–266
in T1D Development
I-Ting Chow1, Junbao Yang1, Theresa J. Gates1, Eddie A. James1, Duy T. Mai1, Carla Greenbaum1, William W. Kwok1,2*
1Benaroya Research Institute at Virginia Mason, Seattle, WA, United States of America,2Department of Medicine, University of Washington, Seattle, WA, United States of America
Abstract
Susceptibility to type 1 diabetes (T1D) is strongly associated with MHC class II molecules, particularly HLA-DQ8 (DQ8: DQA1*03:01/DQB1*03:02). Monitoring T1D-specific T cell responses to DQ8-restricted epitopes may be key to understanding the immunopathology of the disease. In this study, we examined DQ8-restricted T cell responses to glutamic acid decarboxylase 65 (GAD65) using DQ8 tetramers. We demonstrated that GAD65121–140 and GAD65250–266 elicited responses from DQ8+subjects. Circulating CD4+T cells specific for these epitopes were detected significantly more
often in T1D patients than in healthy individuals after in vitro expansion. T cell clones specific for GAD65121–140 and GAD65250–266 carried a Th1-dominant phenotype, with some of the GAD65121–140-specific T cell clones producing IL-17. GAD65250–266-specific CD4+T cells could also be detected by direct ex vivo staining. Analysis of unmanipulated peripheral blood mononuclear cells (PBMCs) revealed that GAD65250–266-specific T cells could be found in both healthy and diabetic individuals but the frequencies of specific T cells were higher in subjects with type 1 diabetes. Taken together, our results suggest a proinflammatory role for T cells specific for DQ8-restricted GAD65121–140and GAD65250–266epitopes and implicate their possible contribution to the progression of T1D.
Citation:Chow I-T, Yang J, Gates TJ, James EA, Mai DT, et al. (2014) Assessment of CD4+T Cell Responses to Glutamic Acid Decarboxylase 65 Using DQ8 Tetramers Reveals a Pathogenic Role of GAD65 121–140 and GAD65 250–266 in T1D Development. PLoS ONE 9(11): e112882. doi:10.1371/journal.pone.0112882
Editor:Matthias G. von Herrath, La Jolla Institute for Allergy and Immunology, United States of America
ReceivedJuly 7, 2014;AcceptedOctober 19, 2014;PublishedNovember 18, 2014
Copyright:ß2014 Chow et al. This is an open-access article distributed under the terms of the Creative Commons Attribution License, which permits unrestricted use, distribution, and reproduction in any medium, provided the original author and source are credited.
Data Availability:The authors confirm that all data underlying the findings are fully available without restriction. All relevant data are within the paper and its Supporting Information files.
Funding:This work was supported by JDRF center funding for Translational Research at BRI and DP3 DK097653 grant from National Institutes of Health. The funders had no role in study design, data collection and analysis, decision to publish, or preparation of the manuscript.
Competing Interests:The authors have declared that no competing interests exist. * Email: [email protected]
Introduction
Type 1 diabetes (T1D) results from destruction of the insulin-producing beta cells of the pancreas. A number of genes have been implicated in T1D development, but genes within the HLA class II region confer most of the disease risk [1]; in particular, it is estimated that 90% of T1D subjects have either an HLA-DQ8 or DQ2 allele [2]. Subjects with the DRB1*04:01 (DR0401)-DQ8 haplotype have an odds ratio of 8.4 for T1D [3], and the predisposing effect of this haplotype is supported by meta-analysis of data sets from different geographic regions [4]. In accordance with the importance of MHC class II molecules in antigen presentation, DQ8-restricted CD4+ T cells are likely to have an essential and pathogenic role in the progression of T1D.
A special feature of DQ8 is the absence of an aspartic acid residue at position 57 of the beta chain [5]. Lack of this Asp residue at beta 57 leads to reduced affinity for antigenic peptides, giving rise to diabetic pathology as a result of ineffective tolerance induction in the thymus [6,7]. Identification and characterization of DQ8-restricted self-epitopes may be key to comprehending
DQ8-mediated autoimmunity. A number of DQ8-restriced self-epitopes have been identified using DQ8 transgenic mice (for a recent review see [8]). Some of the reported peptides also elicit responses in HLA-DQ8+ individuals. However, monitoring of specific CD4+T cells during the progression of diabetes, especially direct assessment of responses in the periphery, has been hampered by low frequencies of effector cells [9] and heteroge-neity of the disease.
presence of autoantibodies, will facilitate disease prediction and prevention.
In this study, we investigated DQ8-restricted CD4+ T cell responses to GAD65. Responses of CD4+ T lymphocytes from T1D subjects to GAD65121–140and GAD65250–266were visualized
using DQ8 tetramers after in vitro expansion of antigen-specific cells with the relevant peptides. In vitro responses and intracellular cytokine staining suggested a strong association of GAD65121–140
and GAD65250–266 to the disease. Direct ex vivo staining of
peripheral blood mononuclear cells (PBMCs) for GAD65250–266
revealed higher frequencies of CD4+and CD4+CD45RO+T cells in the T1D group. Collectively, our work indicates that T cells specific for GAD65121–140 and GAD65250–266 may contribute to
the pathogenesis of T1D, and suggests GAD65250–266–specific T
cells as a potential biomarker for T1D.
Results
CD4+T cell responses to GAD65121–140and GAD65250–266
are detected more often in subjects with type 1 diabetes after in vitro expansion
Seven peptides derived from GAD65 were selected in this study to evaluate their relevance to the progression of autoimmune diabetes. All seven peptides are immunogenic in DQ8 transgenic mice [17–19], but DQ8-restricted responses in human subjects were not well demonstrated. Among the seven peptides, GAD65121–140, GAD65206–220, GAD65250–266 bound to DQ8
with strong affinities (Table 1). The IC50values of GAD65121–140,
GAD65206–220, and GAD65250–266 were comparable to that of
influenza A/Puerto Rico/8/34 Matrix Protein M1 (H1MP185–204)
epitope.
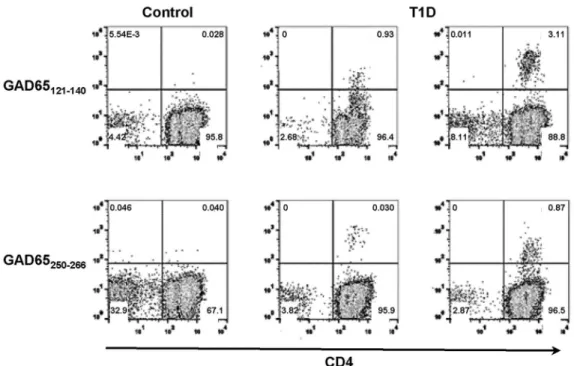
The three strong DQ8 binders were used to stimulate CD4+T cells from DQ8+ T1D subjects. After two-week stimulation, GAD65121–140and GAD65250–266elicited CD4+T cell responses
in multiple subjects. Examples of positive tetramer staining for the two epitopes that elicited responses are shown in Fig. 1. Responses to GAD65206–220 were negative in five T1D subjects examined
and were not further investigated. The association of GAD65121– 140 and GAD65250–266 with T1D was next examined by
comparing the prevalence of specific CD4+ T cell responses in T1D patients and healthy controls. GAD65121–140- and
GAD65250–266-specific CD4+T cell responses were detected more
often in T1D subjects than controls (GAD65121–140: 6/10 T1D
and 0/9 controls (p= 0.0108); GAD65250–266: 9/17 T1D and 1/
11 controls (Table 2,p= 0.0407);pvalue evaluated by two-tailed Fisher’s exact tests), demonstrating a clear association of DQ8-restricted GAD65 T cell responses with disease.
DQ8-restricted self-epitopes elicit pathogenic responses
Self-peptides can modulate autoimmunity by induction of pathogenic (Th1/Th17) or suppressive (Th2/Treg) responses. To examine functional properties of DQ8-restricted self epitopes, GAD65121–140- and GAD65250–266-specific CD4+ T cells were
cloned from in vitro expanded cultures of multiple subjects with type 1 diabetes. Representative tetramer staining for a GAD65121– 140and a GAD65250–266 clone is shown in Fig. 2A. These DQ8
tetramer-sorted clones were antigen-specific and the responses could be blocked by anti-DQ (SPVL3) antibodies (Fig. 2B). The GAD65-specific cells were assayed for cytokine production by intracellular cytokine staining (ICS) (Fig. S1A). All GAD65250–266
-specific clones produced Th1-type cytokine IFN-c(Fig. 2C). One GAD65250–266-specific clone also produced IL-4, but production
of IFN-cwas still dominant in these cells (Fig. S1B). IL-17 was not detected in GAD65250–266cells. The ICS data were in agreement
with the cytokine ELISA results as IFN-cwas the main cytokine secreted from GAD65250–266 clones after peptide specific
stimu-lation (Fig. 2D). Conversely, the cytokine profile for the four GAD65121–140-specific T clones was more diversified. Two
GAD65121–140-specific clones isolated from different patients
produced IL-17 (Fig. 2C). One of the IL-17-producing cells exhibited a Th1/Th17 double positive phenotype by co-express-ing IFN-c. Production of IL-17 was not a result of in vitro priming of naı¨ve cells, as cells isolated from the memory population (CD45RA-CD4+) maintained the Th17-like phenotype (data not shown). The two IL-17-negative GAD65121–140-specific clones
were positive for IFN- c, IL-4, and IL-10. However, these two clones might have distinct functionality as suggested by the ratio of IFN-cto IL-4 producing cells (Fig. S1B) and the cytokine ELISA results (Fig. 2D). Although multiple clones isolated from one donor might be the same T cell captured at different stages of differentiation, our T cell clone data from different patients suggest that DQ8-restricted GAD65-specific epitopes could induce proinflammatory responses in T1D subjects.
Higher frequencies of GAD65250–266-specific T cells are
observed in subjects with type 1 diabetes
In vitro responses can be affected by numbers and activity of monocytes and lymphocytes in the blood samples. To confirm the disease association of DQ8/GAD65-specific cells in an unmanip-ulated state, ex vivo tetramer staining was performed for DQ8-specific T cells in DQ8+patients and DQ8+controls (average age for patients: 28.8, and for controls: 34.6, p= 0.2809). Direct ex vivo analysis was able to detect GAD65250–266-specific CD4+ T
cells in DQ8+ subjects, but not for GAD65121–140-specific cells
Table 1.List of DQ8-restricted GAD65 peptides used in this study.
Peptide IC50(mM) Sequence
GAD65 121–140 1.6 YVVKSFDRSTKVIDFHYPNE
GAD65 176–190 .50 PRYFNQLSTGLDMVG
GAD65 206–220 1.5 TYEIAPVFVLLEYVT
GAD65 250–266 2.3 AMMIARFKMFPEVKEKG
GAD65 427–441 .50 FQQDKHYDLSYDTGD
GAD65 461–475 .50 AKGTTGFEAHVDKCL
GAD65 508–521 .50 YIPPSLRTLEDNEE
*IC50value for the control H1MP185–204peptide was 1.4mM.
(Fig. S2A and S2B). The unsuccessful detection might be due to low avidity or low frequencies of T cells specific for DQ8/ GAD65121–140. A representative ex vivo staining for DQ8/
GAD65250–266 from one T1D and one healthy subject is shown
in Fig. 3A. The ex vivo staining for DQ8/GAD65250–266is specific
as these cells can be co-stained by DQ8/GAD65250–266tetramers
labeled with two different fluorochromes (PE or APC) (Fig. 3B). Results of the ex vivo experiments are summarized in Table 3. The average frequencies of GAD65250–266-specific cells and
GAD65250–266-specific CD45RO+cells were found to be higher
in the T1D group compared to the healthy control (Fig. 3C). There was no correlation between frequencies of GAD65250–266
-specific CD45RO+cells and disease duration (r2= 0.0218).
Discussion
DQ8 possesses a predisposing non-aspartic acid residue at beta 57 and confers the highest risk to T1D. Substantial efforts have been made to identify DQ8-restricted responses which can closely monitor the progression of diabetes in human. However, detection of disease-related reactions from the rare islet-specific T cell populations is extremely challenging. In this study, we demon-strated DQ8 tetramers as a tool to study islet-specific T cell reactivity and identified two disease-associated peptides, GAD65121–140 and GAD65250–266 (Table 2, Fig. 2). In addition,
T cells specific for GAD65250–266possessed several attributes that
render these cells a potential biomarker for T1D. GAD65250–266
-Figure 1. Detection of DQ8-specific self-reactive T cells in T1D patients.CD4+T cells from T1D patients were stimulated with self-peptides
derived from GAD65. The cells were cultured for two weeks and stained with PE-tetramers. CD4+T cell responses to GAD65121–140and GAD65250–266 were detected in multiple subjects. Representative tetramer staining of DQ8-specific self-reactive T cells was shown. Left column: negative staining from a healthy control. Middle and right columns: positive staining from two different T1D patients. Subjects were considered tetramer-positive if a distinct population that was more than three-fold above background in the same experiment was labeled.
doi:10.1371/journal.pone.0112882.g001
Table 2.Prevalence of GAD65-specific T cells in T1D and healthy subjects.
Responses
+ - Total P
GAD65 121–140
T1D 6 4 10 0.0108
Control 0 9 9
Total 6 13 19
GAD65 250–266
T1D 9 8 17 0.0407
Control 1 10 11
Total 10 18 28
Not all peptides were tested on each subject.
specific cells exhibited robust responses upon peptide stimulation (Fig. 1), and could be detected directly in unmanipulated PBMCs (Fig. 3A). Most importantly, differences between patients and healthy subjects in frequencies of CD4+ and CD4+CD45RO+
cells specific for GAD65250–266 could readily be seen by ex vivo
analysis (Fig. 3C). Monitoring of GAD65250–266-specific T cells
can potentially provide new insights into the etiology and treatment of the disease, although further longitudinal studies to link specific responses to the beta cell function are essential to confirm its suitability as a biomarker.
Schneider et al. suggest that self-reactive T effector cells are less resistant to peripheral regulation in T1D patients [20]. The current GAD65121–140- and GAD65250–266-reactive T cell data
support this model as responses to both peptides were more prevalent in T1D patients compared to controls (Fig. 1). Higher numbers of total antigen specific cells and CD4+CD45RO+cells for GAD65250–266 (Fig. 3C) were also found in the periphery of
subjects with T1D by ex vivo tetramer staining. Other studies show that DRB1*04:01 (DR0401)-restricted GAD65-reactive T cells of certain specificities are preferentially activated in T1D patients while other specificities are not [21–24]. The discrepancy in GAD65 responses to peripheral regulation might reflect that self-reactive T cells for different specificities are subjected to various degree of regulation. Further study in examining whether discrepancy in regulation of DR0401 and DQ8 restricted responses will be of interest. Previous studies show some islet-reactive T cells exhibit protective phenotype in healthy subjects [25,26]. The presence of multiple effector properties for GAD65121–140 (Fig. 2C, Fig. 2D, and Fig. S1B) implies the
potential of GAD65121–140–specific cells to modulate the immune
balance between tolerance and autoimmunity. Future studies to compare the dynamics of T cell responses for each HLA haplotype during disease development will help to shed more insight into the immunopathology of T1D.
The presence of self-reactive T cells in healthy individuals highlights the importance of peripheral regulation as a checkpoint in the progression of T1D. The higher frequencies of GAD65250– 266-specific total and memory CD4+T cells in subjects with type 1
diabetes (Fig. 3C) suggest that quantity and phenotypic changes for self-reactive T cells might be an indicator for loss of tolerance. DQ8 tetramers can therefore be a useful tool for the identification of disease-related self-reactive T cells as reliable biomarkers. Monitoring of these cells could assist with early-detection of risk or progression to T1D. In conclusion, DQ8-restricted CD4+T cells specific for GAD65121–140 and GAD65250–266 were detected in
multiple T1D subjects. GAD65121–140- and GAD65250–266
-reac-tive T cells were more prevalent in T1D patients. Further evaluation of T cell responses for beta cell autoantigens should facilitate our understanding of the role of autoreactive DQ8 T cells in type 1 diabetes and selection of autoreactive DQ8 T cells as T1D biomarkers.
Materials and Methods Subjects
The studies were approved by the Institutional Review Board of Benaroya Research Institute (BRI, Seattle, WA). All DQ8+
subjects were volunteers of Caucasian descent and were recruited with written consent from participating individuals or their guardians. HLA typing was conducted by BRI sequencing and genotyping core facilities. Samples from DQ8-positive T1D (n = 33, age from 9 to 56, days of disease duration from 281 to 7507) or DQ8-positive individuals without T1D or other autoimmune disease (healthy controls, n = 23, age from 18 to 56) were obtained under the auspices of the BRI JDRF Center for Translational Research at Benaroya Research Institute and Seattle Children’s.
DQ8 protein and tetramers
Recombinant DQ8 protein was produced as previously described [27]. Briefly, soluble DQ8 was purified from insect cell culture supernatants by affinity chromatography and dialyzed against citric/phosphate storage buffer, pH 5.4. For the prepara-tion of HLA class II tetramers, DQ8 protein was in vivo biotinylated in Drosophila S2 cells [28] prior to harvest and dialyzed into citric/phosphate buffer. The biotinylated monomer was loaded with 0.2 mg/ml of peptide by incubating at 37uC for 72 h in the presence of 0.2 mg/ml n-Dodecyl-b-maltoside and 1 mM Pefabloc SC (Sigma–Aldrich, St. Louis, MO). Peptide loaded monomers were subsequently conjugated into tetramers using R-PE streptavidin (Biosource International, Camarillo, CA) at a molar ratio of 8:1.
Peptides
Peptides derived from GAD65 (Table 1) were synthesized by Mimotopes (Clayton, Australia). The biotinylated reference peptide GAD65250–266 (AMMIARFKMFPEVKEKG) was
syn-thesized by Genscript with one 6-aminohexanoic acid spacer added between the N-terminal biotin label and the remainder of the peptide sequence.
Peptide binding competition
GAD65250–266is a good binder for DQ8 [29] and was used as
the index peptide in the competition study. Various concentrations of each test peptide were incubated in competition with 0.04mM biotinylated GAD65250–266 peptide in wells coated with DQ8
protein. After washing, the remaining biotin-GAD65250–266
peptide was labeled using europium-conjugated streptavidin (Perkin Elmer) and quantified using a Victor2 D time resolved fluorometer (Perkin Elmer). Peptide binding curves were simulated by non-linear regression with Prism software (Version 5, GraphPad Software Inc.) using a sigmoidal dose–response curve. IC50binding values were calculated from the resulting curves as
Figure 2. Functional analysis of DQ8-specific self-reactive T cells.T cell clones isolated by DQ8 tetramers were assayed for specificity and functionality. (A) Tetramer staining for GAD65121–140-specific (clone T1D05-C2), GAD65250–266-specific (clone T1D04-C1) and unrelated T cell clones. (B) Representative proliferation results of one GAD65121–140- and two GAD65250–266-specific T cell clones using APCs from a DR0401/DQ8 homozygous individual. Cells were stimulated with specific or irrelevant control peptide in the absence or presence of 20mg/ml of L243 (HLA-DR
blocking antibody) or SPVL3 (HLA-DQ blocking antibody). SI: stimulation index; cpm of specific peptide divided by cpm of irrelevant peptide. (C) Summary of cytokine-positive clones (for definition see Materials and methods) for GAD65121–140and GAD65250–266. T cell clones were stimulated with 50 ng/mL phorbol 12-myristate 13-acetate and 1mg/mL ionomycin in the presence of 10mg/mL Brefeldin A in 1 mL of T cell medium for
4 hours at 37uC. Cells were fixed, permeabilized, stained with antibodies for IFN-c, IL-10, IL-4, and IL-17, and analyzed on a LSRII multicolor flow cytometer. (D) Secretion of IFN-c, IL-4, and IL-10 from two GAD65121-140-specific and two GAD65250–266-specific T cell clones. Clones were stimulated in the presence of 10mg/ml of specific peptide with DQ8 antigen presenting cells.
the peptide concentration needed for 50% inhibition of reference peptide binding.
Self-reactive T cell identification
PBMCs were prepared from the blood of T1D or healthy DQ8 subjects by Ficoll underlay. CD4+T cells were isolated using the Miltenyi CD4+ T cell isolation kit, plated in 48-well plates with
APCs, and stimulated with 20mg/ml peptides from the selected
peptide set. The cells were cultured for two weeks in the presence of T cell medium (RPMI-1640 (Gibso) +10% pooled human serum+1% penicillin-streptomycin) and IL-2 (Hemagen Diagnos-tics, Inc.) at 37uC, stained with PE-tetramers and antibodies of interest, and analyzed by flow cytometry. 20000 total events were collected for each staining. Lymphoid cells were gated based on forward and side scatter profile. The negative threshold for gating for Fig. 1 was set based on the staining of samples with empty tetramers. Our criterion for positivity was distinct staining that labeled a compact tetramer positive CD4+ population, and was more than three-fold above background (cells from an unstimu-lated well) in the same experiment.
Ex vivoanalysis of self-reactive T cells
Ex vivo tetramer staining was performed as previously described [30]. Briefly, 30 million PBMCs in culture medium at a concentration of 150 million/mL were incubated with 50 nM dasatinib (LC Laboratories, dissolved in DMSO) for 10 min at 37uC. The cells were next stained with 20mg/mL phycoerythrin (PE)–labeled tetramers at room temperature for 120 minutes, followed by antibody staining for 20 minutes at 4uC with CD4 APC (clone RPA-T4, eBioscience), CD45RO FITC (clone UCHC1, eBioscience), and a combination of CD14 PerCP (clone MQP9, BD PharMingen) and CD19 PerCP (clone SJ25C1, BD PharMingen) to exclude B cells and monocytes from the analysis. Cells were washed twice with FACS running buffer (0.5% BSA and 2mM EDTA in PBS) and incubated with anti-PE magnetic beads (Miltenyi Biotec, Bergisch Gladbach, Germany) at 4uC for another 20 minutes. The cells were washed again and enriched with a Miltenyi MS magnetic column. Samples were labeled with ViaProbe (BD Biosciences) and analyzed on a BD FACS Calibur flow cytometer. Frequencies were calculated by dividing the number of tetramer positive cells in the bound fraction by the number of total CD4+T cells in the sample.
Statistical analysis
Statistical analysis was performed with Prism software (Version 5.03, GraphPad Software Inc.). The Mann-Whitney U-test was used to preform two group comparisons of T cell frequency. Fisher’s exact test was used to compare the prevalence of T cell responses in T1D and healthy subjects.
T cell clone isolation
T cell clones were generated by staining cultured T cells with tetramers, sorting gated tetramer-positive CD4+ cells using a FACS Aria (at single-cell purity, applying a singlet gate to the lymphocyte population) and expanding in a 96-well plate in the presence of 1.06105 irradiated PBMCs and 2mg/ml phytohe-magglutinin (Remel Inc. Lenexa, KS). After expansion of each T cell clone to a single 48 well, clones were stained again with tetramer and also stimulated in parallel with the corresponding peptides (10mg/mL), adding HLA-DQ-matched irradiated
PBMCs as antigen presenting cell and measuring thymidine uptake to verify epitope specificity.
Intracellular cytokine staining
Autoreactive-T cell clones isolated from T1D patients were resuspended in 200ml of T cell medium (RPMI-1640 (Gibco) +
10% pooled human serum +1% penicillin-streptomycin), and stimulated with 50 ng/mL phorbol 12-myristate 13-acetate and 1mg/mL ionomycin in the presence of 10mg/mL Brefeldin A for 4 hours at 37uC. After incubation cells were stained with surface
Figure 3. Direct ex vivo analysis of GAD65-specific T cells. Unmanipulated PBMCs were stained with DQ8/GAD65250–266 PE-tetramer. Antigen-specific CD4+ T cells were enriched, stained with
T1D
Age Duration (Days) Frequency per 106cells % Memory IAA GADA IA-2A ZnT8A
CD4+ CD4+CD45RO+
14 1632 2.5 0.6 24.0 - - -
-14 2439 3.8 0.6 15.8 + - -
-17 1190 13.4 7.8 58.2 N/A - + N/A
24 1379 6.2 2.9 46.8 + + + +
25 292 7.9 3.0 38.0 - + + +
25 1247 7.6 4.6 60.5 + + - +
30 6564 4.2 1.9 45.2 - - + +
41 1094 4.0 3.0 75.0 - + -
-42 281 6.4 4.4 68.8 - + + +
56 7507 10.1 7.2 71.0 + + -
-Healthy
Age Frequency per 106cells % Memory IAA GADA IA-2A ZnT8A
CD4+ CD4+CD45RO+
21 3.7 1.5 40.5 - - -
-29 2.5 1.3 52.0 - - -
-29 2.1 0.0 0.0 - + -
-33 2.0 1.0 50.0 - - -
-33 3.0 0.6 20.0 - - -
-33 2.4 0.0 0.0 - - -
-35 1.7 1.1 64.7 - - -
-35 4.0 1.0 25.0 - - -
-42 1.1 0.0 0.0 - - -
-56 0.5 0.3 60.0 - - -
-N/A: not available.
doi:10.1371/journal.pone.0112882.t003
DQ8-Restri
cted
CD4
+
T
Cell
Responses
to
Glutamic
Acid
Decarboxylase
65
ONE
|
www.ploson
e.org
7
November
2014
|
Volume
9
|
Issue
11
|
antibodies including CD3 PE-Cy5 (clone HIT3a, BioLegend) and CD4 v500 (clone RPA-T4, BD Biosciences) as well as Fixable Viability Stain 450 (BD Horizon). Cells were then fixed and permeabilized as per the manufacturer’s instructions (eBioscience). Cells were next stained with antibodies against IFN-c AF700 (clone 4S.B3, BioLegend), IL-10 PE Cy7 (clone MQ1-17H12, BioLegend), 17A APC Cy7 (clone BL168, BioLegend), and IL-4 FITC (clone 8DIL-4-8, eBioscience) for 20 minutes at IL-4uC. Cells were then washed in PBS and immediately analyzed by flow cytometry on a BD LSRII multi-color flow cytometer. Clones were considered cytokine positive if more than 10% of the cells produced that particular cytokine.
Supporting Information
Figure S1 Intracellular cytokine staining for DQ8-specific T cell clones. T cell clones specific for GAD65121– 140 and GAD65250–266 were stimulated with 50 ng/mL phorbol
12-myristate 13-acetate and 1 mg/mL ionomycin in the presence of 10 mg/mL Brefeldin A in 1 mL of T cell medium for 4 hours at 37uC. Cells were fixed, permeabilized, stained with antibodies for IFN- c, IL-10, IL-4, and IL-17, and analyzed on a LSRII multicolor flow cytometer. (A) Representative intracellular cyto-kine staining analysis for the GAD65250–266T cell clone
T1D01-C6. Staining results (open histograms) were compared to cells incubated with nonspecific isotype matched IgG control antibodies (gray histograms). Numbers indicate the percentage of cytokine-producing cells. (B) The ratio of IFN- cproducing cells to IL-4 producing cells in IFN- c+IL-4+clones for GAD65
121–140 and
GAD65250–266. Each dot represents one IFN-c+IL-4+clone from
Fig 2(C) (T1D05-C2 and T1D05-C3 for GAD65121–140, and
T1D01-C6 for GAD65250–266, respectively).
(TIF)
Figure S2 Direct ex vivo flow cytometric analysis of DQ8/GAD65-specific T cells. (A) Gating strategy for Tetramer+cells. Lymphoid cells were selected based on forward and side scatter profile. A dump channel was used to exclude monocytes (CD14+), B cells (CD19+), and dead cells (ViaProbe) from lymphocytes. Viable Tetramer+CD4+CD45RO+ T cells were gated based on the staining of unenriched cells, and the gating was applied to enriched populations. Numbers indicate the percentage of cells in the gated regions or each quadrant. (B) Representative ex vivo analysis of the surface memory marker CD45RO for GAD65121–140-specific cells in a T1D subject. The
frequency of these cells is below the threshold of detection. (TIF)
Acknowledgments
We thank Dr Catherine Pihoker, Seattle Children’s, and coordinators from BRI and Seattle Children’s for help with subject recruitment. The administrative support of Diana Sorus is greatly appreciated.
Author Contributions
Conceived and designed the experiments: IC JY WWK. Performed the experiments: IC JY TJG EAJ DTM. Analyzed the data: IC. Contributed reagents/materials/analysis tools: IC. Wrote the paper: IC CG WWK.
References
1. Todd JA, Walker NM, Cooper JD, Smyth DJ, Downes K, et al. (2007) Robust associations of four new chromosome regions from genome-wide analyses of type 1 diabetes. Nat Genet 39: 857–864.
2. Ide A, Eisenbarth GS (2003) Genetic susceptibility in type 1 diabetes and its associated autoimmune disorders. Rev Endocr Metab Disord 4: 243–253. 3. Erlich H, Valdes AM, Noble J, Carlson JA, Varney M, et al. (2008) HLA
DR-DQ haplotypes and genotypes and type 1 diabetes risk: analysis of the type 1 diabetes genetics consortium families. Diabetes 57: 1084–1092.
4. Thomson G, Valdes AM, Noble JA, Kockum I, Grote MN, et al. (2007) Relative predispositional effects of HLA class II DRB1-DQB1 haplotypes and genotypes on type 1 diabetes: a meta-analysis. Tissue Antigens 70: 110–127.
5. Todd JA, Bell JI, McDevitt HO (1987) HLA-DQ beta gene contributes to susceptibility and resistance to insulin-dependent diabetes mellitus. Nature 329: 599–604.
6. Corper AL, Stratmann T, Apostolopoulos V, Scott CA, Garcia KC, et al. (2000) A structural framework for deciphering the link between I-Ag7 and autoimmune diabetes. Science 288: 505–511.
7. Yoshida K, Corper AL, Herro R, Jabri B, Wilson IA, et al. (2010) The diabetogenic mouse MHC class II molecule I-Ag7 is endowed with a switch that modulates TCR affinity. J Clin Invest 120: 1578–1590.
8. Di Lorenzo TP, Peakman M, Roep BO (2007) Translational mini-review series on type 1 diabetes: Systematic analysis of T cell epitopes in autoimmune diabetes. Clin Exp Immunol 148: 1–16.
9. Oling V, Marttila J, Ilonen J, Kwok WW, Nepom G, et al. (2005) GAD65- and proinsulin-specific CD4+ T-cells detected by MHC class II tetramers in peripheral blood of type 1 diabetes patients and at-risk subjects. J Autoimmun 25: 235–243.
10. Achenbach P, Warncke K, Reiter J, Naserke HE, Williams AJ, et al. (2004) Stratification of type 1 diabetes risk on the basis of islet autoantibody characteristics. Diabetes 53: 384–392.
11. Bingley PJ (2010) Clinical applications of diabetes antibody testing. J Clin Endocrinol Metab 95: 25–33.
12. Wenzlau JM, Juhl K, Yu L, Moua O, Sarkar SA, et al. (2007) The cation efflux transporter ZnT8 (Slc30A8) is a major autoantigen in human type 1 diabetes. Proc Natl Acad Sci U S A 104: 17040–17045.
13. Achenbach P, Lampasona V, Landherr U, Koczwara K, Krause S, et al. (2009) Autoantibodies to zinc transporter 8 and SLC30A8 genotype stratify type 1 diabetes risk. Diabetologia 52: 1881–1888.
14. Narendran P, Estella E, Fourlanos S (2005) Immunology of type 1 diabetes. QJM 98: 547–556.
15. Willcox A, Richardson SJ, Bone AJ, Foulis AK, Morgan NG (2009) Analysis of islet inflammation in human type 1 diabetes. Clin Exp Immunol 155: 173–181.
16. Gianani R, Campbell-Thompson M, Sarkar SA, Wasserfall C, Pugliese A, et al. (2010) Dimorphic histopathology of long-standing childhood-onset diabetes. Diabetologia 53: 690–698.
17. Wen L, Wong FS, Burkly L, Altieri M, Mamalaki C, et al. (1998) Induction of insulitis by glutamic acid decarboxylase peptide-specific and HLA-DQ8-restricted CD4(+) T cells from human DQ transgenic mice. J Clin Invest 102: 947–957.
18. Herman AE, Tisch RM, Patel SD, Parry SL, Olson J, et al. (1999) Determination of glutamic acid decarboxylase 65 peptides presented by the type I diabetes-associated HLA-DQ8 class II molecule identifies an immuno-genic peptide motif. J Immunol 163: 6275–6282.
19. Liu J, Purdy LE, Rabinovitch S, Jevnikar AM, Elliott JF (1999) Major DQ8-restricted T-cell epitopes for human GAD65 mapped using human CD4, DQA1*0301, DQB1*0302 transgenic IA(null) NOD mice. Diabetes 48: 469– 477.
20. Schneider A, Rieck M, Sanda S, Pihoker C, Greenbaum C, et al. (2008) The effector T cells of diabetic subjects are resistant to regulation via CD4+FOXP3+ regulatory T cells. J Immunol 181: 7350–7355.
21. Danke NA, Yang J, Greenbaum C, Kwok WW (2005) Comparative study of GAD65-specific CD4+ T cells in healthy and type 1 diabetic subjects. J Autoimmun 25: 303–311.
22. Yang J, James EA, Sanda S, Greenbaum C, Kwok WW (2013) CD4+T cells recognize diverse epitopes within GAD65: implications for repertoire develop-ment and diabetes monitoring. Immunology 138: 269–279.
23. Monti P, Scirpoli M, Rigamonti A, Mayr A, Jaeger A, et al. (2007) Evidence for in vivo primed and expanded autoreactive T cells as a specific feature of patients with type 1 diabetes. J Immunol 179: 5785–5792.
24. Oling V, Reijonen H, Simell O, Knip M, Ilonen J (2012) Autoantigen-specific memory CD4+T cells are prevalent early in progression to Type 1 diabetes. Cell Immunol 273: 133–139.
25. Arif S, Tree TI, Astill TP, Tremble JM, Bishop AJ, et al. (2004) Autoreactive T cell responses show proinflammatory polarization in diabetes but a regulatory phenotype in health. J Clin Invest 113: 451–463.
26. van Lummel M, Duinkerken G, van Veelen PA, de Ru A, Cordfunke R, et al. (2014) Posttranslational modification of HLA-DQ binding islet autoantigens in type 1 diabetes. Diabetes 63: 237–247.
27. Novak EJ, Liu AW, Gebe JA, Falk BA, Nepom GT, et al. (2001) Tetramer-guided epitope mapping: rapid identification and characterization of immuno-dominant CD4+T cell epitopes from complex antigens. J Immunol 166: 6665– 6670.
complex by coexpression of BirA enzyme for the generation of MHC class II/ tetramers. Hum Immunol 65: 692–699.
29. Kwok WW, Domeier ML, Raymond FC, Byers P, Nepom GT (1996) Allele-specific motifs characterize HLA-DQ interactions with a diabetes-associated peptide derived from glutamic acid decarboxylase. J Immunol 156: 2171–2177.