Seasonal variation of food intake
of adults from Niterói, Rio de
Janeiro, Brazil
Variação sazonal na ingestão
alimentar de adultos de Niterói, Rio
de Janeiro
Amine Farias Costa
I,IIEdna Massae Yokoo
IILuiz Antonio dos Anjos
I,II,IIIVivian Wahrlich
I,IIMaria Teresa Anselmo Olinto
IV,VRuth Liane Henn
IVWilliam Waissmann
IIII Nutritional and Functional Assessment Laboratory, Department of Social
Nutrition, Fluminense Federal University, Niterói, RJ, Brazil
II Graduate Program in Collective Health, Fluminense Federal University, Niterói,
RJ, Brazil
III Sérgio Arouca National School of Public Health, Oswaldo Cruz Foundation, Rio
de Janeiro, RJ, Brazil
IV Graduate Program in Collective Health, Vale do Rio dos Sinos University, São
Leopoldo, RS, Brazil
V Health Sciences Federal University Porto Alegre, Porto Alegre, RS, Brazil
Corresponding author: Luiz Antonio dos Anjos. Laboratório de Avaliação Nutricional e Funcio-nal, Departamento de Nutrição Social, Universidade Federal Fluminense - Caixa Postal 100231, 24020-971 Niterói, RJ, Brazil. E-mail: [email protected]
Abstract
The measurement of usual food intake (FI) is necessary to accurately establish the rela-tionship between diet and disease. In most studies data are collected at one particular time of the year, which may influence the interpretation of the results. The purpose of this study was to investigate the effect of seasonality on FI in a sample of adults from Niterói, RJ, Brazil. A total of 102 heal-thy subjects (69 women) aged between 20 and 69 years were interviewed to obtain six 24-hour dietary recalls, three in summer and three in winter. In both seasons, the intake of energy (EI) and 23 nutrients was determined and the percent of subjects who met the recommendations for the nutrients were computed. The data of FI were deat-tenuated considering the within-person variability and adjusted for energy. The intake of energy and some nutrients were significantly different between men and women. EI did not differ between seasons, for both sexes, but the intake of macro and micronutrients was different. The results of this study suggest that the seasonality in the measurement of FI should be considered in order to improve the methods and instru-ments used in population dietary surveys.
Keywords: Nutritional epidemiology. Diet.
Resumo
A aferição da ingestão alimentar (IA) usual é necessária para estabelecer, com acurácia, a relação entre a dieta e o aparecimento de doenças. Na maioria dos estudos, os dados de IA usual são coletados referentes ao período de um ano, sem considerar a estação do ano em que o estudo ocorre. O objetivo do presente estudo foi verificar o efeito da sazonalidade na IA de adultos de Niterói, RJ. Um total de 102 sujeitos (69 mulheres) saudáveis, com idade entre 20 e 69 anos, responderam a seis recordatórios dietéticos de 24 horas, três no verão e três no inverno. Em ambas as estações do ano, foi determinada a ingestão energética (IE) e de 23 nutrientes, além do percentual de indivíduos que alcançavam as recomen-dações dos mesmos. Os dados finais foram deatenuados pela variabilidade intraindi-vidual e ajustados pela energia. A IE e de alguns nutrientes foram significativamente diferentes entre os homens e as mulheres. A IE não se diferenciou entre as estações, para ambos os sexos, porém a ingestão de prote-ínas, fibras, magnésio, tiamina, piridoxina e niacina foi diferente entre as estações para ambos os sexos. Os resultados do presente estudo sugerem que a sazonalidade seja considerada na aferição da IA, servindo de base para a adequação dos métodos e instrumentos utilizados nos inquéritos dietéticos populacionais.
Palavras-chave: Epidemiologia
nutri-cional. Dieta. Inquéritos sobre dietas. Consumo de alimentos. Estações do ano. Recomendações nutricionais.
Introduction
Data on food intake (FI) assessed with Food Frequency Questionnaires (FFQ) are usually collected at a particular time. Information bias could occur if the reference period for the information about FI includes the 12 previous months. As an example, if the FFQ is applied during summer, inter-viewees could involuntarily overestimate the foods typically consumed at this time of the year, to the detriment of foods consu-med during winter. On the other hand, if the FFQ include a shorter period of time, such as three months, the information could be affected by the actual variation in the seaso-nal FI. This fact has been well documented and it has received significant attention in
the literature1,2. Similarly, this could occur
when other FI assessment instruments are applied, such as the dietary record or 24-hour dietary recall (24hR). The latter can be more or less affected by the seasons, depending on the number of assessments throughout the year.
There are controversies about the seaso-nal effect on FI. Some studies suggest that, as an example, the daily energy intake (EI) varies significantly according to the season
of the year1,2. Others did not find such
varia-tion in EI3,4, but identified differences in the
eating pattern between seasons5. However,
the majority of seasonal differences in the FI is found in regions where seasons are well defined, thus influencing the availability of
certain foods throughout the year1,6,7.
Considering the previously mentio-ned aspects, the present study aimed to assess the seasonal effect on the energy and macro- and micronutrient intakes of a sample of adults of the city of Niterói, RJ, Southeastern Brazil, where the climate is tropical.
Methods
Population”*, aimed at constructing and
validating a FFQ8. The sample comprised
of 150 adult individuals who lived in the city of Niterói, RJ, Brazil. Individuals were contacted by telephone, according to a list of participants of a household survey con-ducted in a probabilistic sample of adults
living in the city of Niterói9, based on the
following criteria: being aged between 20 and 69 years; having completed at least ten years of school in the three lowest income strata or four years in the remaining income strata; not being obese or underweight, a criterion assessed with a body mass index
(BMI) higher than or equal to 30 kg.m-2 and
lower than 18.5 kg.m-2, respectively;
repor-ting not having or not being undergoing treatment for diabetes mellitus, kidney diseases, cardiovascular diseases (CVD), gastrointestinal diseases, thyroid disorders or any other diseases that could interfere with the eating pattern; not being pregnant or breast-feeding; and not being on a diet.
Individuals who agreed to participate in the study were invited to be present at the LANUFF (Nutritional and Functional Assessment Laboratory of the Fluminense Federal University) on a particular morning while fasting. They were given detailed explanations about their participation and subsequently signed an informed consent form. Socio-demographic data were obtai-ned with a standard questionnaire, aiming
to categorize socioeconomic classes10.
Body mass and stature measurements were obtained while individuals were wearing standard clothes, following the methods
described by Lohman et al.11. With these
measurements, BMI was calculated and participants’ nutritional status was classi-fied as either normal (18.5 ≤ BMI < 25 kg.m-2)
or overweight (25 ≤ BMI < 30 kg.m-2)12.
After these measurements were obtai-ned, a 24hR was performed with the use of a photo album especially designed for this research project, which was provided for individuals to take home. On this occasion,
three non-consecutive days were set up through telephone calls to perform this 24hR (two weekdays and one weekend day). Six months after the first dietary recall was performed, individuals were contacted again and the procedures used to obtain three more 24hR were repeated. Data col-lection was performed between the summer of 2007 and 2008 (January through April) and winter of 2007 (July through October).
The nutrient content of these dietary recalls were primarily obtained from the
Brazilian Food Composition Table (TACO)13.
Foods that were not present in the TACO
were obtained from other sources8: the
USDA National Nutrient Database for
Standard Reference – Release 2014; Eating
Pattern Assessment Table in Cooking
Measures15; and, lastly, in very specific cases
(such as nutritional supplements and fast--food restaurant preparations), the nutrition facts from food labels.
Within- and between-person variances were estimated according to the three 24hRs per season, as were the individual energy and macro- and micronutrient intakes deattenuated for within-person variability
(WV ) using the PC-SIDE software16. The
PC-SIDE software predicts the transforma-tion of dietary variables to enable the sym-metry of distribution before the within- and between-person variances are calculated and provides individual deattenuated values
for WV in the original scale17,18.
Prior to deattenuation, the three sum-mer 24hRs were compared to each other (non-normal distribution) and as there were no significant differences among them (Kruskal-Wallis H-test with p > 0.05), they were included in the same season of the year (summer). This procedure was also performed for the three winter 24hRs.
The WV deattenuated values were used to calculate the percentage of individuals who met the recommendations (% IAR) of FI. Energy recommendations were estimated by multiplying the basal metabolic rate (BMR)
* Project funded by the Coordenação de Aperfeiçoamento de Pessoal de Nível Superior (CAPES/MEC – Brazilian Ministry of Education and Culture/Coordination for the Improvement of Higher Education Personnel) in the Programa Nacional de Cooperação Acadêmica
– calculated by the equations suggested by the Food and Agriculture Organization
(FAO)19 – according to the physical activity
level of 1.4, as recommended for this
po-pulation20. The acceptable macronutrient
distribution range of the Dietary Reference
Intakes (DRI)21 was used as
recommenda-tions for protein, carbohydrate and total fat intakes. The recommendations from the
Brazilian Cardiology Society22 for saturated,
mono- and polyunsaturated fats were used for these dietary components. The recom-mendations for fibers, calcium, manganese, sodium and potassium were based on ade-quate intake values, according to the DRI. The recommended dietary intake values for magnesium, phosphorus, iron, copper, zinc, retinol, thiamin, riboflavin, pyridoxine,
niacin and vitamin C were used21,23-27.
The intake of macro- and micronu-trients, deattenuated for WV, was adjusted
for EI, using the residue method28. The
objective of the adjustment for EI was to remove possible confounding factors that could occur with the total EI and this is a requirement for studies on nutrient intake
assessment28.
The adjustment for EI did not lead to satisfactory results for the intake of retinol in women and men and that of copper and riboflavin in men. For this reason, these data were not shown.
The means (and standard deviations – SD) of the most adequate unit of measu-rement and the % IAR were estimated for the energy and macro- and micronutrient intakes in the summer and winter for both sexes. The mean intakes, deattenuated for WV only and deattenuated and adjusted for EI, were compared between sexes and seasons of the year. The difference between means was tested using the non-parametric test (Wilcoxon), as variables did not show a normal distribution. In all statistical tests,
the value of α = 0.05 was used to determine
the significance.
The data analysis was performed with the Statistical Analysis System (SAS) ver-sion 9.1, Software for Intake Distribution Estimation (PC-SIDE) version 1.0 and
Statistical Package for the Social Sciences (SPSS) version 13.016,29,30.
The research project was approved by the Research Ethics Committee of the Medical School of the Fluminense Federal University under number 163/06. There were no conflicts of interest during the development of the study.
Results
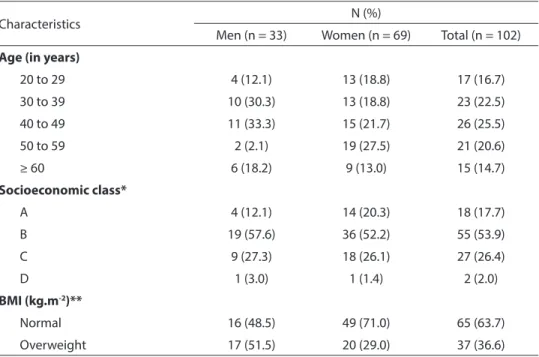
A total of 102 individuals (69 women) completed the present study. Approximately 54% of the sample belonged to socioecono-mic class B, the majority was aged between 40 and 49 years (25.5%) and had normal BMI (63.7%), and the prevalence of overweight was higher in men (51.5%) than women (29.0%) (Table 1).
The majority of losses was due to indi-viduals’ refusal to participate in the second stage of the study and those who were lost to follow-up had similar characteristics to the ones who remained in the analysis: the majority were women (56.3%) and aged between 40 and 49 years (31.3%), belonged to socioeconomic class B (45.5%), and had a higher prevalence of overweight compared to men.
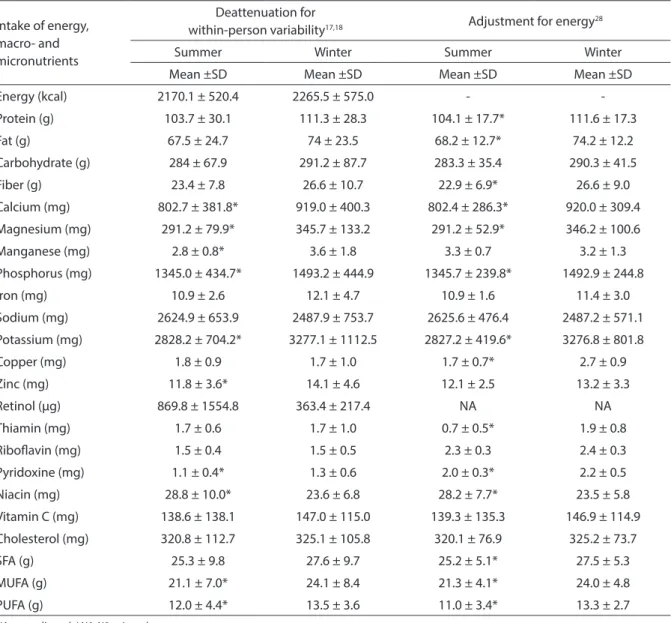
women was not different between seasons of the year, both for WV-deattenuated values and those adjusted for EI (Table 3).
Cholesterol intake was different between seasons of the year in men only and this intake was higher during summer (Table 2), whereas the intake of saturated fats adjusted for EI was only different among women and it was higher during winter (Table 3). With regard to monounsaturated fats, again there were only differences in intake among women, which was higher during winter (Table 3). There were no differences in the intake of polyunsaturated fats in men be-tween seasons (Table 2). In contrast, among women, this difference occurred in both types of adjustment (Table 3).
In general, both men and women had higher fiber intake adjusted for EI during winter, when compared to the summer. Concerning the differences in intake of min-erals and vitamins between seasons, there
was a higher intake of calcium, magnesium, phosphorus, copper, potassium, thiamin and pyridoxine during winter by women (Tables 2 and 3).
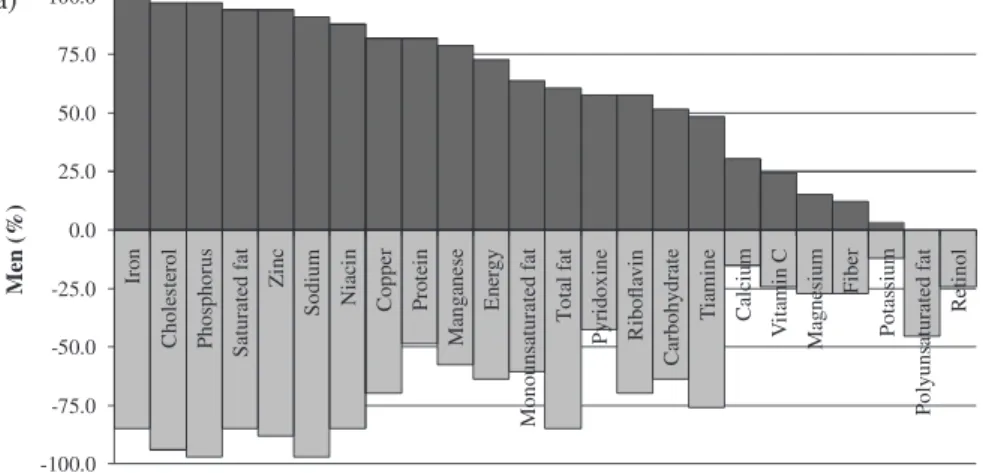
The majority of women and men did not meet the recommendations of calcium, magnesium, potassium, retinol and polyun-saturated fats. In addition to these nutrients, a higher percentage of men did not meet the recommendations for protein (winter), pyridoxine (winter), monounsaturated fats (winter), thiamin (summer), fibers and vi-tamin C (both seasons) (Figure 1a). Among women, the corresponding nutrients were fibers (summer), monounsaturated fats (summer), iron and pyridoxine (both sea-sons) (Figure 1b).
Discussion
Several studies assessed possible sourc-es of variability capable of interfering with
Table 1 - Distribution of socioeconomic and demographic variables, and nutritional status of adults from Niterói, Rio de Janeiro, Brazil, 2007-08.
Tabela 1 - Distribuição das variáveis socioeconômicas, demográicas, e estado nutricional de adultos
de Niterói, RJ, Brasil, 2007-08.
Characteristics N (%)
Men (n = 33) Women (n = 69) Total (n = 102)
Age (in years)
20 to 29 4 (12.1) 13 (18.8) 17 (16.7)
30 to 39 10 (30.3) 13 (18.8) 23 (22.5)
40 to 49 11 (33.3) 15 (21.7) 26 (25.5)
50 to 59 2 (2.1) 19 (27.5) 21 (20.6)
≥ 60 6 (18.2) 9 (13.0) 15 (14.7)
Socioeconomic class*
A 4 (12.1) 14 (20.3) 18 (17.7)
B 19 (57.6) 36 (52.2) 55 (53.9)
C 9 (27.3) 18 (26.1) 27 (26.4)
D 1 (3.0) 1 (1.4) 2 (2.0)
BMI (kg.m-2)**
Normal 16 (48.5) 49 (71.0) 65 (63.7)
Overweight 17 (51.5) 20 (29.0) 37 (36.6)
* Brazilian Economic Classification Criterion of the Brazilian Association of Market Research Companies10.
* Critério de Classificação Econômica Brasil da Associação Brasileira de Empresas de Pesquisa10.
** Body mass index = body mass (kg) / stature2 (m). A BMI between 18.5 and 24.9 kg.m-2 = normal; A BMI equal to or higher
than 25.0 kg.m-2 = overweight12.
** Índice de massa corporal = massa corporal (kg) / estatura2 (m). IMC de 18,5 até 24,9 kg.m-2 = normal; IMC igual ou maior a 25,0
the measurement of FI of populations, such
as seasonality1-7. The effect of
seasonal-ity on FI depends on cultural, ecological, geographic and meteorological factors and
the industrialization level of a country31,
apart from factors intrinsic to individuals (sex and age).
In the present study, the assessment of
the energy and macro- and micronutrient intakes was obtained in two seasons of the year: summer and winter, using more than one statistical adjustment. The data shown here were corrected for WV, thus enabling the intake distribution to be exclusively influenced by the differences among indivi-duals. Fluctuations in individual daily intake
Table 2 - Mean intake (standard deviation – SD) of energy, macro and micronutrients, in the summer and winter, deattenuated by within-person variation and adjusted for energy, of men from Niterói, Rio de Janeiro, Brazil, 2007-08.
Tabela 2 - Médias de ingestão (e desvio-padrão – DP) de energia, macro e micronutrientes, no verão e no inverno,
deatenuadas pela variabilidade intraindividual e ajustados pela energia, de homens de Niterói, RJ, Brasil, 2007-08.
Intake of energy, macro- and micronutrients
Deattenuation for
within-person variability17,18 Adjustment for energy
28
Summer Winter Summer Winter
Mean ±SD Mean ±SD Mean ±SD Mean ±SD
Energy (kcal) 2801.3 ± 680.2 2666.4 ± 832.1 -
-Protein (g) 131.2 ± 39.4* 110.5 ± 34.3 131.4 ± 19.9* 115.0 ± 21.6
Fat (g) 90.2 ± 34.4 84.5 ± 38.8 91.3 ± 22.3 89.3 ± 26.6
Carbohydrate (g) 342.5 ± 92.7 362.2 ± 141.6 343.7 ± 41.9* 383.4 ± 58.7
Fiber (g) 24.5 ± 7.9 29.2 ± 11.0 25.7 ± 6.9* 30.7 ± 8.1
Calcium (mg) 828.1 ± 395.2 697.4 ± 289.8 827.8 ± 342.4 729.7 ± 209.2
Magnesium (mg) 339.0 ± 78.8 363.8 ± 119.2 339.4 ± 47.9* 378.2 ± 78.2
Manganese (mg) 3.4 ± 1.4 3.0 ± 1.5 2.9 ± 1.2* 2.0 ± 0.9
Phosphorus (mg) 1587 ± 377.3 1433.7 ± 509.1 1588.1 ± 211.1 1498.9 ± 309.1
Iron (mg) 14.4 ± 2.7 12.9 ± 5.2 15.1 ± 2.0* 12.8 ± 2.8
Sodium (mg) 3065.2 ± 1340 3173.2 ± 1247.4 3065.7 ± 873.5 3304.8 ± 940.0
Potassium (mg) 3009.0 ± 726.5 3121.9 ± 1078.3 3009.8 ± 441.0 3253.9 ± 712.5
Copper (mg) 1.3 ± 0.3 2.3 ± 2.6 NA NA
Zinc (mg) 16.8 ± 2.9* 14.9 ± 4.5 16.7 ± 2.0* 14.6± 2.8
Retinol (µg) 287.6 ± 185.1 1853.7 ± 3676.8 NA NA
Thiamin (mg) 1.5 ± 0.6* 1.8 ± 0.6 2.6 ± 0.5* 0.9± 0.6
Ribolavin (mg) 1.4 ± 0.4 1.7 ± 0.8 NA NA
Pyridoxine (mg) 1.5 ± 0.4 1.4 ± 0.2 0.5 ± 0.3* 1.0± 0.2
Niacin (mg) 34.2 ± 17.8* 23.5 ± 7.1 35.3 ± 14.7* 24.5± 6.7
Vitamin C (mg) 69.8 ± 42.4 67.7 ± 35.2 69.6 ± 40.8 67.9 ± 34.7
Cholesterol (mg) 402.5 ± 108* 343.5 ± 97.3 402.7 ± 72.3* 355.5± 70.4
SFA (g) 34.0 ± 10.9 30.3 ± 14.5 32.9 ± 7.6 33.2 ± 10.9
MUFA (g) 28.8 ± 10.1 26.7 ± 11.5 28.0 ± 7.3 28.2 ± 8.0
PUFA (g) 16.1 ± 8.3 15.3 ± 4.6 15.5 ± 6.1 14.8 ± 3.7
NA: non-adjusted. / NA: Não ajustado.
SFA: saturated fatty acid; MUFA: monounsaturated fatty acid; PUFA: polyunsaturated fatty acid.
SFA: lipídio saturado; MUFA: lipídio moinsaturado; PUFA: lipídio poliinsaturado.
* Means significantly different from those found during winter for each adjustment (Wilcoxon test; p < 0.05).
can change the results and its adjustment allows the reduction in estimates of
variabil-ity such as standard deviation and error32,33.
Furthermore, these results were adjusted for EI, enabling the intake of women and men to be compared in both seasons of the year, without being influenced by the supply of energy31.
The EI was not different between sea-sons for the WV-deattenuated results for both sexes, showing that the EI remains the same in the sample of adults of the city of Niterói throughout the year. Consequently, the intake of different types of food will not change the EI in general, but that of certain micronutrients will, confirming that the
Table 3 - Mean intake (standard deviation – SD) of energy, macro and micronutrients, in the summer and winter, deattenuated by within-person variation and adjusted for energy, of women from Niterói, Rio de Janeiro, Brazil, 2007-08.
Tabela 3 - Médias de ingestão (e desvio-padrão – DP) de energia, macro e micronutrientes, no verão e no inverno,
deatenuadas pela variabilidade intraindividual e ajustados pela energia, de mulheres de Niterói, RJ, Brasil, 2007-08.
Intake of energy, macro- and micronutrients
Deattenuation for
within-person variability17,18 Adjustment for energy
28
Summer Winter Summer Winter
Mean ±SD Mean ±SD Mean ±SD Mean ±SD
Energy (kcal) 2170.1 ± 520.4 2265.5 ± 575.0 -
-Protein (g) 103.7 ± 30.1 111.3 ± 28.3 104.1 ± 17.7* 111.6 ± 17.3
Fat (g) 67.5 ± 24.7 74 ± 23.5 68.2 ± 12.7* 74.2 ± 12.2
Carbohydrate (g) 284 ± 67.9 291.2 ± 87.7 283.3 ± 35.4 290.3 ± 41.5
Fiber (g) 23.4 ± 7.8 26.6 ± 10.7 22.9 ± 6.9* 26.6 ± 9.0
Calcium (mg) 802.7 ± 381.8* 919.0 ± 400.3 802.4 ± 286.3* 920.0 ± 309.4
Magnesium (mg) 291.2 ± 79.9* 345.7 ± 133.2 291.2 ± 52.9* 346.2 ± 100.6
Manganese (mg) 2.8 ± 0.8* 3.6 ± 1.8 3.3 ± 0.7 3.2 ± 1.3
Phosphorus (mg) 1345.0 ± 434.7* 1493.2 ± 444.9 1345.7 ± 239.8* 1492.9 ± 244.8
Iron (mg) 10.9 ± 2.6 12.1 ± 4.7 10.9 ± 1.6 11.4 ± 3.0
Sodium (mg) 2624.9 ± 653.9 2487.9 ± 753.7 2625.6 ± 476.4 2487.2 ± 571.1
Potassium (mg) 2828.2 ± 704.2* 3277.1 ± 1112.5 2827.2 ± 419.6* 3276.8 ± 801.8
Copper (mg) 1.8 ± 0.9 1.7 ± 1.0 1.7 ± 0.7* 2.7 ± 0.9
Zinc (mg) 11.8 ± 3.6* 14.1 ± 4.6 12.1 ± 2.5 13.2 ± 3.3
Retinol (µg) 869.8 ± 1554.8 363.4 ± 217.4 NA NA
Thiamin (mg) 1.7 ± 0.6 1.7 ± 1.0 0.7 ± 0.5* 1.9 ± 0.8
Ribolavin (mg) 1.5 ± 0.4 1.5 ± 0.5 2.3 ± 0.3 2.4 ± 0.3
Pyridoxine (mg) 1.1 ± 0.4* 1.3 ± 0.6 2.0 ± 0.3* 2.2 ± 0.5
Niacin (mg) 28.8 ± 10.0* 23.6 ± 6.8 28.2 ± 7.7* 23.5 ± 5.8
Vitamin C (mg) 138.6 ± 138.1 147.0 ± 115.0 139.3 ± 135.3 146.9 ± 114.9
Cholesterol (mg) 320.8 ± 112.7 325.1 ± 105.8 320.1 ± 76.9 325.2 ± 73.7
SFA (g) 25.3 ± 9.8 27.6 ± 9.7 25.2 ± 5.1* 27.5 ± 5.3
MUFA (g) 21.1 ± 7.0* 24.1 ± 8.4 21.3 ± 4.1* 24.0 ± 4.8
PUFA (g) 12.0 ± 4.4* 13.5 ± 3.6 11.0 ± 3.4* 13.3 ± 2.7
NA: non-adjusted. / NA: Não ajustado.
SFA: saturated fatty acid; MUFA: monounsaturated fatty acid; PUFA: polyunsaturated fatty acid. / SFA: saturated fatty acid (lipídio saturado); MUFA: monounsatu-rated fatty acid (lipídio moinsaturado); PUFA: polyunsatumonounsatu-rated fatty acid (lipídio poliinsaturado).
quality of foods characterizing the dietary pattern of individuals is different through-out the year. This corroborates other studies
that have used 24hRs2,34 and FFQs3,35.
In Brazil, studies that assess the sea-sonal variations in FI are rare. In general, the sources of variation in the FI of Brazilians studied are limited to methodological varia-tions intrinsic to individuals. There were two
studies36,37 that showed results associating
seasonality and FI in Brazil. In the first one,
a variation was found in the eating behavior of workers with fixed shifts in the city of São Paulo between summer and winter by ap-plying dietary recalls for three days. The diet of workers had a higher amount of energy, carbohydrates and fats during winter, show-ing the influence of seasonality on the FI of the sample of men.
Rossato et al.37 analyzed the seasonal
variation in FI of healthy adults living in the state of Rio Grande do Sul, Southern Brazil,
Figure 1 - Percentage of adult men (a) and women (b) whose intakes, deattenuated by within-person variation17,18, reached the recommendation for energy, macro and micronutrients intakes,
in summer and winter, according to the Dietary Reference Intakes and the Brazilian Society of Cardiology21-27. Niterói, Rio de Janeiro, Brazil, 2007-8.
Figura 1 - Percentual de homens (a) e mulheres (b) adultos cujas ingestões, deatenuadas pela
variabilidade intraindividual17,18, alcançam a recomendação de ingestão energética, de macro e
using six 24hRs throughout the year. The intake of carbohydrates adjusted for EI was higher during summer, compared to other seasons, contrary to what was observed for fats, whose intake was higher during winter. According to the present study, there were no differences in EI in both sexes between seasons, strengthening the hypothesis that what changes throughout the year is in fact the dietary pattern.
However, in international studies, dif-ferent EI values were found throughout the year. When the FI of American women aged between 51and 86 years was assessed with a questionnaire of assessment of seasonal
dietary patterns, Lee et al.38 found higher EI
during winter than summer. Based on data from a cohort study conducted in Shanghai,
China, Fowke et al.6 found higher EI during
winter than summer in healthy women,
us-ing a FFQ. Likewise, Westerterp et al.7 found
higher EI by Dutch adults during winter than summer, as assessed with a seven-day
dietary recall. Nonetheless, Kuhnlein et al.39
did not find differences in EI originated from industrially processed foods, known as “market foods”, when compared to tra-ditional unprocessed foods in Canadian women aged between 40 and 70 years, as-sessed during six moments of the year.
Important seasonal differences were found for the intake of nutrients associated with nutritional diseases (iron-deficiency anemia) and non-communicable chronic diseases (hypercholesterolemia, CVD and osteoporosis) in the present sample of adults of Niterói. The intake of iron and cholesterol by men was higher during sum-mer, whereas that of calcium by women was higher during winter. This fact should be emphasized, as the need for the regular intake of such nutrients throughout the year is known, so as to guarantee a high level of health.
Tokudome et al.40 found results similar
to those found in the present study, using dietary recalls with weighing during seven consecutive days, associated with the intake of potassium, calcium, magnesium, copper and saturated, mono- and polyunsaturated
fats in Japanese women, which was signifi-cantly higher during winter. In Spain, Capita
& Alonso-Calleja1 also found higher intake
of carbohydrate and fiber by men during winter and that of protein, fiber and poly-unsaturated fats by women, using dietary records applied throughout one year.
The results of the present study showed a high percentage of adults that did not meet the recommendations for certain nutrients, including differences according to sex and seasons of the year and suggesting the need for distinct interventions in this population. The low iron intake by women was highly significant, while there was a low intake of fiber, niacin and vitamin C among men. The low iron intake of women could be associ-ated with the occurrence of iron-deficiency anemia, a situation found in several
stud-ies conducted in samples of Brazilians41-44,
emphasizing the need for interventions in this group.
A higher percentage of men did not meet the recommendations of proteins and monounsaturated fats during winter. Among women, a higher percentage did not meet the recommendations for fiber and monounsaturated fats during summer. In this sample, a high percentage of women and men did not meet the recommenda-tions of calcium, retinol and saturated fats in both seasons of the year, which could be
associated with osteoporosis45,
hypovita-minosis A46 and CVD, respectively22.
On the other hand, the intake of sodium, cholesterol and saturated fats, well above the recommendations for women and men in both seasons of the year, can increase the risk of CVD, such as arterial hypertension and atherosclerosis, both highly prevalent in
the Brazilian population22,47. Furthermore,
the high percentage of men and women with higher than recommended EI should be emphasized. This finding is alarming, considering the high indices of overweight
and obesity in the Brazilian population20,22.
could be partly explained by the high nu-tritional recommendations proposed. The intake of other nutrients such as retinol and polyunsaturated fats could be underesti-mated, due to their high concentration in few foods. A high percentage of individuals who did not meet the recommendations could also be associated with the limitations of food composition tables, where foods and their nutritional values are insufficiently de-scribed, leading to the use of several sources
and information about food preparations48.
The present study had some limita-tions. The data were based on a convenient sample, not representative of the popula-tion studied, although sufficient to achieve the objective (validation of a FFQ) of the research project from which it originated. Additionally, there was a higher percentage of adults of the socioeconomic class A in the sample studied (17.7%), compared to the 5.1% estimated for the population of the metropolitan area of the city of Rio de
Janeiro10. On the other hand, the majority
of the population of the present study had a normal BMI, based on the inclusion criteria proposed, thus reducing the chances of underreporting of FI due to overweight and
obesity48. Despite these limitations, the
im-portance of seasonality in the measurement of FI of the population studied became clear. To replicate the number of 24hRs used during different periods of the year and to include non-consecutive weekdays and weekend days, both of which were suc-cessfully achieved in the present study, are essential to plan dietary surveys, thus reducing possible sources of random errors. Measurement errors caused by seasonality can be equally diluted among individuals
in the case of large samples; in contrast, lack of distortion cannot be guaranteed
in the results of FI due to seasonality2,49.
Additionally, although the city of Niterói does not have well defined seasons due to its tropical location, significant differences in FI were found in the present study.
In conclusion, although the majority of national and international studies have not included seasonality, the results shown here indicate that this source of variation should be taken into consideration, even in tropical regions.
Authors’ contributions: LA Anjos, MTA
Olinto and W Waissmann were responsible for planning the original research. AF Costa, LA Anjos and V Wahrlich supervised the field data collection. EM Yokoo and RL Henn helped with data analysis and manuscript writing. AF Costa analyzed the data, dis-cussed the results and wrote the first version of the manuscript, which was subsequently reviewed and approved by all authors.
Acknowledgements: AF Costa was
granted a scholarship by the Coordenação de
Aperfeiçoamento de Pessoal de Nível Superior
(CAPES – Coordination for the Improvement of Higher Education Personnel). This re-search project was funded by the CAPES in the National Academic Cooperation Program (PROCAD; process 0257052). LA Anjos (process 311801/2006-4 and 308489/2009-8) and MTA Olinto (process 308833/2006-6) were granted research
productivity scholarships by the Conselho
Nacional de Desenvolvimento Científico e Tecnológico (CNPq – National Council for Scientific and Technological Development).
References
1. Capita R, Alonso-Calleja C. Differences in reported winter and summer dietary intakes in young adults in Spain. Int J Food Sci Nutr 2005; 56(6): 431-43.
2. Ma Y, Olendzki BC, Li W, Hafner AR, Chiriboga D, Hebert JR et al. Seasonal variation in food intake, physical
activity, and body weight in a predominantly overweight population. Eur J Clin Nutr 2006; 60(4): 519-28.
4. Shahar DR, Froom P, Harari G, Yerushalmi N, Lubin F. Changes in dietary intake account for seasonal changes in cardiovascular disease rizk factors. Eur J Clin Nutr
1999; 53: 395-400.
5. Mitchikpe CES, Dossa RAM, Ategbo EAD, Van Raaij JMA, Kok Fj. Seasonal variation in food patern but not in energy and nutrient intakes of rural Beninese school-aged children. Public Health Nutr 2009; 12(3): 414-22.
6. Fowke JH, Schlundt D, Gong Y, Jin F, Shu X, Wen W et al., Impact of Season of Food Frequency Questionnaire Administration on Dietary Reporting. Ann Epidemiol
2004; 14: 778-85.
7. Westerterp KR, Plasqui G, Goris AHC. Water loss as a function of energy intake, physical activity and season.
Br J Nutr 2005; 93: 199-203.
8. Anjos LA, Wahrlich V, Vasconcellos MTL, Souza DR, Olinto MTA, Waissmann W et al., Development of a food frequency questionnaire in a probabilistic sample of adults from Niterói, Rio de Janeiro, Brazil. Cad Saúde Pública 2010; 26(11): 2196-204.
9. Souza DR, Anjos LA, Wahrlich V, Vasconcellos MTL, Machado JM. Ingestão alimentar e balanço energético da população adulta de Niterói, Rio de Janeiro, Brasil: resultados da Pesquisa de Nutrição, Atividade Física e Saúde (PNAFS). Cad Saude Publica 2010; 26(5): 879-90.
10. Associação Brasileira de Empresas de Pesquisa (ABEP).
Critério de Classificação Econômica Brasil. Disponível em http://www.abep.org/codigosguias/ABEP_CCEB. pdf. (Acessado em 07 de outubro de 2008).
11. Lohman TG, Roche AF, Martorell R. Anthropometric standardization reference manual. Champaign, Illinois: Human Kinetics; 1988.
12. World Health Organization. Obesity: preventing and
managing the global epidemic. Geneva: World Health
Organization; 2000. (WHO Technical Report Series, 824)
13. Universidade Estadual de Campinas. Tabela Brasileira de Composição de Alimentos, Versão II. 2. ed. Campinas: Unicamp; 2006.
14. United States Department of Agriculture (USDA), Agricultural Research Service. USDA National Nutrient Database for Standard Reference, Release 20; 2007.
15. Benzecry EH, Pinheiro ABV, Lacerda EMA, Gomes MCS, da Costa VM. Tabela para Avaliação de Consumo Alimentar em Medidas Caseiras. 5ªed. São Paulo: Editora Atheneu; 2005.
16. Iowa State University. Software for intake distribution estimation version 1.0. Iowa City, IA, USA; 2003.
17. Nusser SM, Carriquiry AL, Dodd KW, Fuller WA. A semi parametric transformation approach to estimating usual intake distributions. J Am Stat Assoc 1996; 91: 1440-9.
18. Nusser SM, Fuller WA, Guenther PM. Estimating usual dietary intake distributions: adjusting for measurement error and no normality in 24-hour food intake data. In:
Lyberg L, Biemer P, Collins M, De Leeuw E, Dippo C, Schwarz N, Trewin D. Survey Measurement and Process Quality. New York: Wiley and Sons; 1997. p. 689-709.
19. Food and Agriculture Organization. Human energy requirements. Report of a joint FAO/WHO/UNU expert
consultation. Rome; 2004. (FAO Food and Nutrition
Technical Report Series, 1).
20. Anjos LA, Ferreira BCM, Vasconcellos MTL, Wahrlich V. Gasto energético em adultos do Município de Niterói, Rio de Janeiro: Resultados da Pesquisa de Nutrição, Atividade Física e Saúde – PNAFS. Cien Saude Colet
2008; 13(6): 1775-84.
21. Institute of Medicine. Dietary Reference Intakes for Energy, Carbohydrate, Fiber, Fat, Fatty Acids, Cholesterol,
Protein, and Amino Acids (Macronutrients). Washington,
DC, National Academic Press; 2005.
22. Sociedade Brasileira de Cardiologia (SBC),
Departamento de aterosclerose. V Diretriz brasileira sobre dislipidemias e prevenção da aterosclerose; 2008.
23. Institute of Medicine. Dietary Reference Intakes for Calcium, Phosphorus, Magnesium, Vitamin D, and
Fluoride. Washington, DC, National Academic Press;
1997.
24. Institute of Medicine. Dietary Reference Intakes for Thiamin, Riboflavin, Niacin, Vitamin B6, Folate, Vitamin B12, Pantothenic acid, Biotin and Coline. Washington, DC, National Academic Press; 1998.
25. Institute of Medicine. Dietary Reference Intakes for
Vitamin C, Vitamin E, Selenium, and Carotenoids.
Washington, DC, National Academic Press; 2000a.
26. Institute of Medicine. Dietary Reference Intakes for Vitamin A, Vitamin K, Arsenic, Boron, Chromium, Copper, Iodine, Iron, Manganese, Molybdenum, Nickel,
Silicon, Vanadium and Zinc. Washington, DC, National
Academic Press; 2000b.
27. Institute of Medicine. Dietary Reference Intakes for Water, Potassium, Sodium, Chloride, and Sulfate. Washington, DC, National Academic Press; 2004.
28. Willett WC, Howe GR, Kushi LH. Adjustment for total energy intake in epidemiologic studies. Am J Clin Nutr
1997; 65(S1): 1220-8.
29. SAS Institute Inc. SAS 9.1. Cary, NC, USA; 2002/2003.
30. SPSS Inc. SPSS 13.0 for Windows. Chicago, IL, USA; 2004.
31. Willett WC. Nutritional Epidemiology. 2. ed. New York: Oxford University Press; 1998.
32. Hoffman K, Boeing H, Dufour A, Volatier JL, Telman J, Virtanen M et al., Estimating the distribution of usual dietary intake by short-term measurements. Eur J Clin Nutr 2002; 56(S2): 53-62.
34. Van Staveren WA, Deurenberg P, Burema J, De Groot LC, Hautvast JG. Seasonal variation in food intake, pattern of physical activity and change in body weight in a group of young adult Dutch women consuming self-selected diets. Int J Obes 1986; 10(2): 133-45.
35. Shahar DR, Yerushalmi N, Lubin F, Froom P, Shahar A, Kristal-Boneh E. Seasonal variations in dietary intake affect the consistency of dietary assessment. Eur J Clin Nutr 2001; 17: 129-33.
36. Pasqua, IC. Comportamento alimentar e estado
nutricional de trabalhadores em turnos: uma abordagem cronobiológica [dissertação de mestrado]. São Paulo: Universidade de São Paulo, Faculdade de Saúde Pública; 2003.
37. Rossato SL, Olinto MTA, Henn R, Anjos LA, Bressan A, Wahrlich V. Seasonal Effect on Nutrient Intake in Adults Living in Southern Brasil. Cad Saude Publica 2010; 26(11): 2177-87.
38. Lee CJ, Lawler GS, Panemangalore M, Street D.
Nutritional status of middle-aged and elderly females in Kentucky in two seasons: Part 1. Body weight and related factors. J Am Coll Nutr 1897; 6(3): 209-15.
39. Kuhnlein HV, Soueida R, Receveur O. Dietary nutrient profiles of Canadian Baffin Island Inuit differ by food source, season, and age. J Am Diet Assoc 1996; 96: 155-62.
40. Tokudome Y, Imaeda N, Nagaya T, Ikeda M, Fujiwara N, Sato J et al., Daily, Weekly, Seasonal, Within- and Between-individual Variation in Nutrient Intake According to Four Season Consecutive 7 Day Weighed Diet Records in Japanese Female Dietitians. J Epidemiol
2002; 12: 85-92.
41. Lopes MCS, Ferreira LOC, Batista-Filho M. Uso diário e semanal de sulfato ferroso no tratamento de anemia em mulheres no período reprodutivo. Cad Saude Publica
1999; 15(4): 799-808.
42. Nascimento SF. Estado nutricional e anemia em adolescentes do sexo feminino no Estado de Pernambuco, 1997 [dissertação de mestrado]. Recife: Universidade Federal de Pernambuco, Centro de Ciências da Saúde, Departamento de Nutrição; 2000.
43. Olinto MTA, da Costa JSD, Gigante DP, Menezes AMB, Macedo S, Schwengber R et al., Prevalência de anemia em mulheres em idade reprodutiva no Sul do Brasil. Bol Saude 2003; 17(1): 135-44.
44. Fabian C, Olinto MTA, da Costa JSD, Bairros F, Nácul L. Prevalência de anemia e fatores associados em mulheres adultas residentes em São Leopoldo, Rio Grande do Sul, Brasil. Cad Saude Publica 2007; 23(5): 1199-205.
45. Pinheiro MM, Ciconelli RM, Martini LA, Ferraz MB. Clinical risk factors for osteoporotic fractures in Brazilian women and men: the Brazilian Osteoporosis Study (BRAZOS). Osteoporos Int 2009; 20: 399-408.
46. Diniz AS, Santos LMP. Epidemiologia da hipovitamino A e xeroftalmia. In: Kac G, Sichieri R, Gigante D. (Eds).
Epidemiologia Nutricional. Rio de Janeiro: Fiocruz/ Atheneu; 2007. p. 325-46.
47. Gimeno SGA, Ferreira SRG. Fatores da dieta nas doenças cardiovasculares. In: Kac G, Sichieri R, Gigante D. (Eds). Epidemiologia Nutricional. Rio de Janeiro: Fiocruz/ Atheneu; 2007. p. 371-87.
48. Anjos LA, de Souza DR, Rossato SL. Desafios na medição da ingestão alimentar quantitativa de populações. Rev Nutr 2009; 22(1): 151-61.
49. Joachim G. The influence of time on dietary data: differences in reported summer and winter food consumption. Nutr Health 1997; 12(1): 33-43.