ORIGINAL
ARTICLE
ENGLISH VERSION
Nutritional and anthropometric profile
of adolescent volleyball athletes
*
Tania Abreu de Almeida
1and Eliane Abreu Soares
21. Nutricionist and specialist in Nutrition and Physical activity – Instituto de Nutrição, Universidade do Estado do Rio de Janeiro.
2. Nutricionist, Associate Professor – Instituto de Nutrição, Universidade do Estado do Rio de Janeiro (UERJ) e Instituto de Nutrição, Universidade Federal do Rio de Janeiro (UFRJ).
Received in 3/7/02 Approved in 21/50/03
Correspondence to:
Rua Marquês de Abrantes, 177 – 1.104 22230-060 – Rio de Janeiro, RJ
E-mail: [email protected]
ceive individualized nutritional orientation to improve their performance and quality of life.
Key words: Adolescent. Volleyball. Nutritional assessment.
Anthro-pometric assessment. Nutrition.
INTRODUCTION
Volleyball was created in 1895 by William Morgan. Wom-en started to play it only in 1928. In 1916, volleyball gets to Brazil, brought by the Youth Men Christian Association, and in 1944 the First Brazilian Championship was held1.
Volleyball is a sport that alternates aerobic and anaero-bic activity, thus requiring muscular strength and power capability. The athlete must possess flexibility, strength, power, agility and aerobic fitness to practice it2.
During adolescence, individuals undergo significant growth and maturation, and unique changes take place in the body, thus causing an increase of nutritional needs. As adolescent athletes have energetic needs that are different from the needs of adult athletes, one should pay heed not only to energetic suitability, but also to the intake of pro-tein and fluids before, during and after the exercise3.
Few are the studies3-9 that assess nutritional profile of young female volleyball athletes, with their anthropomet-ric features and checking nutritional suitability of macro and micronutrients, according to the recommended guide-lines.
The purpose of this research was, therefore, to assess dietary and anthropometric profiles of adolescent athletes from two clubs in the city of Rio de Janeiro.
METHODOLOGY
Subjects
Twenty-five volleyball female (15-19 years) athletes of two clubs in the city of Rio de Janeiro (Botafogo Futebol Clube and Fluminense Futebol Clube) were investigated. Their parents signed an informed consent form allowing their participation in the research.
ABSTRACT
re-Dietary assessment
The record of their intake during three days, consecu-tives or not, being one a weekend day, and a questionnaire of intake frequency, to assess the dietary profile of the sub-jects under investigation were used. These are the most used dietary assessment methods to calculate quantitative and qualitative energetic intake of an individual or a popula-tion10.
In spite of being a subjective method, prone to psycho-logical tendencies, the food-intake record is broadly used. To apply this method, the subject must record all ingested food at a particular period of time, and its respective amount10. The ingested food was recorded following home-style measurement, and further converted into grams and milli-liters, according to Pinheiro et al.11
Nutrients were assessed by a nutrition support software, designed by the Information Technology Center from Es-cola Paulista de Medicina12. The athletes’ dietary adequa-cy for the ingested nutrients was done by comparing it to American nutritional recommendations13,14.
In the questionnaire of nutritional frequency, food was divided into nine groups: meats, dairy, eggs, cereals, vege-tables, leaves, fruits, fat, and miscellaneous, in order to qualitatively assess the athletes’ food intake. The question-naire of nutritional frequency is used to measure the qual-ity of an individual’s “habitual” intake. This questionnaire is valid only if its results are compared to another dietary assessment method15. Thus, to enhance accuracy of nutri-tional assessment, a number of methods are used simulta-neously16.
To calculate total energetic expenditure, expenditure at all activities carried out by the athletes over 24 hours, and hours or sleep per night (8 hours) were taken into account; main activity, study (4.5 hours a day); physical/tactical training (2.5 hours a day); other daily activities (9 hours a day)17.
Anthropometric assessment
Total body mass, stature and circumferences of arms, abdomen, hip, thigh, and the skinfolds triceps, biceps, chest, subscapular, suprailiac, abdominal, and thigh were assessed. These variables were measured by a single, anthropome-try-specialist evaluator.
To measure total body mass, one used a digital scale Seca®, maximum capacity of 150 kg, and the athletes were in barefoot, and with as little clothing as possible. To de-termine stature, a portable stadiometer Soehnle® was used. Upon assessment, the athletes remained in a standing posi-tion, barefooted, with feet close together and in inhaling apnea, the head following the Frankfurt plan18.
Perimeters were measured with a metal anthropometric tape Sanny®, with 0.1 cm increments, according to Fernan-des18. Skinfolds were measured with a Harpenden® caliper. Measurements were on the right side of the body, refer-ence points were marked and skinfolds were pinched with the thumb and indicator fingers. Three measurements were made and the mean was recorded. All measurements were made at the same time, before practice. Body density was calculated according to Sloan protocol19, with the measures of triceps and suprailiac skinfolds.
The proportion of body fat was calculated according to Brozek equation (1963)19.
Statistical analysis
For statistical analysis one used the non-parametric nor-mality test Sign test to assess the investigated nutrients. Only for mineral calcium we used the normality Student’s t test.
RESULTS
Characterization of the sample
The assessed athletes’ mean age was 16 ± 3.55 years, who practiced volleyball for five years and trained for two and a half hours a day, in average, five days a week. Aver-age sleep time was of eight hours a day.
From the 25 athletes, only one was not a student. Twen-ty-two were in high school, two were in college.
All athletes menstruated at the time of the research, and mean age for menarche was around 12 years of age (12.38 ± 1.42 years). Athletes had monthly menses.
No athlete mentioned use of vitamins, food supplements or any medication during the period of investigation.
Dietary assessment
Dietary assessment was done through a three-day food-intake record, and a questionnaire of food frequency.
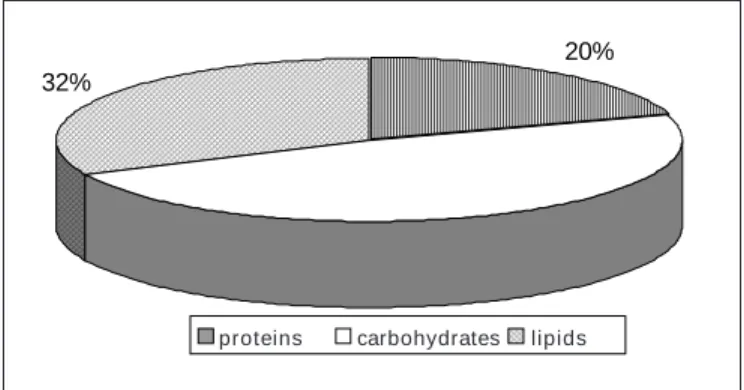
Daily calories intake was around 3,945 ± 633 kcal (table 1). Proportional distribution of macronutrients in relation to total energetic value was 20% for proteins, 48% for car-bohydrates, and 32% for lipids (figure 1).
There was significant difference in the daily intake of the studied nutrients, such as calcium, vitamin E and folate, when compared to American guidelines (table 2).
There was significant difference for intake of calcium, vitamin E and folate, with variation coefficients lower than 0.001 and 0.002, respectively, when compared to Ameri-can guidelines13,14.
TABLE 1
Energy and macronutrients intake of the volleyball players
Variables M ean ± SD M edian M inimum M aximum
Energy (kcal/d) 3,945 ± 633.0 3,749,0 1,092.0 4,817.0
kcal/kg/d 37 ± 30 0.032.0 90.18.0 073
Total protein (g/d) 151 ± 250 9,148.0 046 184
g/kg/day 2.42 ± 0.33 0.0002.33 0.0000.81 .00002.87
Carbohydrates (g/d) 418 ± 770 0.429.0 150 567
g/kg/day 6.55 ± 1.11 0.0006.41 0.0002.10 0.0009.75
Lipids (g/day) 118 ± 260 .0112.0 037 155
TABLE 2
M icronutrients intake of the volleyball players
Nutrients M ean ± SD M edian M inimum M aximum
Niacin (m g) 22.65 ± 13.72 23.22 02.65 00.38.72
Vitam in B6 (m g) 13.69 ± 19.15 05.44 00.28 00.42.29
Folate (µg)* * 244.98 ± 159.78 200 39.59 0.463.00
Vitam in C (m g) 119.73 ± 45.640 100 07.03 0.430.96 Vitam in E (m g)* * 15.60 ± 14.81 10.74 01.00 0.036.64 Calcium (m g)* 1,199.17 ± 315.25.0 1,204 237.120 1,824.39
Iron (m g) 27.38 ± 9.350 28 08.11 0.035.44
Zinc (m g) 12.73 ± 9.350 13 0.60 00.20.16
* p < 0.001; * * p < 0.002
Anthropometric assessment
The athletes’ mean total body mass was 64.35 ± 6.12 kg; stature, 174 ± 0.06 cm; proportion of fat, 20.51. Measures of skinfolds and circumferences are presented in table 5.
DISCUSSION
Studies have shown that athletes, particularly females, have an inadequate nutritional intake when compared to
their energetic expenditure3,4. Such energetic inadequacy is negatively reflected in the intake of vitamins and miner-als5.
To calculate total energetic expenditure, energetic ex-penditure of all activities performed by the athletes over 24 hours was taken into consideration. Mean result was of 2,500 kcal/day, in accordance with Ainsworth’s method17. The athletes had a daily average intake of 3,749 kcal/day, which is 150% of the energetic amount, calculated by that method.
Adolescents need a higher protein intake than adults. The ideal protein intake for growth, physical performance and enhancement of muscular mass is around 1.5 g/kg/day20,21. Daily intake of proteins by the athletes was 2.4 g/kg/day, an adequacy of 160%, equivalent to 20% of total energetic value. This is explained by the high frequency of protein-rich food, such as chicken, beef and egg (table 6).
Lemon (1997)21 suggests that high-protein diets do not necessarily enhance muscular mass, and they may also in-crease urine loss of calcium, play an atherogenic role as they are associated to animal fat (which is rich in saturated fatty acids), and increase loss of fluids, due to urinary ex-cretion to eliminate the additional nitrogen found in this
20%
48% 32%
proteínas carboidratos lipídeos
Fig. 1 – Percentage of the macronutrients in relation to the total
ener-getic value of the volleyball players’ diets
TABLE 3
Energy and macronutrients intake of players from both clubs
Variables Botafogo Fluminense
(mean ± (mean ±
standard standard
deviation) deviation)
Energy (kcal/d) 23,090 ± 915.90 2,138.16 ± 2,159.00
Proteins (g/d) 86.00 ± 21.23 83.76 ± 46.20
g/kg/d 1.35 ± 0.39 1.32 ± 0.81
Carbohydrates (g/d) 322.00 ± 159.00 220.92 ± 144.09
g/kg/d 5.02 ± 3.04 3.44 ± 2.43
Lipids (g/d) 89.00 ± 37.00 65.97 ± 53.90
There w as no significant difference of energy consum ption from m acronutrients in-take betw een the tw o groups.
TABLE 5
Anthropometric parameters of the volleyball players
Skinfolds (mm) M ean ± SD
Triceps 17.55 ± 3.870
Biceps 8.07 ± 2.42
Chest 10.57 ± 2.660
Subscapular 13.74 ± 3.880
Suprailiac 12.95 ± 4.130
Abdom inal 21.01 ± 5.940
Thigh 26.02 ± 6.430
Circumferences (cm) M ean ± SD
Arm 26.01 ± 1.850
Abdom en 76.17 ± 5.180
Thigh 52.29 ± 3.300
Hip 97.48 ± 3.720
TABLE 6
Food often eaten by volleyball athletes from Botafogo and Fluminense clubs
Food Daily 6-4 times/ w eek 3-2 times/ w eek 1 time/ w eek
Chicken 01 8 14 01
Beef 03 6 10 04
Egg 01 4 07 11
M ilk 11 1 05 04
Cheese 05 5 09 01
Beans 12 5 04 02
Rice 15 7 01 00
Bread 16 2 03 00
Cookie 07 3 03 04
Lettuce 02 6 07 02
Potato 04 4 04 03
Banana 09 7 02 06
Oil 24 0 00 00
Candy 03 7 03 00
Chocolate 00 1 07 04
TABLE 4
M icronutrients intake of volleyball players from different clubs
M icronutrients Botafogo Fluminense
Niacin (m g) 14.10 ± 8.320 10.77 ± 9.870
Vitam in B6 (m g) 2.22 ± 4.58 04.80 ± 22.23
Folate (µg) 82.01 ± 53.77 94.18 ± 68.72
Vitam in C (m g) 108.74 ± 210.86 67.18 ± 63.52
Vitam in E (m g) 4.19 ± 3.78 2.94 ± 3.32
Calcium (m g) 785.17 ± 397.30 889.20 ± 755.94
Iron (m g) 12.21 ± 5.500 12.62 ± 7.290
Zinc (m g) 7.28 ± 3.75 5.09 ± 5.01
There w as no significant difference of energy consum ption from m icronutrients in-take betw een the tw o groups.
type of diet. Fluid replacement should be more carefully monitored when there is an intake of protein-rich diets.
As it is highly used for moderate intensity exercises, car-bohydrate intake is associated to physical performance, being the highest source of energy for the muscle under exertion22. Factors such intensity and duration of exercise, the influence of physical training and diet may change in-take needs of this nutrient22. The recommendation for those who practice physical exercises is around 55 to 60% of carbohydrates of the overall energetic value. Recommen-dations are to increase carbohydrate intake to 65 to 75% of total energetic intake for endurance athletes and individu-als who have daily practice. The athletes in our study had an average carbohydrate intake of 47% of the total ener-getic amount, a lower proportion than
the recommended for athletes under growing process and daily practice. To maximize muscular glycogen storage, carbohydrate intake of 6 to 10 g/kg/ day20 is recommended. In our study, we found a mean of 6.41 g/kg/day, ranging from 2.1 to 9.75g/kg/day.
Low-carbohydrate diets may compromise physical per-formance, causing negative effects in those who practice physical activities23. Therefore, particularly after practice and competitions, it is advisable the intake of glycemic food (as hydro-electrolytic beverages, breads etc), to favor carbohydrate replacement.
Lipid intake should not be higher than 30% of the over-all energetic value. The role of lipids for performance of physical activity is as reserve energy only20. The athletes of our sample had a lipid intake of 32% of the overall ener-getic amount, higher than the ideal proportion.
Furthermore, in accordance with ADA and CDA (Ameri-can Dietetic Association and The Canadian Dietetic Asso-ciation)20, vitamins and minerals have an important role in the metabolism of macronutrients. If energetic and protein intake is adequate, probably there will be no inadequacies in the intake of these micronutrients.
According to “The National Institutes of Health Con-sensus Development Conference Statement Optimal Cal-cium Intake”7, the recommended calcium intake for ado-lescents and young adults with age ranging between 15 and 24 years is around 1,200-1,500 mg/day, and the cur-rent American recommendation is of 1,300 mg/day for fe-male adolescents. Adolescents have an increased need of calcium, particularly for growth, and it is the time of life 50% of the bony body mass is acquired, as it is fully formed by the age of 18, approximately, and 37% of its develop-ment takes place during the growth stretch24.
Dietary studies show that adolescents, particularly fe-males, do not intake appropriate amounts of this mineral. In the years of 1977 and 197824, it was estimated that cal-cium intake among female adolescents was of about 799 mg/day, and that intake of food rich in calcium decreases with age.
The studied athletes had a daily intake of 1,204 mg/day. Current American recommendation14 is of 1,300 mg/day. When this amount is compared to the daily intake of these athletes, one can see a 92% adequacy of current recom-mendation. Low calcium intake can be explained by little intake of mild and dairy food, which are sources of calci-um, as only 11 of the studied athletes drank milk daily, 44% of the total (table 5). Low calcium intake at growth stage can lead to adverse effects in bone growth and bone mass peak14.
According to Gimmston et al.25, volleyball is a sport of impact, as it produces a reaction power by hitting the ground 3 to 6 times the body mass power. Volleyball players present a higher bone density than non-players of the same age, particularly hips and lumbar spine. We suggest that our volleyball players may have higher need of calcium, due
to the physiologic moment they are undergoing, and the type of sport they practice25.
Iron-trace is a mineral that directly influences athletes’ performance. Female athletes should pay special heed in iron intake, particularly due to losses that take place with menses. Iron deficiency also directly influences athletes’ physical performance17.
The investigated players had an iron intake higher than the recommended for their age, being 188% of the Ameri-can recommendation for non-athlete individuals13.
The assessed athletes had a zinc intake of 13.23 mg/day, being the ideal amount of 12 mg/day (NRC/RDA, 1989). Zinc is present in animal products, and their intake of beef and chicken was high, therefore not adequate.
B-complex vitamins are directly related to energetic in-take, and the highest the energetic intake is, the more one should use these vitamins. The athletes had an adequate intake of these vitamins, due to high energetic consump-tion26,27.
Due to low-protein intake and high turnover rate, there may be an increased need of vitamin B618. Athletes had an average vitamin B6 intake of 15.44 mg/d, being higher than the current American recommendations of 12 mg/d28.
The amount of folate intake by the athletes is 50% high-er than the ideal amount14. The amount of ingested folate ranged from 39 to 463 mg/day, median of 200 mg/day, much lower than current American recommendations. This nu-trient seems to be at risk in these athletes diet, and the in-take of dark-green leaves and fruits like oranges, strawber-ries, kiwi and avocado should be encouraged.
Vitamin C is involved in a number of metabolic reac-tions, acts on the synthesis of collagen, is related to immu-nologic function, and increases absorption of non-heme iron, preventing iron-deficiency anemia, and is an effec-tive anti-oxidant26,27. The athletes had an adequate intake of vitamin C, according to IM/DRI (2000) (Institute of Med-icine/Dietary Reference Intake)28, with daily ingestion of 100 mg.
Intake of vitamin E was of 11 mg/day, being inadequate for age and gender, particularly of athletes. The ingested amount is 71% of the current recommendation20.
min-erals may also be due to incomplete information from nu-trition tables and software.
According to ADA29, diets of some youth athletes, partic-ularly females, are poor in energy and nutrients. As dietary recommendations for adolescents intend to favor growth and development, their practice of competitive sports en-hances the role of diet for these athletes.
According to Fleck19, who used the same protocol in his study, the ideal percentage of body fat for youth female volleyball athletes is of 19%. The athletes in our investiga-tion presented a fat proporinvestiga-tion of 20.5%, corresponding to 108% of the amount for that type of physical activity. This author mentions that athletes of sports such as volleyball, basketball and rowing have a fat-free body mass higher than athletes of other sport modalities.
We have not found in the literature data on circumfer-ence measurements for volleyball athletes. These anthro-pometric measures were performed for a more detailed as-sessment of our athletes.
The athletes we investigated had weight and height sim-ilar to those of other studies19,29.
High stature, power, speed, motor coordination and jump-ing performance are features volleyball athletes should present. It is suggested that to enhance performance, vol-leyball athletes should have a low proportion of body fat2,6.
CONCLUSION
Young athletes should be advised on the importance of dietary adequacy for health and performance improvement. Many young athletes are influenced by misinformation provided by coaches, family members, friends and the media.
To enhance performance, athletes should reduce the pro-portion of body fat and increase the lean mass, through a balanced diet and increase of physical activity.
One should show to athletes, coaches and family mem-ber the importance and benefits of a proper diet. It is to be stressed the need of further investigations on dietary as-sessment for youth athletes of different sports modalities.
All the authors declared there is not any potential conflict of interests regarding this article.
REFERENCES
1. Borsari JR. História e regras. In: Voleibol: aprendizagem e treinamento, um desafio constante. 1a ed. São Paulo: Editora EPU, 1989;3-4. 2. Schutz LK. Volleyball. Phys Med Rehabil Clin N Am 1999;10:19-34. 3. Thompson JL. Energy balance in young athletes. Int J Sport Nutr 1998;
8:160-74.
4. Champan P, Toma RB, Tuveson RV, Jacob M. Nutrition knowledge among adolescent high school female athletes. Adolescence 1997;32:437-46.
5. Elmadfa I, Rupp B. Nutritional status of young athletes. Bibl Nutr Dieta 1994;51:S163-5.
6. Morrow JR, Jackson AS, Hosler WW, Kachurik JK. The importance of strength, speed and body size for team success in women’s intercolle-giate volleyball. Res Q Exerc Sport 1979;50:429-37.
7. Tobelmann RC. Estimated dietary calcium intake and food sources for adolescent females. J Adolesc Health 1997;20:S20-6.
8. Viviani F, Baldin F. The somatotype of “amateur” Italian female volley-ball-players. J Sports Med Phys Fitness 1993;33:400-4.
9. Bernadot D. Working with young athletes: view of nutritionist on sports medicine team. Int J Sport Nutr 1996;6:110-20.
10. Garry PL, Koehler. Problemas de la interpretación de los datos dietéticos y bioquímicos obtenidos en estudios de población. In: Conocimientos ac-tuales sobre nutrición. 6th ed. Washington DC: ILSI Press, 1991; 471-9. 11. Pinheiro AB, Lacerda EM, Benzecry EH, Gomes MC, Costa VM.
Tabe-la para avaliação de consumo alimentar em medidas caseiras. 4a ed. [s.n.], Rio de Janeiro, 1998.
12. Centro de Informática em Saúde da Escola Paulista de Medicina. Siste-ma de Avaliação Nutricional de São Paulo. Versão 2.5, 1993.
13. Institute of Medicine, Food and Nutrition Board, Dietary reference in-take, for thiamin, riboflavin, niacin, vitamin B6, folate, vitamin B12, pan-tothenic acid, biotin, and coline. Washington D.C.; National Academy Press, 1998.
14. National Research Council – Recommended dietary allowances, 10th ed. Washington DC: National Academy Press, 1989;284.
15. Pao EM, Cypel YS. Cálculo de la ingesta alimentaría. In: Conocimentos actuales sobre nutrición. 7a ed. North America; ILSI Press, 1999;531-41.
16. Dwyer J. Avaliação do consumo alimentar. In: Shils ME, Olson JA, Shi-ke M, Ross AC, editors. Tratado de nutrição moderna na saúde e na doença. 9a ed. Manole, 2001;1001-26.
17. Ainsworth B, Haskel WL, Leon AS, Jacobs DR, Montoye HJ Jr, Sallis JF, et al. Compendium of physical activities: classification of energy costs of human physical activities. Med Sci Sports Exerc 1992;25:71-80.
18. Fernandes JF. Avaliação antropométrica. In: A prática da avaliação físi-ca. Rio de Janeiro: Shape,1999;24-32.
19. Fleck SJ. Body composition of elite American athletes. Am J Sports Med 1983;11:S398-403.
20. Position of the American Dietetic Association and Canadian Dietetic Association: Nutrition for physical fitness and athletic performance for adults. J Am Diet Assoc 1993;93:691-6.
21. Lemon PWR. Dietary protein requirements in athletes. Nutr Biochem 1997;8:52-60.
22. Jacobs KA, Sheman WM. The efficacy of carbohydrate supplementa-tion and chronic high carbohydrate diets for improving endurance per-formance. Int J Sport Nutr 1999;8:92-115.
23. Ribeiro BG, Pierucci APTR, Soares EA, Carmo MGT. A influência dos carboidratos no desempenho físico. Rev Bras Med Esporte 1998;4:197-202. 24. Morgan KJ. Magnesium and calcium dietary intakes of the US
popula-tion. J Am Coll Nutr 1985;4:195-206.
25. Alfredson H, Norström P, Lorentzon R. Bone mass in female volleyball players and nonactive females. Calcif Tissue Int 1997;60:338-42. 26. Armstrong EL, Meresh CM. Vitamin and mineral supplements as
nutri-tional aids to exercise performance and health. Nutr Rev 1996;54:149-58. 27. Rokitzki L, Sagredos A, Keck E, Sauer B, Keul J. Assessment of vita-min B2 status in performance athletes of various types of sports. Int J Sports Med 1994;15:435-40.