123 Development of a software for evaluation and control of sensitometric characteristics
Radiol Bras 2007;40(2):123–126 Original Article
DEVELOPMENT OF A SOFTWARE FOR EVALUATION AND CONTROL
OF SENSITOMETRIC CHARACTERISTICS IN AUTOMATIC FILMS
PROCESSING*
Vagner Ferreira Cassola1, Gabriela Hoff2
OBJECTIVE: To develop of a software tool for evaluation and control of sensitometric curves. MATERIALS AND METHODS: A method was developed for obtaining high- and low-contrast films sensitometric values, with no need to define wedge steps. RESULTS: The software named Sensito was implemented and tested utilizing data of sensitometric strips from conventional radiology, hemodynamics, and mammography depart-ments. The feasibility of analyzing sensitometric curves from these areas remained evidenced with no need of user-dependent adjustments, and with no deviation in the evaluated sensitometric parameters and varia-tions. CONCLUSION: The software allows the creation of a database including sensitometric curves from different processors in a same institution, easily generating gamma curves of a register and constant charts of the evaluated sensitometric characteristics, constituting an important tool for sensitometric control. Keywords: Automatic processor; Sensitometric curve; Sensitometry.
Desenvolvimento de um programa computacional para avaliar e controlar as características sensitométricas em processamento automático.
OBJETIVO: Desenvolver um programa computacional para avaliar e controlar as características das curvas sensitométricas. MATERIAIS E MÉTODOS: Para o desenvolvimento do programa, foi elaborado um método de obtenção dos valores das características sensitométricas, de filmes de baixo e alto contraste, sem a necessidade da fixação de degraus de referência. RESULTADOS: O programa, denominado Sensito, foi im-plementado e testado utilizando dados sensitométricos de curvas características dos departamentos de ra-diologia convencional, hemodinâmica e mamografia. Ficou comprovada a possibilidade da análise das cur-vas sensitométricas destas áreas sem a necessidade de ajustes, dependentes dos usuários, e sem incorrer em desvios nos parâmetros sensitométricos avaliados e na variação destes. CONCLUSÃO: O programa possibilita a criação de um banco de dados de curvas sensitométricas para diferentes processadoras de uma instituição, gerando com facilidade as curvas sensitométrica e gama, de um registro, e os gráficos de cons-tância das características sensitométricas avaliadas, fornecendo importante ferramenta para manter o con-trole sensitométrico.
Unitermos: Processadora automática; Curva sensitométrica; Sensitometria.
Abstract
Resumo
* Study developed at Pontifícia Universidade Católica do Rio Grande do Sul (PUCRS), Grupo de Experimentação e Simulação Computacional em Física Médica (GESiC), Porto Alegre, RS, Brazil.
1. Master Degree Student at Program of Post-graduation in Energy and Nuclear Technologies – Departamento de Energia Nuclear da Universidade Federal de Pernambuco (UFPE), Recife, PE, Brazil, Collaborator for Grupo de Experimentação e Simula-ção Computacional em Física Médica (GESiC), Porto Alegre, RS, Brazil.
2. PhD, Professor at Pontifícia Universidade Católica do Rio Grande do Sul (PUCRS) School of Physics, Coordinator for Grupo de Experimentação e Simulação Computacional em Física Mé-dica (GESiC), Porto Alegre, RS, Brazil.
Mailing address: Vagner Ferreira Cassola. Avenida Ipiranga, 6681 – Prédio 10. Porto Alegre, RS, Brazil, 90619-900. E-mail: [email protected]
Received April 12, 2006. Accepted after revision July 4, 2006.
INTRODUCTION
Small changes in the automatic films processing may result in a significant loss or degradation in the quality of information recorded on radiographic images. Inad-equate processing affects the image
qual-ity, demanding higher radiation dose for obtaining a satisfactory radiological im-age(1). Therefore, quality control is essen-tial for guaranteeing the accuracy of x-ray-based diagnoses. For this purpose, sensito-metry is one of the most effective methods for monitoring changes in conditions of the automatic images processing(2–4).
The Order (Portaria) No. 453/98 of Se-cretaria de Vigilância Sanitária do Minis-tério da Saúde (Brazilian Ministry of Health National Sanitary Vigilance Agency)(5) es-tablishes that in a quality assurance pro-gram, a sensitometric test must be per-formed in the images processing system, at least weekly for conventional radiology, and daily for mammography. Considering that sensitometry is a way to indicate cor-rective measures to avoid deterioration of radiological images, it would be advisable
124
Cassola VF, Hoff G
Radiol Bras 2007;40(2):123–126
The present study presents Sensito, a software tool for evaluation and manage-ment of sensitometric curves characteris-tics. A generalized way of analysis was adopted in the development of this soft-ware, therefore sensitometric curves can be evaluated by the same software in differ-ent modalities of Radiology, with no need of user-dependent adjustments, and with no systematic deviation in the evaluated sen-sitometric parameters and variations. If previously registered, non-conformities are automatically detected as the sensitometric curve graph is generated. The software al-lows the creation and maintenance of a database including sensitometric curves from different processors in a same insti-tution, easily generating gamma curves of a register and constant charts of the evalu-ated sensitometric characteristics, which play an essential role in the images quality control(6).
MATERIALS AND METHODS
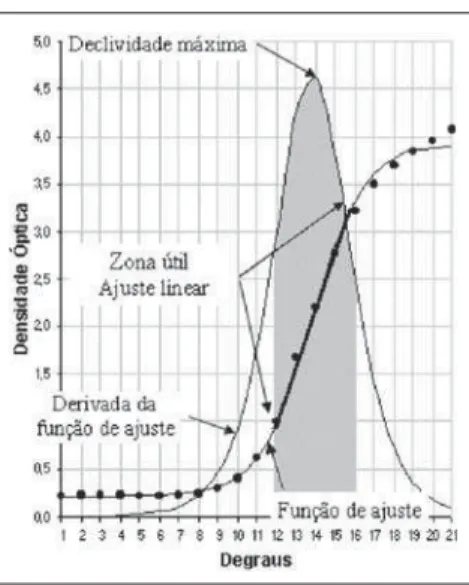
The development of the software for sensitometric analysis demands the knowl-edge on the definitions of some specific characteristics of the sensitometric curve, or H&D curve(4) (Hurter & Driffield), as-sociating the film blackening degree, or optical density (OD) with the film expo-sure. Based on the sensitometric curve, it is possible to evaluate the contrast, latitude, gradient, film speed, and base+fog values. The foot of the curve corresponds to low density regions, and the shoulder of the curve corresponds to high density regions. The linear region of the curve corresponds to densities useful for diagnosis(4), and hereafter will be denominated “useful zone”, as shown on Figure 1.
The determination of the sensitometric curve characteristics undergoes a critical stage: the definition of the useful area of the film, since there is no step or specific density defining the beginning or end of this area, as it happens in some software tools or data collection protocols. This zone should only be characterized by the region where the sensitometric curve presents a linear behavior(4). The center of this region is approximately the point of involution in the curve. Therefore, if a software is able to automatically generate an equation for
to sensitometric data, the useful zone may be defined by means of a percentage varia-tion in the correspondent maximum gradi-ent of the involution point in the equation. Based on sensitometric data, adjustments were determined for representing the be-havior of the optical densities data as func-tion of the logarithm of relative exposure, represented by the hyperbolic tangent (tanh) function. Parameters were added to this function, generating the following equation whose values, on average, are compatible with the optical densities data of the sensitometric curves:
DO(x) = M .[tanh((x – PM). PASSO) + ZF]
+ BF
where: x represents the logarithm of rela-tive exposure; PM is the logarithm of rela-tive exposure concerning the sensitometric curve mean point; BF is base+fog, by defi-nition, the optical density of the first step of the curve; PASSO represents the equa-tion growth swiftness; ZF corresponds to zero to start off with (zero factor principle); M represents the equation height. All the parameters are automatically determined according to the sensitometric data ob-tained.
The Figure 2 demonstrates the approxi-mation of actual sensitometric data of a sensitometric curve with those generated by the adjustment curve. The data demon-strated that a 30% variation in the gradient corresponding to the involution point
al-lows the definition of a region where a straight line can be drawn, with a 99% lin-ear relationship between this line and sen-sitometric data. The ratio was obtained through the square of the Pearson product-moment correlation. The straight-line equa-tion is obtained by means of a linear adjust-ment of the optical densities in this region, as follows:
DO(x) = G.x + A
where: x represents the logarithm of rela-tive exposure; G is the curve gradient; A is a constant concerning the straight-line in-tersection point with the horizontal axis.
Based the straight-line equation G gra-dient, the useful zone, the sensitometric pa-rameter of the gradient is estimated. The film latitude is obtained by the variation of the logarithm of relative exposure concern-ing the beginnconcern-ing and end of the useful zone, determined by the 30% variation in the maximum gradient. The contrast is a re-sult of the variation of optical densities cor-responding to the logarithms of relative ex-posure, of the steps utilized for determin-ing the latitude which are estimated by means of the straight-line equation. The speed, corresponding to the reverse loga-rithm of relative exposure concerning the optical density 1 above the base+fog value, may be estimated by utilizing the linear ad-justment as per the equation:
1 + (base+fog) – A
G
Speed = [ ]–1
Figure 1. Sensitometric curve: base+fog, foot of the curve, zone useful for diagnosis, shoulder of the curve and maximum density.
125 Development of a software for evaluation and control of sensitometric characteristics
Radiol Bras 2007;40(2):123–126
RESULTS
The adjustment equation was tested for conventional x-ray, hemodynamics and mammography curves, as shown on Fig-ures 3, 4 and 5. The values generated by the equation demonstrated a great similarity to the values of optical densities of conven-tional x-ray and hemodynamic films evalu-ated, with maximum deviation among den-sity values lower than 7%. For the mam-mography film curve, as shown on Figure 5, there was a difference in values corre-sponding to the curve foot and shoulder, but, as it can be observed, the correspond-ing steps are similar in both curves, dem-onstrating a similar behavior between curve and equation. This reflects the points asym-metry on the curve describing the film be-havior. However, the adjustment equation if utilized just for estimating the involution point of the curve, i.e., of the mean point in the useful zone of the curve and of the limits corresponding to the beginning and end of this zone. Therefore, the adjustment equation should present a similar behavior, mainly in the center of the curve to allow a more accurate estimation of the useful zone of the film by means of the gradient varia-tion. This similarity in the behavior in the center of the curve was observed in all of the films evaluated.
Based on the described adjustment equation, a software tool for analysis of sensitometric curves was developed in C++ language, utilizing the Borland C++ Builder 6 compiler, and the Microsoft
Ex-Figure 5. Graph demonstrating the adjustment curve values (continuous line) in comparison with the optical density of a mammographic film.
Figure 4. Graph demonstrating the adjustment curve values (continuous line) in comparison with the optical density of a hemodynamic film.
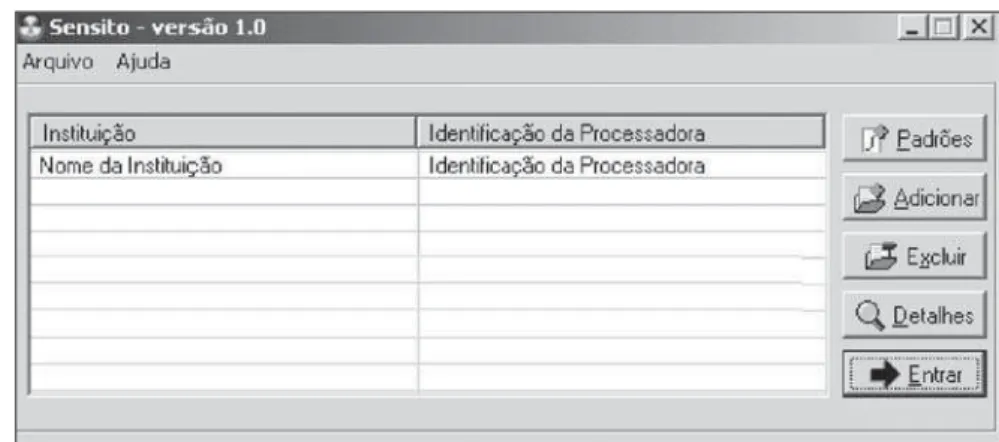
Figure 6. Sensito initial window.
cel application. This software denominated Sensito, besides analyzing the sensitomet-ric curves characteristics, allows the gen-eration of a databank to facilitate the sen-sitometric management of such character-istics, easily generating constant graphs.
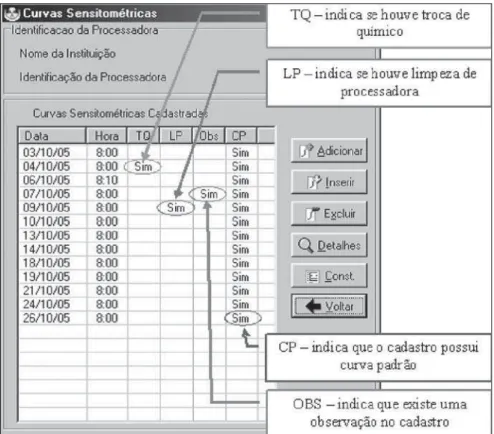
The beta version of this software was tested by the Radiology Unit at Hospital de Clínicas de Porto Alegre, and modifica-tions and adjustments were made to gen-erate the first version of the software (Fig-ure 6). Upon visualization of a curve in the processor data bank, the software indicates the occurrence of chemical replacement, processor cleaning, existence of any note linked to the register, or if the curve follows a standard (Figure 7). This information fa-cilitates the sensitometric control; anoma-lies detected by the sensitometric curve in the films developing may be better under-stood with this type of analysis.
The sensitometric curves graphs, to-gether with the standard curve, if available, are visualized on an Excel worksheet gen-erated by the software itself. The space be-low the graph shows the base+fog value, film speed, contrast and gradient for both the present and standard curves. The present and standard curves deviations are shown on the column “Deviations”, beside the column “Thresholds” (acceptance limit). If any of the values present a devia-tion higher than the acceptance limit, the note “Out-of-Limit” is shown, as it can be seen on Figure 8.
Concomitantly with the Excel graphs of sensitometric curves, a gamma curve con-cerning the visualized register is generated. The gamma curve may be a way of deter-mining the ideal processing conditions, and, on the other hand, it may be useful for detecting processing problems(7). Together
126
Cassola VF, Hoff G
Radiol Bras 2007;40(2):123–126
with the graph, the highest contrast found and the value of the area below the curve are displayed.
The constant graphs may be automati-cally generated from a mean value of a period defined by the user or from a stan-dard curve. A constant graph demonstrates na interest-value (the speed rate, for ex-ample) as a function of time(6). The base+ fog, film speed, contrast and gradient data are orderly displayed on an Excel work-sheet, together with the respective constant
graphs and acceptance limits, based on the mean interval values or the processor stan-dard curve. The acceptance limits may be defined by the users.
The Sensito software is available for free download at: http://www.pucrs.br/ fisica/fimebi/gesic/sensito.htm
DISCUSSION
Problems associated with radiological films processing still exist(8) and should be
Figure 7. Databank registers showing the schedule of chemical replacement (TQ), processor cleaning (LP) and notes (OBS).
highlighted. The Sensito software was de-veloped as an important tool for sensito-metric control, with a quite friendly inter-face, and a manual including a step-by-step tutorial. More than 100 curves of films and different processors were tested aiming at validating the method for generation of sensitometric curves. The mean deviation between values of sensitometric curves and those resulting from the equation was lower than 10%. This result demonstrates that the adjustment equation is appropriate for the data to be analyzed. So this software can be utilized both for analysis of low-contrast films (in hemodynamics, for ex-ample) and high-contrast films (in mam-mography, for example).
Acknowledgements
The authors thank the physicist and Master Degree in Education Alexandre Bacelar, and the physicist Fernanda Ramos de Oliveira, of Hospital de Clínicas in Porto Alegre, RS, Brazil.
REFERENCES
1. Suleiman OH, Conway BJ, Rueter FG, Slayton RJ. Automatic film processing: analysis of 9 years of observations. Radiology 1992;185:25–28. 2. Kofler JM, Gray JE. Sensitometric responses of
selected medical radiographic films. Radiology 1991;181:879–883.
3. Haus AG. Mammography imaging physics: screen-film processing and viewing condition considerations. RSNA Categorical Course in Breast Imaging 1999;59–77.
4. Magalhães LAG, Azevedo ACP, Carvalho ACP. A importância do controle de qualidade de proces-sadoras automáticas. Radiol Bras 2002;35:357– 363.
5. Brasil. Secretaria de Vigilância Sanitária. Minis-tério da Saúde. Regulamento técnico. Diretrizes de proteção radiológica em radiodiagnóstico mé-dico e odontológico. Portaria nº 453. Brasília: Di-ário Oficial da União, 2/6/98.
6. Gray JE. Technical aspects of screen-film radiog-raphy, film processing, and quality control. RadioGraphics 1997;17:177–187.
7. Hendrick RE, Berns EA. Optimizing mammo-graphic techniques. RSNA Categorical Course in Breast Imaging 1999;79–89.
8. Magalhães LAG, Oliveira SR, Silva MO, Aze-vedo ACP, Carvalho ACP. Avaliação da veloci-dade de processamento de processadoras automá-ticas utilizando o método “STEP test”. Radiol Bras 2004;37:185–186.