Arq Neuropsiquiatr 2011;69(2-A):166-169
166
Article
Mortality from epilepsy
Brazil (capitals), 1980-2007
Marleide da Mota Gomes1
ABSTRACT
Objective: To provide data about age, gender, time and space variation by means of mortality statistics from epilepsy in Brazil. Method: It was used demographic and mortality data obtained from the Brazilian Ministry of Health, regarding Brazil (capitals)over the calendar years 1980-2007. For the description of the data it was used Microsoft Office Excel 2007 spreadsheet, and figuring of trends by linear regression, GraphPad Prism 5.0. Results:
There is a tendency to elderly mortality, and male mortality in almost age group, although regarding the relative frequency rates by age, 20-39 age strata is more representative. The mortality at home is proportionally predominant at 20-29 years of age, 47.52%. Adjusted death rates/100,000, 2007, do not show clear regional predominance. Conclusion: We can infer that various deaths coded as epilepsy, may be due to an acute symptomatic seizures. Sudden unexplained death in epilepsy (SUDEP) may be misdiagnosed and probably more represented at the group with more deaths at home.
Key words: epilepsy, mortality, death certificates.
Mortalidade por epilepsia: Brasil (capitais), 1980-2007
RESUMO
Objetivo: Prover dados sobre idade, gênero, tempo e variação espacial por meio de estatísticas de mortalidade por epilepsia no Brasil. Método: Foram usados dados demográficos e de mortalidade do Ministério de Saúde brasileiro, relativos ao Brasil (capitais) durante os anos 1980-2007. Para a descrição dos dados foi usado o Microsoft Office Excel 2007 planilha eletrônica; foi feita demonstração de tendências através de regressão linear, GraphPad Prisma 5.0. Resultados: Há uma tendência ao aumento da mortalidade em anciãos, e da mortalidade masculina em quase todas faixas etárias, embora taxas de frequência relativas por idade, 20-39 anos, sejam mais representativas. Taxas ajustadas de mortalidade/100.000, 2007, não demonstraram predominância regional. A mortalidade em domicílio é proporcionalmente predominante no adulto jovem, 20-29 anos. Conclusão: Nós podemos deduzir que várias mortes codificadas como epilepsia podem ser devidas a crises epilépticas sintomáticas agudas. Morte súbita inexplicada por epilepsia (SUDEP) pode ser mal diagnosticada e provavelmente mais representada no grupo com mais óbitos em casa.
Palavras-chave: epilepsia, mortalidade, certidões de óbito.
Correspondence
Marleide da Mota Gomes Instituto de Neurologia Universidade Federal do Rio de Janeiro (UFRJ) Programa de Epilepsia Av. Venceslau Braz 95
22290-140 Rio de Janeiro RJ - Brasil E-mail: [email protected]
Received 14 July 2010
Received in final form 27 September 2010
Accepted 4 October 2010 1Associate Professor, Faculty of Medicine, Federal University of Rio de Janeiro, Rio de Janeiro RJ, Brazil.
he risk of death for a person with ep-ilepsy is two to three times greater than that of the general population1,2. Regarding death certificate, traditionally, only the data on underlying cause-of-death (UCD) is considered in mortality analysis3. Data on UCD in epileptic patients is of lim-ited value for the diagnosis of epilepsy in the population due to its low case fatality
Arq Neuropsiquiatr 2011;69(2-A)
167 Epilepsy mortality: Brazil (1980-2007) Gomes
death1,3. In England, as Bell et al.5 reported, and also in Brazil, the diagnosis of epilepsy may be correctly absent from the death certiicate, because the information re-quired is that of conditions leading to death, and of other conditions contributing to death. he same authors em-phasized that if the patients had ongoing seizures before death, they may be more likely than others people with epilepsy to have epilepsy on the certificate. Schraeder et al.2 report that sudden unexplained death in epilepsy (SUDEP) appears to be an underused final diagnosis. It is a valid entity greatest among pathologists (83.5%) versus other physicians and non-physicians (P<0.001). In Sweden, Jansson and Ahmed3 reported that the most common UCD in epileptics was diseases of the circula-tory system (34.4%) followed by epilepsy (31.7%). Injury and poisoning were coded as UCDs for 5.8% of these pa-tients. Injury and poisoning as a contributory cause-of-death increased signiicantly, but not as an UCD during the study period. he proportion of each diagnostic group as an UCD decreased by 35% for epilepsy and 18% for in-jury from 1981 and onwards. he authors remember that these changes should be interpreted with caution since changes of coding practice are more likely to be the cause of them. he aim of the present study was to analyze the longitudinal trend and distribution according to gender and age strata in the National mortality data, 1980-2007, among the population having epilepsy as UCD.
METHOD
he data used was from the Mortality Information System (MIS)/Ministry of Health, over the calendar years
1980-2007, based on the Brazilian List for Mortalidade, 9th revision of the International Classification of Dis-ease (Br-ICD-9), 1980-1995, and Br-ICD-10, 1996-2007. he Br-ICD takes in account the causes of more impor-tant deaths in Brazil, including all the minimum item demanded by the international standards of compara-bility6,7. MIS classiies deaths as an UCD. he population estimates, from census as between them used as denom-inators for the calculations of the mortality taxes were obtained through Datasus and supplied by the Brazilian Institute of Geography and Statistics. Using these data, regarding epilepsy death, they were analyzed: [1] crude death rates by quadriennium according to age group (cal-culated using the deaths means due to epilepsy divided by the population means per age group in each quadren-nium), and relative frequency rates by age; [2] standard-ization mortality ratio by age group through the direct method, using the Rio de Janeiro capital as standard pop-ulation, in 2007 (the equation used was: Σ (rate by age group) × (standard population by age group) / Σ stan-dard population); [3] trends for death rate by sex, from 1980-2007, by means of linear regression; [4] death pro-portional variation in Brazil (capitals) per sex and total in the 1980 and 2007 years, ((Rate 2007/Rate 1980)–1) 100); [5] the deceased’s local of death, in the 2004-2007 period. For the description of the data it was used Micro-soft Oice Excel 2007 spreadsheet, and iguring of trends by linear regression, GraphPad Prism 5.0. he research project uses secondary and grouped data, which do not have information through which the individuals can be identiied. It was submitted to the Committee of Ethics
Table. Brazil (capitals), mortality (absolute numbers, relative frequency rates by age and death rates/100,000) from epilepsy, by time period (1980-2007).
Age
1980-1983 1984-1987 1988-1991 1992-1995 1996-1999 2000-2003 2004-2007
N % 100,000 N % 100,000 N % 100,000 N % 100,000 N % 100,000 N % 100,000 N % 100,000
<1 14 4.96 – 10 3.52 – 7 2.19 – 5 1.67 – 5 1.66 0.75 6 2.11 0.83 5 1.42 0.64 1-4 18 6.32 – 17 5.75 – 10 3.37 – 8 2.75 – 11 3.65 0.42 12 4.05 0.40 12 3.51 0.39 5-9 9 3.34 0.30 9 2.92 0.26 10 3.37 0.28 7 2.25 0.18 6 1.99 0.17 6 2.20 0.18 6 1.87 0.17 10-14 12 4.42 0.41 10 3.52 0.31 18 5.98 0.50 11 3.59 0.28 7 2.40 0.19 5 1.85 0.14 9 2.77 0.24 15-19 24 8.57 0.74 30 10.21 0.89 20 6.74 0.58 20 6.67 0.55 20 6.47 0.49 15 5.10 0.34 17 5.08 0.39 20-29 59 21.21 0.98 56 19.21 0.88 59 19.97 0.88 60 20.02 0.85 57 18.91 0.80 48 16.80 0.61 45 13.45 0.54 30-39 55 19.95 1.37 58 19.90 1.24 68 22.75 1.27 71 23.52 1.23 72 23.80 1.17 53 18.73 0.81 61 18.09 0.86 40-49 39 13.90 1.36 41 14.15 1.30 47 15.75 1.33 48 15.93 1.26 50 16.67 1.14 56 19.61 1.10 64 19.06 1.16 50-59 21 7.40 1.03 26 9.01 1.22 26 8.76 1.12 27 8.92 1.08 31 10.12 1.14 32 11.26 1.01 39 11.66 1.11 60-69 14 5.14 1.24 19 6.43 1.39 15 5.14 0.99 20 6.67 1.20 19 6.38 1.08 20 6.86 0.98 24 7.17 1.12 70-79 8 2.98 1.52 11 3.69 1.70 9 3.12 1.29 14 4.59 1.76 13 4.31 1.44 17 5.89 1.49 28 8.37 2.29
≥80 3 1.17 1.93 3 1.03 1.41 6 2.02 2.34 8 2.75 2.89 9 2.82 2.45 15 5.36 3.45 24 7.17 4.78
Ign 2 0.63 – 2 0.69 – 3 0.84 – 2 0.67 – 3 – – 1 – – 1 – –
Total 277 100 0.94 292 100 0.91 297 100 0.86 300 100 0.82 302 100 0.79 284 100 0.69 335 100 0.76
Arq Neuropsiquiatr 2011;69(2-A)
168
Epilepsy mortality: Brazil (1980-2007) Gomes
in Research involving Human Subjects of the Instituto de Neurologia da UFRJ, and it was approved.
RESULTS
Table shows the death and relative frequency rates for epilepsy, in Brazilian capitals, in the period from 1980 to 2007, by quadriennium. he most expressive speciic death rates were observed ≥70 years, and the relative fre-quency rates were observed in the 20-49 age strata. As a whole, the male rates, are higher than the female ones.
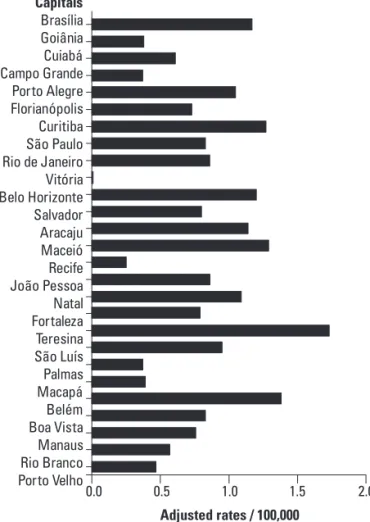
Regarding only one year of analysis (2007), some cap-itals presented higher standardized mortality ratios, not characterizing a regional higher level of mortality (Tere-sina city, in the northwest, with the highest) (Fig 1).
The results concerning the behavior of the crude mortality ratios and the analysis of the temporal trend of the mortality due to epilepsy in the Brazilian capi-tals in the period from 1980 to 2007 are shown in the Fig 2: decreased trend, although increased in the last studied years.
In relation to the place of death, the young adult and the very young / very old have the extremes of the relative frequency rates: 20-29, 47.52%, at home; ≥80, 63.47%, 1-4, 74.09%, at the hospitals.
DISCUSSION
Our results showed that the epilepsy rate in Brazil (capitals) decreased, and that there is a more prominent rates among the elders and men. Risk factors for death for epilepsy seem to difer by age and gender. Our study
Capitais Brasília Goiânia Cuiabá Campo Grande Porto Alegre Florianópolis Curitiba São Paulo Rio de Janeiro Vitória Belo Horizonte Salvador Aracaju Maceió Recife João Pessoa Natal Fortaleza Teresina São Luís Palmas Macapá Belém Boa Vista Manaus Rio Branco Porto Velho
0.0 0.5 1.0
Adjusted rates / 100,000
1.5 2.0
Fig 1. Adjusted mortality rates / 100,000, from epilepsy, Brazil (capitals), 2007
Year Male Female Total
1980 1981 1982 1983 1984 1985 1986 1987 1988 1989 1990 1991 1992 1993 1994 1995 1996 1997 1998 1999 2000 2001 2002 2003 2004 2005 2006 2007 1.33 1.05 1.17 1.01 1.11 1.01 1.26 1.25 1.20 1.21 1.10 1.09 1.14 1.09 1.04 1.16 1.15 1.18 1.00 1.04 0.97 0.93 0.98 0.80 1.04 0.97 1.00 0.99 0.79 0.64 0.82 0.78 0.72 0.55 0.68 0.79 0.65 0.58 0.53 0.65 0.60 0.52 0.57 0.51 0.56 0.53 0.52 0.48 0.52 0.53 0.44 0.42 0.50 0.53 0.56 0.60 1.05 0.83 0.99 0.89 0.90 0.77 0.96 1.01 0.91 0.88 0.80 0.86 0.86 0.79 0.80 0.83 0.84 0.84 0.75 0.75 0.74 0.72 0.70 0.60 0.76 0.74 0.77 0.78 % variation
(1980 × 2007) –25.56 –24.06 –25.71
Fig 2. Mortality trend from epilepsy, Brazil (capitals), by sex and total (also at left), 1980-2007.
1.2
1.0
0.8
0.6
Rate / 100,000
Year
Slope –0.009332±0.001535
r2 0.5870
P value < 0.0001
Arq Neuropsiquiatr 2011;69(2-A)
169 Epilepsy mortality: Brazil (1980-2007) Gomes
showed a pattern in gender and age-speciic death rates from epilepsy similar of that from the Ferreira e Silva7 study, and coincident with several mentioned by Hit-iris e al.1: more in men and aged, the last more prone to acute symptomatic seizures. Although, Hesdorfer et al.8 argue against the inclusion of acute symptomatic sei-zures as epilepsy, because acute symptomatic seisei-zures have a higher early mortality and a lower risk for sub-sequent unprovoked seizure. he level of epilepsy death rate might be signiicantly afected by the undetermined death in epileptics. here are some limitations to the in-terpretation of the death data, because of the “epilepsy definition” and “misclassification error”. We will now explore the possible reasons underlying the recent in-creasing trends of the rates such as change of coding and for instance preterition of the pneumonias as UCD: epi-lepsy prevailing in the CID-10, in detriment of pneumo-nias9. Other causes may be a better epilepsy recognition and diagnosis in the last years, and the evolution in the covering of the MIS7. Schraeder et al.2 recommend that there is a need to educate oicials at all levels about the diagnosis of SUDEP in persons who have epilepsy with no other cause of death. SUDEP may be misdiagnosed and probably more represented at the group with more deaths at home: young adults.
There are problems associated with collection of mortality data, and the record of death related and un-related to epilepsy in mortality statistics / death certif-icates. Although, regarding the scarcity on population-based studies of epilepsy mortality in Brazil, analysis of the age, gender, temporal trend and geographical
varia-tion by means of mortality statistics is a key issue in de-scriptive epidemiology and may provide useful sugges-tions for planning further studies. he development of the premature death for epilepsy prevention strategies and assessment of the correct fulillment of the death certiicate should be considered to clearly diferentiate acute symptomatic seizures, in the underlying or con-tributing cause-of-death, from epilepsy with no other cause of death (SUDEP).
ACKNOWLEDGMENT – I gratefully acknowledge Dr. Marcílio Gomes Jr. and Dr. Marcus Oliveira for their valuable help on the softwares application.
REFERENCES
1. Hitiris N, Mohanraj R, Norrie J, Brodie MJ. Mortality in epilepsy. Epilepsy Behav 2007;10:363-376.
2. Schraeder PL, Delin K, McClelland RL, So EL. Coroner and medical exam-iner documentation of sudden unexplained deaths in epilepsy. Epilepsy Res 2006;68:137-143.
3. Jansson B, Ahmed N. Epilepsy and injury mortality in Sweden- the impor-tance of changes in coding practice. Seizure 2002;11:361-370.
4. Gomes MM. Mortalidade relacionada à epilepsia: diferenças demográicas - Brasil, 1979-1987. Rev Bras Neurol 1993;29:11-14.
5. Bell GS, Gaitatzis A, Johnson AL, Sander JW. Predictive value of death certification in the case ascertainment of epilepsy. J Neurol Neurosurg Psychiatry 2004;75:1756-1758.
6. INCA. Notas Técnicas. In: Atlas de Mortalidade por Câncer. URL http:// mortalidade.inca.gov.br/arquivos/notatecnica.pdf.
7. Ferreira Ide L, Tabosa e Silva TP. Mortality from epilepsy in Brazil, 1980-2003. Cien Saude Colet 2009;14:89-94.
8. Hesdorfer DC, Benn EK, Cascino GD, Hauser WA. Is a irst acute symptom-atic seizure epilepsy? Mortality and risk for recurrent seizure. Epilepsia 2009; 50:1102-1108.