AN EXAMINATION OF FOOD DISTRIBUTION AND SPECIALISED
RETAIL SALES IN PORTUGAL
Filipe Serio
ESTGA - Águeda School of Technology and Management, University of Aveiro, Portugal
filipe.serio@gmail.com
Marco Costa
ESTGA - Águeda School of Technology and Management,
CIDMA - Center for Research & Development in Mathematics and Applications, University of Aveiro, Portugal
marco@ua.pt
Humberto Ribeiro
ESTGA - Águeda School of Technology and Management
GOVCOPP - Research Unit on Governance, Competitiveness and Public Policies, University of Aveiro, Portugal
hnr@ua.pt
ABSTRACT
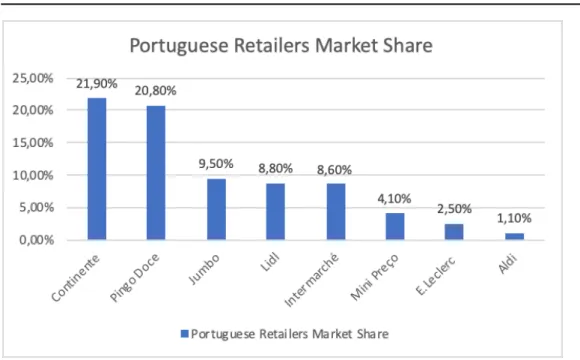
The food retail sector in Portugal is mostly concentrated in five main players holding 69.6% of its market share, with two groups leading the Portuguese preference, Continente with 21.9% market share, Pingo Doce with 20.8% market share, followed by Jumbo, Lidl and Intermarché with 9.5%, 8.8% and 8.6%, respectively. These operators up to the year 2012 have guided their performance and price strategy by applying the strategy Every-day-Low-Price that privileges the application of low and stable prices. In this paper we aim to characterize the food retail market in Portugal after the year 2012, identifying the main factors and contextualizing the economic climate. This analysis takes into account that most retailers opted to follow a strategy of high low pricing, which determined that 47% of sales of the year 2018 correspond to promotional sales; in this way, we will devote the analysis of the promotion and the impacts that it has for forecasting sales and supply chain management. Thus, to evaluate the influence of promotions on global sales, we will use weekly data referring to sales in the hypermarkets & "Superstores" channel that includes hypermarkets> 2,500 m2; Supermarkets 400-2,500 m2; Proximity <400 m2, in the period between the first week of 2012 and the last week of 2018, and also data on the number of promotions printed on promotional leaflets on the same the period in question. Applying multiple linear regression models and a previous exploratory analysis of the data we can conclude that the promotions carried out via leaflets actions have a weak capacity to explain the sales obtained in the Hypermarkets & Superstores channel and that are explained in large scale by other variables and the impact of these variables should be object of study in future works.
Keywords: Portuguese retail market, Promotion, Retail, Retail pricing strategy
1. INTRODUCTION
The 2007 subprime crisis that began with the bankruptcy of the American bank Lehman Brothers had worldwide repercussions felt in several countries. In the Portuguese case the pressure exerted on the financial conditions of the country, led to an escalation of the interest rates with which Portugal was financed in the international markets. This process culminated in the international request for financial aid on 7 April 2011, since then and during the following 3 years Portugal was conditioned in its governance by the memorandum signed with the Troika.
The economic and financial adjustment that country was made through the instantaneous interruption of public investment, the reduction of public expenditure, particularly the cut of wages and social benefits, and also by the implementation of measures on the revenue side, such as the increase of taxation on labor and consumption (Rodrigues & Silva, 2015). As we can see in Figure 1, between 2011 and 2014, the constant prices GDP contracted significantly reaching is low in 2013, whit a decrease of 6.85% in relation to 2010.
Figure 7: Gross Domestic Product Constant Prices (Pordata, 2019)
Private consumption was also significantly affected during the years of the adjustment program, as can be seen in Figure 2 during the program period, private consumption reached is minimum in 2013 which corresponds to a decline of 6.1% compared to 2010.
As is shown in Figure 3, during the economic adjustment program, the consumer confidence index reached its minimum in 2012, whit the indicator decreasing 52% compared to the year of 2010.
Figure 3: Consumer Confidence Indicator (INE, 2019)
Thus, taking into account the national context, there were several changes in the consumer profile, who began to plan and organize the purchase acts in a more rational way, buying less quantity and increasing the frequency of visits to stores. This "new" consumer who emerges in the midst of the crisis, is characterized by the constant demand for promotions, discounts and lower prices, is concerned with acquiring private label or first price products, this consumer is also characterized by being unreliable in relation with the point of sale (Beir o, 2001). Retailers have also did adjusts to deal with the changes in consumer habits, highlighting mainly the shift in their strategy. Up to 2012, retailers set their performance and price strategy by applying the Everyday Low-Price model, which is defined by a low and stable price (Pechtl, 2004). However, from 2012 most of the players have chosen to implement a High Low Pricing strategy, which is characterized by promoting temporary price variations with the propose to attract customers (Pechtl, 2004) . The prices advocated in a strategy everyday low price are characterized by being lower than the prices, out of the promotional moment, of the High Low Pricing strategy, however in the case of products in promotion, the high low pricing strategy presents a more competitive price than the everyday low price strategy. (Hoch, et al, 1994; and Lal & Rao, 1997).
2. THE PORTUGUESE FOOD RETAIL MARKET
The food retail sector in Portugal is mostly concentrated in five main players holding 69.6% of its market share, with two groups leading the Portuguese preference, Continente with 21.9% market share, Pingo Doce with 20.8% market share, followed by Jumbo, Lidl and Intermarché with 9.5%, 8.8% and 8.6%, respectively.
Figure 4: Portuguese Retailers Market Share, (CMVM, 2018)
It is therefore possible to affirm that the focus of retailers is on promotions, these are characterized as short-term actions that aim to influence and stimulate the product acquisition process, the power of this variable is based on its ability to create an extra motive for impulse buying, experimentation of new / other products or even promote the stock disposal (Honea & Dahl, 2005). Thus, since 2012 we have witnessed a great increase in the number of promotions via leaflet, according to (Huang et al, 2014) it is in promotions that retailers spend a large part of their budget. Promotional leaflets are the main tool to retailers impulse promotions, they are used to promote new products, store openings and special price communication (Miranda & Kónya, 2007). According to Figure 5, the number of promotional inserts has increase by 439.9% between 2012 and 2018, indicating that to meet new consumer demands, retailers have made the promotional sales their principal focus.
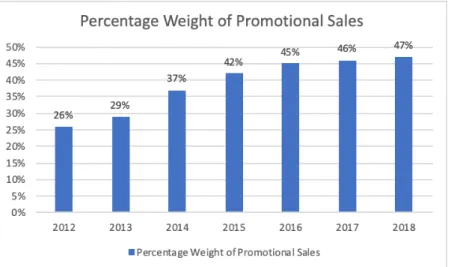
Taking into account the information presented above, the weight of domestic market promotional increased by 80.8% between 2012 and 2018, from 26% to 47%, as can be seen from the information in Figure 6.
Figure 6: Percentage Weight of Promotional Sales, (Nielsen, 2019)
The values presented, in Figure 6, show that almost 50% of retail sales are promotional sales promotion, which proves the preponderances they have in competitive retail dynamics. However, although promotional campaigns cause short-term sales to increase, they also increase consumers' price sensitivity and lower reference prices that consumers attribute to products (Gedenk et al, 2006). Thus, taking into account the weight of promotions, these should be planned and analyzed in detail, giving to managers the freedom to define the best strategy. they should promote well-designed campaigns with the capacity to predict the competitors’ actions and responses (Ma & Fildes, 2017).
3. THE IMPACT OF LEAFLETS INSERTIONS ON SALES
To evaluate the impact that leaflets promotional actions have on sales, we will use a simple linear regression model, where the variable explained are global sales and the explanatory variable are the leaflets inserts. The data of the explained variable corresponds to the global sales of the channel Hypermarkets & "Superstores" that includes hypermarkets> 2,500 m2; Supermarkets 400-2,500 m2; Proximity <400 m2. These amount included the sales of the groups, Auchan, Continente, Dia / Minipreço, El Corte Inglés, E.Leclerc, Mosqueteiros and Pingo Doce, in the period from the first week of 2012 to the last week of the year 2018. In the case of the explanatory variable number of leaflet insertions, this number represents the number of promotional photographs presented in the described above insignia leaflets, during the weeks in question, for the accounting of this variable it was assumed that a highlight of the brand is the same number if inserts that an individual highlight of a product.
In Figure 7, despite including several articles the Quaker brand is counted as one promotional insert just like the Fitness cereals were considered as one promotional insert. Although there are leaflets who crosses more than one-week duration, for this study we considered the starting date of the leaflet was to be the date of the leaflet. Thus, by applying a simple linear regression using the number of weeks as explanatory variable and the global sales as explained variable, we obtain a line of equation Y = 0.1167X + 186.34 (Figure 8), who have associated with this regression a coefficient of determination of 0.2591 which means that the variable number of weeks can explain 25.91% of the total variation of the global sales variable.
Figure 8: Portuguese Retail Sales, (Nielsen, 2019)
Applying a simple linear regression using the number of inserts in leaflet as explanatory variable and the global sales as explained variable, we obtain a line of equation Y = 0.0116X + 188.29 (Figure 9), who have associated to the regression a coefficient of determination of 0.1551 which means that the leaflet inserts variable can explain 15.51% of the total variation in the global sales variable.
Figure 9: Portuguese retail sales/Promotional insertions in leaflets (Nielsen & Action Focus 2019)
4. CONCLUSIONS
Portugal went through a severe period of economic adjustment, which has significantly affected the purchasing power of most of the people, from the restrictions stemming through this program has emerged new consumption habits and a high sensitivity to price by the consumer.
This sensitivity made the act of consumption become much more pondered and scrutinized, leading the consumer to make several comparisons between the various retailers before making the purchase. The Portuguese food distribution chains, in order to fit with the changes in the consumer preferences have adapted their strategies of price, moving from an everyday low prices to continuously focusing on promotional mechanics. The most visible part of this promotional mechanic is the leaflets, these have significantly evolved in quantity during the analyzed period. This new work model has resulted in an increase in promotional sales, having reached 47% of total sales in 2018, although its growth rate has declined in the last 3 years. As such, it would be expected that leaflet promotional insertions would be able to explain much of the global sales, however as we have seen through the simple linear regression method this is not true and the insertions can only explain 15.51% of the total variation in global sales. Taking into account the above, it would be pertinent in future work to test other variables and methods in order to formulate a better fit model to explain Portuguese global retail.
LITERATURE:
1. Action Focus (2019), Promotional Leaflet Insertions, Physical Data.
2. Beir o, A. F. (2001). O Impacto das promoções de vendas no valor da marca. Master thesis, Universidade Católica Portuguesa.
3. CMVM (2018). Portuguese Securities Market Commission, Portuguese Retail Market Share, https://web3.cmvm.pt/sdi/emitentes/docs/FR69840.pdf, October 2018.
4. Continente (2019). Leaflet insertion example, Sabe bem pagar tão pouco 2 a 8 julho, http://folhetos.continente.pt/2019/6/semanal-s27-ts11/?page=12, July 2019.
5. Gedenk, K., Neslin, A. S.; Ailawadi, K. L. (2006), Sales Promotion, Retailing in the 21st
Century-Current and Future Trends, 1st edition, , pp. 341–359, Germany: Springer–Verlag. 6. Hoch, S.; Drèze, X.; Purk, M. (1994). EDLP, Hi-Lo, and Margin Arithmetic. Journal of
Marketing. 58 (10), 16-27.
7. Honea, H.; Dahl, D. (2005). The promotion affect sale: defining the affective dimensions of promotion. Journal of Business Research 58(4), 543-551.
8. Huang, T., Fildes, R.; Soopramanien, D. (2014), The value of competitive information in forecasting FMCG retail product sales and the variable selection problem, European
Journal of Operational Research, Vol. 237, No2, pp. 738–748.
9. INE (2019), Statistics Portugal, Consumer Confidence Index, http://ine.pt, June 2019. 10. Lal, R.; Rao, R. (1997). Supermarket competition: the case of everyday low pricing,
Marketing Science 16(1), pages iii-vi.
11. Ma, S.; Fildes, R. (2017), A retail store SKU promotions optimization model for category multi-period profit maximization, European Journal of Operational Research, Vol. 260, No2, pp. 680–692.
12. Miranda, M.; Kónya, L. (2007). Directing store flyers to the appropriate audience, Journal
of Retailing and Consumer Services, 4(3), 175-181.
13. Nielsen (2019). Nielsen market Track hiper + super universe,
https://www.nielsen.com/pt/pt/insights/article/2019/large-consumer-goods-grow-in-2018, February 2019.
14. Pechtl, H. (2004). Profiling intrinsic deal proneness for HILO and EDLP price promotion strategies, Journal of Retailing and Consumer Services 11(4), 223-233.
15. PorData (2019), Francisco Manuel dos Santos Fundation, GDP & Private Consumption Data, https://www.pordata.pt, June 2019.
16. Rodrigues, M.; Silva, P. A. (2015). Governar com a Troika: Políticas Públicas em Tempo