FI SEV1F.R
Residence Time Distribution of Liquids in a Continuous
Ykbular Thermal Processing System
Part I: Relating RTD to Processing Conditions
A. Pinheiro Torres”, F. A. R. Oliveira”” & S. P. Fortuna”
“Escola Superior de Biotccnologia, R. Dr. Ant6nio Bernadino de Almeida.P-4200 Porte. Portugal
“lnstituto Inter-UnivcrsitSrio de Macau, Pal&k da Penha, Macau (Received 16 June 1907: accepted 15 December lYY7)
ARSTRA CT
A systcmutic experimental study on residence time distribution (RTD) in tubular ,jlo~’ W(IS pcformcd, covering N wide range
of
processing conditions. The ,flow oj‘ wuter in I:arious sections of a tubular continuous thermal processing system was analysed using the classicul Danckwerts upproach. Methylene blue was used as trrrcer and dij$erent constant temperatures (2WIO”C) and jt’ow rates (80-380 li h) were tested. These conditions yielded meun residence times up to 6 min and Reynolds numbers between 1350 cmd 9700. Various models were jitted to the experimental data, and the dispersion model showed to yield the best jit. Peak nnulysis led to both accurate and precise as well as consewative parameters, when compared to other methods of parumeter estimution. Results revealed thnt ,jh{id dispersion in tubular flow (Peclet number) can be related to processingconditions (Reynolds number) by u power law model. Results were compared to published correlations. 0 1998 Elsevier Science Limited. All rights resen,ed
NOTATION 1 Concentration (in the time domain) CST Continuous stirred tank
d Diameter (m)
D Axial dispersion coefficient (m’is)
‘?Author to whom all correspondence should he addressed. 147
148 A. Pinheiro Torres et al. 9 Da DPF E H k L LF N-CST Pe Pe,
Q
R2 Re RTD SC SSR fTF V V apY?i P 7 /l Diffusion coefficient (m2/s) Damkiihler number (Da = kr) Dispersed plug flowResidence time distribution (s- ‘) Heavyside function
Reaction rate constant (min-‘) Length (m)
Laminar flow
N continuous stirred tanks in series Peclet number (Pe = vL/D)
Axial Peclet number (Pe = v&D) Flow rate (l/h)
Regression coefficient of determination Reynolds number (Re = pvdlp) Residence time distribution Schmidt number (SC = p/pD) Sum of squares of residuals Time (s) Turbulent flow Velocity (m/s) Volume (1) Parameters Density (kg/m3) Mean holding time (s) Viscosity (poise) Subscripts e i max pred Output, exit Input Maximum Predicted INTRODUCTION
Aseptic processing is widely applied to pasteurise and sterilise fluid foods (e.g. milk, fruit juices and concentrates, cream, yoghurt, wine, salad dressing, egg and ice cream) and foods containing small discrete particles (e.g. cottage cheese, baby foods, tomato products, soups and rice desserts). Currently major research efforts are being developed in the field of continuous thermal processing of liquid foods containing large particles (Lee et al., 1995; Baptista et al., 1995, 1997). The main advantage of continuous thermal processes versus in-container pasteurisation or sterilisation is the quality improvement of the product due to higher heating and cooling rates (Hersom, 1985). Unfortunately, as previously noted by Lin (1979), the
Relating RTD to processirlg conditiots - I 149
full potential of continuous thermal processes is yet to be attained due to difficulties in describing accurately the flow characteristics in processing equipment.
The degree of thermal processing of an aseptically processed food product depends not only on the temperature the product is subjected to, but also on the residence time of the product in the processing unit. The knowledge of the resi- dence time distribution (RTD) in the system is therefore essential for an accurate estimation of the degree of processing. Aseptic processes may therefore be opti- mised (maximising product quality and avoiding overprocessing, while ensuring product safety) by choosing the adequate time/temperature and flow conditions, so that important side deteriorative reactions related to product quality, as well as dispersion, can be minimised (Burton, 1958; Rao & Loncin, 19746; Lund, 1977: Holdsworth & Richardson, 1986; Kessler, 1989; Maesmans et al., 1990).
Experimental RTD determination in aseptic processing, particularly in holding tubes or test rigs, have been reviewed in literature (Rao & Loncin, 1974~; Lin, 1979; Burton, 1988; Holdsworth, 1992; Pinheiro Torres & Oliveira, 1998). Water is the fluid most widely used in these studies, and salt the most common tracer. Model food products such as sucrose and guar gum were used by Sancho and Rao (1992) polyethylene glycol by Milton and Zahradnik (1973) and glycerol-water mixtures by Trommelen and Beek (1971). RTD studies on real products were performed on milk by Cerf and Hermier (1973), Nassauer and Kessler (1979), Heppell (1985) and Janssen (1994). No studies were found considering non-isothermal conditions, and most of the reported studies were conducted at room temperature.
Mathematical models for fluid flow in tubular systems (such as holding tubes) at isothermal conditions were presented by Levenspiel and Bischoff (1963) Levenspiel (1972), Rao and Loncin (1974a) and Wen and Fan (1975). These models are often based on the classical RTD Danckwerts’ approach (Danckwerts, 1953). Ideal RTD models like plug flow (PF) and continuous stirred tank (CST) rarely reflect a real situation close enough. Non-ideal models are therefore applied, accounting for the deviation in real systems. These models vary in complexity, but one parameter models are often adequate enough to represent tubular vessels (Levenspiel & Bis- chaff, 1963). The model for the axial dispersed plug flow (DPF), or simply the dispersion model, has been widely applied by chemical engineers to describe the flow in tubes, and is the most frequently selected to simulate flow in holding tubes in aseptic processing (Aiba & Sonoyama, 1965; Nassauer & Kessler, 1979; Wenner- berg, 1986; Sancho & Rao, 1992). The N-CST model has also been applied to describe flow in tubes (Levenspiel & Bischoff, 1963; Wen & Fan, 1975) and to aseptic processes (Roig et al., 1976; Wennerberg, 1986; Malcata, 1991; Sancho & Rao, 1992). Further models proposed for describing the experimental results were the velocity distribution model (Aiba & Sonoyama, 1965; Nassauer & Kessler, 1979) and the N-CST model with a PF in series (Veerkamp et al., 1974).
Quantitative analysis of the effect of process parameters in the RTD of holding tubes was not addressed in most studies. Sancho and Rao (1992) reported that RTD, expressed in terms of a dispersion coefficient, was higher for laminar than for turbulent flow, independently of the nature of the liquid.
The purpose of this work was: (1) to model fluid flow in a tubular continuous processing system by application of the RTD Danckwerts analysis, (2) to assess the influence of processing conditions (temperature, flow rate and tube length) on the model parameters and (3) to develop dimensionless correlations that might be used to estimate RTD for different processing conditions.
150 A. Pinheiro Torres et al.
heat
steam out
IEt. El ECTROMAGN. FI.OWMETER
@ PROGRAM CONTROLLER
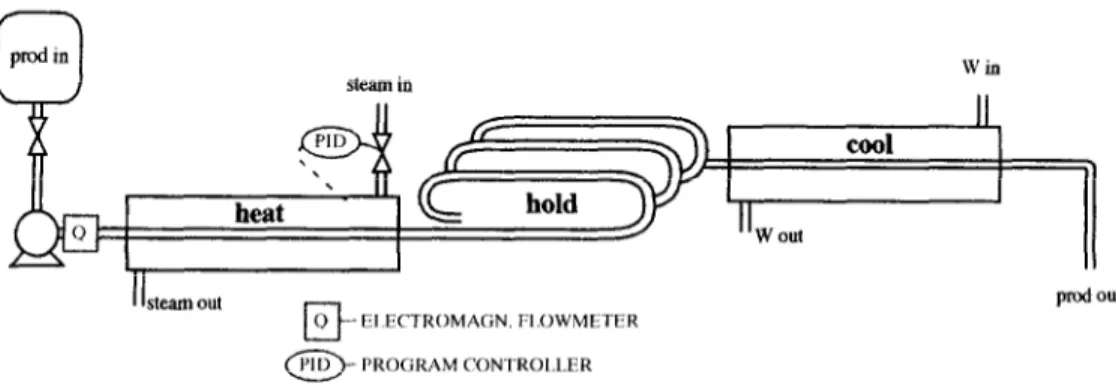
Fig. 1. Schematic representation of the thermal processing unit.
prod out
MATERIALS AND METHODS
The continuous thermal processing system
Residence time experiments were conducted in a continuous thermal processing pilot plant (Pinheiro Torres & Oliveira, 1993). This system (Fig. 1) includes: feed tanks, a positive displacement pump (Eco Gearcham G4, Pulsafeeder), concentric double tube heat exchangers for heating and cooling the product, and a holding tube with variable length and the required upward inclination of 1 in/ft (all tubular sections with 2.2 cm ID). This system was, however, always operated at constant temperature in the different sections. Water was run at various temperatures (2580°C) and flow rates (80-380 l/h) giving Reynolds numbers (Re) from 1350 to 9700, thus covering a range of laminar, transient and turbulent fluid flow. This system was coupled to a tracer injection system and an on-line tracer detection system, consisting of a continuous sampler connected to a spectrophotometer with a data acquisition system specially developed for this purpose.
Experimental method
Residence time experiments were conducted using methylene blue as tracer. A pulse of tracer was injected into the flow through a syringe, which was mounted on an independent piece of tubing added in the desired injection point. Preliminary experiments showed that best input signals could be achieved with 5 ml samples. A net (mesh size 0.8 mm) was inserted in the cross section of the tube, immediately after injection, in order to break the velocity profile and improve tracer distribution. The ideality of the injection was checked by measuring the response shortly after injection. Continuous on-line sampling was made at the outlet of the section under analysis, and absorbance recorded every second by a spectrophotometer (Spectronic 6820), at wavelength of 663 nm, connected to a PC (Bull Micra1 through an RS232 port). This continuous sampling device was found to give results equivalent to cup sampling. Tracer concentration was selected for each flow rate to give an output signal of a maximum of 1.0 in absorbance, thus guaranteeing that absorbance would fall in the range where the Lambert-Beer’s law is valid.
Reluting RTD to processitzg cmditions - I 151
Om 2.44 m 26.05 m 30.28=kl
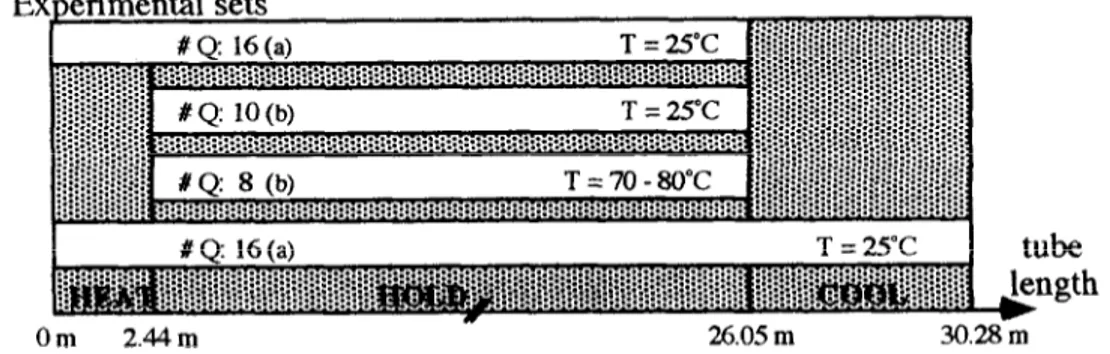
Fig. 2. Experimental conditions tested (number of flow rates tested in the range of (a) 80-380 l/h. and (b) 100-250 l/h).
Overall, 50 experiments were performed, covering different combintions of tem- perature and flow rate (Fig. 2). For each set of processing conditions, two replicates were conducted,
Raw data treatment
RTD curves were standardised as follows:
Mean holding times were calculated as the ratio sponding test section (v) and the flow rate (Q):
V T= -
e
(1)
between the volume of the corre-(2)
Mean residence times were also estimated by statistical analysis of the RTD curves. Experimental results where the mean holding time T differed significantly from the mean residence time obtained from the RTD curve (above 10%) were rejected, as this indicated that a channelling in the fluid circuit has occurred. Re was calculated for each set of processing conditions.
RESULTS AND DISCUSSION
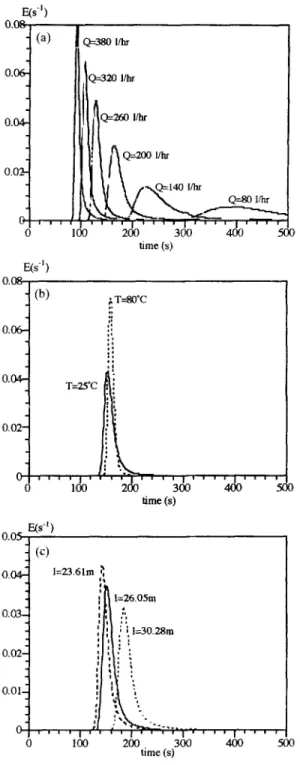
Figure 3 shows selected curves, that allow us to analyse the effect of flow rate !Fig. Ja), temperature (Fig. 3b) and tube length (Fig. k) on RTD. As would be expected, dispersion and tailing effects increase as flow rate and/or temperature decrease (lower Re). When comparing different test sections at ambient temperature (Fig. 3c), it can be concluded that dispersion increases with tube length.
152 A. Pinheiro Ton-es et al. o, W’) (4
1
Q380 Ih II time(s) time (s) time(s)Fig. 3. Effect of operating conditions on typical RTD curves: (a) effect of flow rate, (b) effect of temperature and (c) effect of tube length.
Relating RTD to processing conditiorxs - I 15.3
TABLE 1
Models Tested for Describing RTD Curves with Tailing Effects
Type qf model Model details
Classical RTD models applied to tubular systems Classical RTD models predicting long tails
la. DPF lb. N-CST
2a. DPF with stagnant zone
Other/new models
2b. N-CST with stagnant zone - model G (Levenspiel, 1972)
3a. DPF with outer annulus in laminar flow 3b. DPF in paralle with LF
3c. DPF in parallel with TF
3d. DPF in parallel with PF followed by a 2nd DPF DPF in parallel with PF followed by 2 parallel CSTs
Modelling of the RTD curve
Tailing effects are common in published results and may be due to improper injection (Milton & Zahradnik, 1973) or indicate laminar, transient or low turbulent flow regimes. These effects are often difficult to include in theoretical models but, according to Levenspiel (1972), and with regard to conversion, the tail correction usually does not justify the extra modelling work. In a previous work (Pinheiro Torres et al., 1993) we have applied different flow models to account for this tailing (Table 1). Models were fitted to experimental data by non-linear regression and compared in terms of the sum of squares of the residuals (SSR) between experi- mental data and the model, for three typical experimental curves. The dispersed plug flow model (DPF) was found to yield the smallest SSR, although not predicting the tailing effect. Furthermore, it has the advantage of requiring the estimation of only one parameter, the Peclet number (Pe):
where Pe is a dimensionless measure of the axial dispersion, D:
pe= % (4)
Various techniques were proposed by different authors to estimate this parameter (Pinheiro Torres & Oliveira, 1998). These include (i) analysis of specific character- istics of the RTD curve (Levenspiel, 1972), such as peak time, peak height, inflection points and difference of residence times of the middle 68% portion of the RTD curve, (ii) statistical analysis (Levenspiel & Bischoff, 1963), (iii) curve fitting
154 A. Pinheiro Torres et al.
by non-linear optimisation (Fahim & Wakao, 1982; Rangaiah & Krishnaswamy, 1990) (iv) Laplace domain curve fitting (Hopkins et al., 1969) and (v) analysis of RTD curves obtained from non-ideal input functions in the Laplace domain (0ster- gaard & Michelsen, 1969).
Analysis of specific characteristics of the RTD curve (except for peak height) and statistical analysis were found to yield inconsistent and inaccurate results in our study. The remaining methods for parameter estimation were then compared, con- sidering both the precision of the parameter and its ability to predict accurately and conservatively the extension of a first order reaction in the system (non-linear optimisation and Laplace domain curve fitting could, however, only be tested when ideal injection was observed). The final or exit concentration of a quality factor, c,, for first order reactions under isothermal conditions, may be calculated as (Levens- pie1 & Bischoff, 1963):
c e
-- -
Ci
.r
%
e ~” x E(t)dt0
where ci is the initial or input concentration and k the reaction rate constant. For the DPF model, this yields (Wehner & Wilhelm, 1956):
I i
L =
f(Pe,Da) =4xePd2
ci (1 +tx)2ezpp’2 _ ( 1 _ a)2e _ rPr’2
(6)
with:
R = <1+4DalPe (7)
where the Damkohler number (Da = kz) is a dimensionless form of the reaction rate constant.
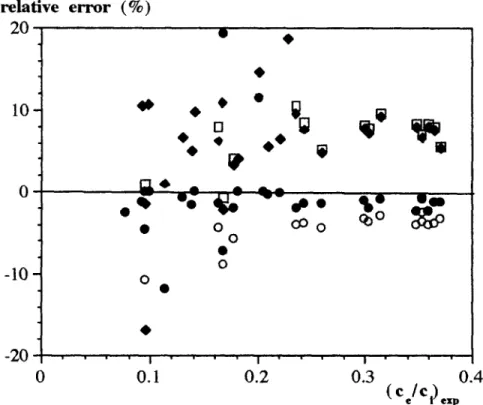
Accuracy was defined as the difference between the reaction extension estimated with eqn (5) and eqn (6). Conservativeness implies that this difference should be positive. A reference reaction rate of 0.01 s-’ was chosen so that a significant reaction (conversion from 0.6 to 0.9) would occur in the range of the processing conditions tested. Figure 4 shows that the different procedures tested led to accept- able results, with errors in general lower than 10%. Methods using the Laplace domain analysis yielded the most accurate results, though systematically non-con- servative. Both peak analysis and non-linear optimisation led to conservative predictions, except for Re below 3200. Peak analysis was chosen for further studies, as it was found to be more accurate than non-linear optimisation. Furthermore, this is also the simplest and fastest method for parameter estimation, and does not require an ideal injection.
Pe was therefore estimated from the maximum value of the E-curve (E,;,,) as follows:
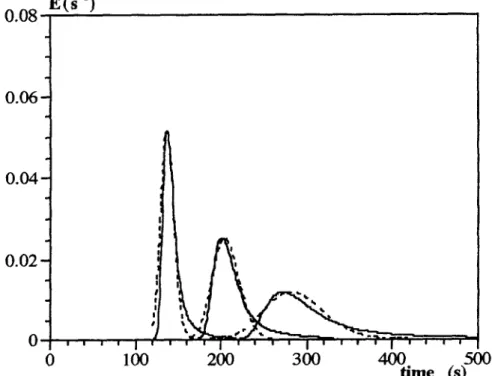
Figure 5 shows an example of the fit between the DPF model and the experimental data, both for small and large dispersions. It was found that good fits were obtained for turbulent flow.
Relating Peclet to operating conditions
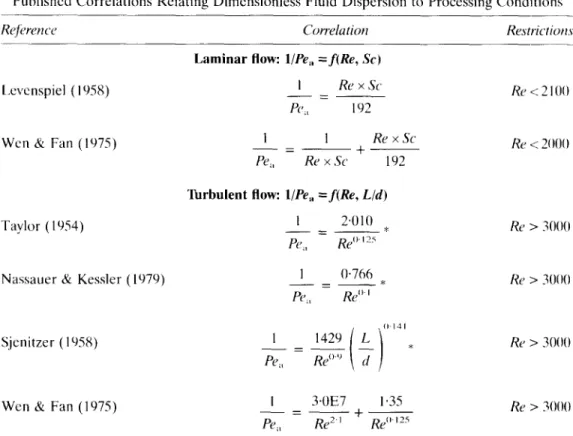
Several correlations relating axial diffusion (V) to Re were found in literature for tube flow of Newtonian fluids (Table 2). Correlations in laminar flow also include the Schmidt number (SC = /L/~O). All the correlations were developed in terms of the axial Peclet number (Pe,,):
It should be stressed that these correlations were developed for other engineering processes. For laminar flow, the models were based on fluid mechanics theory
relative error (%) 20 , 0 a+ * .* l . -
z*
v
.-
0 0 @O 0083%
0 a -10 - 0Oo
0 0.1 0.2 Oa3 ( fe/CJ.ip0.4Fig. 4. Effect of the method of parameter estimation on the accuracy of predictions of concentration decay for a first order reaction with rate constant of 0.01 s ‘, for Re > 3200: (+) peak analysis, (0) time domain curve fitting, (0) Laplace domain curve titting, assuming ideal injection of tracer, and (w) Laplace domain curve fitting, assuming nonideal injection of
1.56 A. Pinheiro Ton-es et al.
(Levenspiel, 1958; Levenspiel & Bischoff, 1963; Wen and Fan, 1975); predicted Pe,
values were compared to experimental data (Wen & Fan, 1975) showing relative errors from - 76% to 40%, for Re x SC ranging from 1 to 2000. For turbulent flow, the models of Taylor (1954) and Wen and Fan (1975) were also based on fluid mechanics theory, considering axial dispersion. The latter model includes an addi- tional term that accounts for axial diffusion (Aris, 1959). Further discussion on the theoretical basis of these models may be found in Levenspiel and Bischoff (1963). The remaining two models are empirical: Nassauer and Kessler’s model is identical to Taylor’s model, although with different values for the parameters; Sjenitzer’s model is similar to Taylor’s model, but includes the effect of the ratio between tube length and diameter. Using the concept of nested models, Sjenitzer’s can be seen as a full model, whereas Taylor and Nassauer and Kessler’s models are partial models. We have analysed the data used by Sjenitzer (1958) finding that the regression coefficient of determination was considerably low (R2 = 0.61).
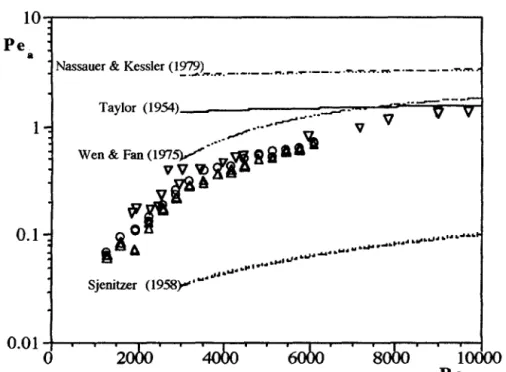
Experimental data reported in literature (Pe, vs Re) show a large scatter (Levens- pie1 & Bischoff, 1963; Levenspiel, 1958; Sjenitzer, 1958; Wen & Fan, 1975). Taylor’s model was found to be, in general, relatively adequate to describe these results (Levenspiel, 1958), but it was unable to describe an experimentally observed sharp increase in Pe, for Re < 10000 (Levenspiel & Bischoff, 1963).
Figure 6 shows how Pe, increases with Re, for all the experiments, conducted in our work. A coefficient of determination of 0.25 was found between the variables L
o o8
Us“)
.
0.06- 0.04- I 8 0.02 - 0 0 100 200 300 FL_, Lo\ 5 0Fig. 5. Typical experimental (full line) and predicted (dotted line) RTD curves at different flow rates for the holding section.
Reluting RTD to processing conditions - I 157
and Pe,, meaning that there is statistical evidence that L contributes 25% to the variability of Pe,, and should therefore be included in the model.
Predictions for laminar flow were analysed, considering a diffusion coefficient of ZI = 2.3 x 10~~” m2/s, estimated from a published correlation (Geankoplis, 1983). Estimated Pe,, values were however 2-4 orders of magnitude lower than our exgeri- mental results, probably because of the range of Re x SC tested (5.0 x lo- to 7.8 x 10’).
Figure 6 includes the curves predicted for turbulent flow (Table 2). It can be seen that the model of Wen and Fan (1975) best approaches our results, although clearly showing a biased pattern, overpredicting the Pe,, values. The other models show very poor predictions. We have then, for turbulent flow (Re > 3000), estimated the para- meters (CI and /I; M(, /j and 7; and cx, fl, 7 and 6, depending on the model - see Table 3) that would lead to the best fit of the models described in Table 2 to our data. We have also considered the case of 1’ = - 1 for simplification of Sjenitzer’s model, thus creating a partial model including the effect of L. This power model suggests a different interpretation of the relation between fluid dispersion and Re (axial disper-
TABLE 2
Published Correlations Relating Dimensionless Fluid Dispersion to Processing Conditions
Correlation Restrictiom
Laminar flow: l/Pe, =f(Re, SC)
Lxvcnspiel ( 19%) _=- I Re x SC Rc <: 2 IO0
PCJd 192
Wcn CG Fan (lY75) ---Z~_t 1 1 RexSc Re < 2000
Pe;, Re x SC 192
Taylor ( I YS4)
Nassauer & Kessler (lY79)
Sjenitzer ( 19%)
‘hrbulent flow: l/Pe, =f(Re, L/d) I 24llO -=-* ptJd Re”’ ’ Is 1 0.766 -_-* POT, Re” ’ I -= PC,, Re > 3000 Re > 3000 Rr > 3000
Wen & Fan (1975) -= I 3OE7 1.35 Re > 1000
Pe;, Re”’ + Re” I75
*Altered using the Blasius equation, which relates the friction factor to Re (Bird et uf.. 1060), for 3000 < Re < 100000 and smooth pipes.
158 A. Pinheiro Ton-es et al.
sion being proportional to tube length - through Pe, and not to the tube diameter - through Pe,).
Results from optimisation were analysed with respect to lack of fit (ANOVA), adjusted correlation coefficient (Rzdi), analysis of residuals in terms of their normal- ity (Shapiro and Wilk test), independence (correlation to the estimated values), zero mean and detection of outsiders. Parameters were evaluated towards the null hypo- thesis. Nested models were confronted through an extra SSR analysis (Bates & Watts, 1988). Table 3 summarises the models tested, the parameters estimates, as well as the most relevant statistical data.
Wen and Fan’s model converged to new parameter values which showed to accept the null hypothesis, turning to Taylor’s model, and was thus rejected. For the remaining models there was no statistical evidence that the lack of fit should be accepted, thus suggesting a valid relationship between Pe, and Re. Also, no outsiders were found. The best fit was obtained for both Sjenitzer’s and the power models, though extra SSR analysis for nested models showed that there is no statistical evidence that Sjenitzer’s model describes better our results than the power model. Additionally, the null hypothesis was accepted for the parameter a in the former model, and a correlation of -0.97 was found between parameters SI and y. There- fore, the parameters and corresponding standard errors of the power model, for
Re > 3000: are:
Pe,, = (0.015 * 0~003)(dlL)Re”~‘h’0~22~
10 d Pe :
P
- Nassauer & Kessler (1979) _.&_._ .-._._ -.“.C.V-.----.w.~*.m _.___._.__
1:
0.1:
Taylor (1954)
._/)-‘-d
Wen & Fan (1975)/“‘,_~ Q f
0.01 ; - . ’
0 2ObO SO&I 10
Re
(10)
00 Fig. 6. Experimental Pe, and values obtained from published correlations, for different tube
Relating RTD to processing conditions - I 159 TABLE 3
Summary of Results from the Fit of Various Models to Experimental Data (for Re > .iOOO)
Basis model ,for
optimisa tion
R:,,, Analysis of Extra SSR analysis Parameter,7 (sign$cance residuals * ,for nested models** level of H,,)
Wen & Fan (1 Y75): PC’:, = (x Re”+;’ Re”) ’ Taylor ( 1954)iNassauer & Kessler (1479): Pc~, = z Re” Sjenitzer (19%): PC>,, = CI Re” (L/d), 06.68% 99.42% Y9.78r/r YY.77c;i NO NO Yes Yes - Ho accepted (turns
into Taylor’s model) Partial model not H,, rejected: x = 2.31-u
accepted Ho rejected: /j = I.45 Full model H,, accepted: x = 2.YE-3
(78%), 3: = 0 (22%) H,, rejected: [i = 1.20 H,, rejected: ;’ = - 0.8 I Partial model H,) rejected: r = 0~015 accepted H,, rejected: /j = I.20
“‘Zero mean, normal distribution (Shapiro & Wilk test for normality) and independency of residuals (no significant correlation with predicted independent variable).
““Bates & Watts (1988).
Equation (10) can be simplified using eqn (9) and leads to a relation which, unlike all other models proposed in literature (Table 2) relates Pe, and not Pe,,, to Rc:
Pr = 0.0 IS Rr ’ x for Re > 3000 (11)
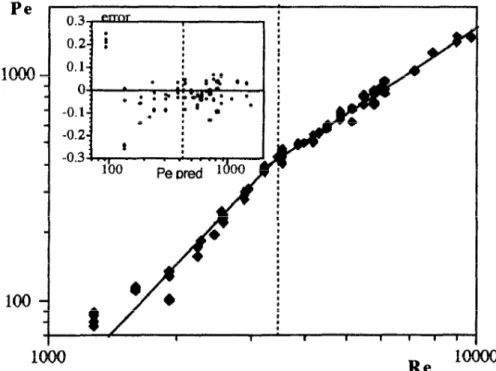
The fit of this model to our experimental data is presented in Fig. 7, and obviously describes better the experimental results than the published correlations. Note that the power model is here linearised by using a log-log scale, and that, unlike in Fig. 6, they-axis corresponds to the Pe, and not to the Pe,, number. The histogram of the residuals shows a normal tendency of the residuals for Re > 3000.
For Re below 3000, Fig. 7 suggests also a power model, but with different param- eters. These were found to be:
Pe=(1~55*0~12) x IO ’ x Rr’ ’ ” ’ ” ‘(” for Re < 3000 (12) This shows that for laminar flow the ratio between hydrodynamic and diffusional fow is rather small and the effect of increasing Re is greater, as might be expected. If one wants to rewrite this equation including SC, then:
Pr=3,45 x 10~~” x (SC x Rc)‘.~’ for Re<2100 (1.3) It should however be stressed that all our experiments in this range of Re were conducted in conditions such that SC is equal to 372, and thus no conclusions can be taken in relation to the effect of SC on RTD.
Finally, we have analysed if there was a statistical evidence that the transition between these two zones is around Re = 3000. This was tested by performing a joint optimisation of parameters for all the range of Re, according to the following equation:
Pe = H(Re - Rrtrana) x zRe”+H( Ret,,,,,, - Rc) x yRr” (14) where Ret,,,,,, is the value of Re of transition and H is the Heavyside function.The best tit was indeed found when considering the transition around the considered
160 A. Pinheiro Torres et al.
Pe
r
1000
Re
lo000
Fig. 7. Fit of the power law model to the experimental data for different flow regimes and corresponding histogram of residuals.
value of Ret,,,, = 3000(R2 = 99.7.5%), thus validating the results presented in eqn (11) and eqn (12). However this function is not continuous in the transition between both equations. By optimising the same eqn (14), subjected to the constraint of being continuous at Re = Retrans, results were slighly different (R2 = 99.71%):
Pe=
I
(2,9k2.8) x IO-’ x Re’2.0’*0 I*) Re< Retrans
(1.6kO.3) x 10P2x Re” 25k0-03’ Re> Ret,,,ns (15)
with
Retrans =3300$_ 170Again, if one wants to rewrite the equation including SC, for laminar flow, then:
Pe= 1.8 x 10P’“x (SC x Re)2’0’for Rec2100 tW
The considerations taken in eqn (13) on the effect of SC on Pe hold for eqn (16).
CONCLUSIONS
Quantitative analysis and modelling of RTD on model foods is required, before extending conclusions to real fluid foods, and applying systematically RTD to the
Relating RTD to processing conditions - I 161
evaluation and optimisation of continuous thermal processing. For the processing conditions tested in this work, RTD was adequately described by the dispersion model. Results also revealed that, in the range studied, fluid dispersion in tubular flow (through Pe) was related to processing conditions (through Re) by a power law model, with Re showing a greater effect in the laminar regime. These results may allow the establishment of processing conditions that guarantee product safety, with a lower detrimental impact of product quality, when compared to the traditional calculations that assume laminar flow.
ACKNOWLEDGEMENTS
The first author acknowledges JNICT (Junta National de Investiga@o Cientitica c Tecnolbgica) for financial support under the scope of ‘Programa CiCncia’ and ‘Pro- grama PRAXIS XXI’.
REFERENCES
Aiba, S. & Sonoyama, T. (1965). Residence-time distribution of a microbial suspension in a straight pipe. Journal qf Fermentution Technology, 45, 534-540.
Aris, R. (1959). Notes on the diffusion-type model for longitudinal mixing in flow. Chemicul Engineering Science, 9, 266-267.
Baptista. P. N.. Oliveira, F. A. R., Cunha, L. M. & Oliveira, J. C. (1995). Influence of large
solid spherical particles on the residence time distribution of the fluid in two-phase tubular flow. International Journal of Food Science and Technology, 30, 625-637.
Baptista, P. N., Oliveira, F. A. R., Oliveira, J. C. & Sastry, S. K. (1997). Effect of product and
process variables in the flow of spherical particles in a carrier fluid through straight tubes.
Journul of Food Processing and Preservation, 20, 467-486.
Bates, D. M. & Watts, D. G. (1988). Nonlinear Regression Analysis und its Applications. John Wiley, New York.
Bird, R. B., Stewart, W. E. & Lightfoot, E. N. (1960). Transport Phenomena. Wiley, New York.
Burton, H. (1958). An analysis of the performance of an UHT milk sterilizing plant: Il. Calculation of the bactericidal effectiveness. Journal of Duiry Research, 25, 324-337
Burton, H. (1988). CJHT Processing of Milk and Milk Products. Elsevier, London.
Cerf, 0. & Hermier, J. (1973). ThermorCsistance anormale de spores bactkriennes chauf&s par injection directe dans le vapeur. Lait, 521-522, 23-39.
Danckwerts, P. W. (1953). Continuous flow systems (distribution of residence times). Ckmi- cal Engineering Science, 2(l), 1- 13.
Fahim. M. A. & Wakao, N. (1982). Parameter estimation from tracer response measure- ments. Chemical Engineering Society, 25, 1-8.
Geankoplis, C. J. (1983). Transport Processes and Unit Operutions. 2nd edn. Allyn & Bacon, Boston, pp. 390-393.
Heppell, N. J. (1985). Comparison of the residence time distributions of water and milk in an experimental UHT sterilizer. Journal of Food Engineeting, 4, 71-84.
Hersom. A. C. (1985). Aseptic processing and packaging of food. Food Reviews International. l(2), 21.5-270.
Holdsworth, S. D. (1992). Aseptic Processing and Packaging of Food Products. Elsevier. London, Chap. 4.
Holdsworth, S. D. & Richardson. P. S. (1986). Continuous sterilization operations for aseptic packaging: an overview. In Process Engineering in the Food Industry, eds Field & Howell. Elsevier. London.
162 A. Pinheiro Torres et al.
Hopkins, M. J., Sheppard, A. J. & Eisenklam, P. (1969). The use of transfer functions in evaluating residence time distribution curves. Chemical Engineering Science, 24, 1131-l 137. Janssen, P. W. M. (1994). Measurement of residence time distribution of processing plant
using a cross correlation technique. Journal of Food Engineering, 21, 215-223.
Kessler, H. G. (1989). Effect of thermal processing on milk. In Developments in Food Preservation, 3rd edn. ed. S. Thorne. Elsevier, New York, Chap. 5.
Lee, J. H., Singh, R. K. & Lineback, D. S. (1995). Particle concentration influence on liquid RTD in a model aseptic processing system. Journal of Food Process Engineering, H(2), 119-133.
Levenspiel, 0. (1958). Longitudinal mixing of fluids flowing in circular pipes. Industrial Engineering Chemistty, 50(3), 343-346.
Levenspiel, 0. (1972). Chemical Reaction Engineering, 2nd edn. John Wiley, New York, Chap. 9.
Levenspiel, 0. & Bischoff, K. B. (1963). Patterns of flow in chemical process vessels. In
Advances in Chemical Engineering, Vol. 4, eds T. B. Drew, J. W. Hoopes Jr & T. Ver- meulen. Academic Press, New York, pp. 95-198.
Lin, S. H. (1979). Residence time distribution of flow in a continuous sterilization process.
Process Biochemistry, 14(7), 23-27.
Lund, D. B. (1977). Design of thermal processes for maximizing nutrient retention. Food Technology, 31(2), 71-78.
Maesmans, G., Hendrickx, M., Weng, Z., Keteleer, A. & Tobback, P. (1990). Endpoint definition, determination and evaluation of thermal processes in food preservation. Belgian Journal of Food Chemistry and Biotechnology, 45(5), 179
Malcata, F. X. (1991). Modeling of a series of continuous stirred tank reactors for thermal processing of liquid foods. International Journal of Food Science and Technology, 0, 535-546.
Milton, J. L. & Zahradnik, J. W. (1973). Residence time distribution of a votator pilot plant using a non-Newtonian fluid. Transactions of the ASAE, 16(6), 1186-1189.
Nassauer, J. & Kessler, H. G. (1979). Zur Berechnung der Verwilzeitverteilung in einer Rohrleitung mit Armaturen. Milchwissenschuft, 34(4), 193-196.
astergaard, K. & Michelsen, M. L. (1969). On the use of the imperfect tracer pulse method for determination of hold-up and axial mixing. Canadian Journal of Chemical Engineering, 47(4), 107-112.
Pinheiro Torres, A. & Oliveira, F. A. R. (1993). Design of a continuous thermal processing unit for simultaneous study of residence time and temperature distributions of foods. In
3rd Conference of Food Engineering (CoFE’93), No. 12.8, Chicago, Illinois, 21-24 February 1993.
Pinheiro Torres, A. & Oliveira, F. A. R. (1998). Residence time distribution studies in the continuous thermal processing of liquid foods: a review. Journal of Food Engineering, (in press).
Pinheiro Torres, A., Oliveira, F. A. R., Baptista, P. N. & Oliveira, J. C. (1993). Evaluation of conventional and new residence time distribution models for the description of tubular aseptic processing systems. In 3rd Conference of Food Engineering (CoFE’93), postTerc No. 13.11, Chicago, Illinois, 21-24 February 1993.
Rangaiah, G. P. & Krishnaswamy, P. R. (1990). Application of time domain curve-fitting to parameter estimation in RTD models. Journal of Chemical Engineering of Jupan, 223(2), 124-130.
Rao, M. A. & Loncin, M. (197&z). Residence time distribution and its role in continuous pasteurization (Part I). Lehensmittel- Wissenschaft und Technologie 7, 5- 13.
Rao, M. A. & Loncin, M. (19746). Residence time distribution and its role in continuous pasteurization (Part II). Lebensmittel- Wissenschaft und Technologie, 7 , 14-l 7.
tiun in the holding section of a plate heat exchanger. Lehetzsmittrl-Wi.ssctzscltu,fi utd lkhtwlogie, 9, 255-256.
Sancho. M. F. & Rae, M. A. (1902). Residence time distribution in a holding tube. Jowttul of’ Food Engineering, 15( I), I - IO.
Sjenitzer. F. (1958). How much do products mix in a pipeline? Pipeline Engineer. December.
11-34.
Taylor, G. ( I YS4). The dispersion of matter in turbulent flow through a pipe. Proccedqs of’ the Royul Sock& qf‘Lot&m, Series ‘4, 223, 446-468.
Trommelcn, A. M. & Beck, W. J. (1971). Flow phenomena in a scraped-surface heat exchanger. Jowtrul qf Et@teeritzg Science, 26, I933- 1942.
Vecrkamp. C. H., Romijn, A. J. M. & Pal, J. C. (1974). Influence of varying rcsidcncl: time distribution on the inactivation of microorganisms during pasteurization of egg products.
Lehfwsmi~~el- Wissetwchyfi utd Tdmologie, 7(S), X16-3 IO.
Wehner. J. F. & Wilhelm, R. H. (1456). Boundary conditions in a flow reactor. C’~wnrcc11
Etlgitweritzg Scietlce. 6, 8Y-93.
Wen, C. Y. & Fan, L. T. (1975). M&Is .fi)r Fhv Sy.sicm.s ad C’hemicul Rcuctors. Marcel Dekker, New York.
Wcnncrberg, J. (1986). Effects of Row distribution and variable temperature in a continuous process line. Mil[,hwi.ssetz.sc,hu,fi, 41(h). 340-343.