This article was published in Industrial & Engineering Chemistry Research, 53 (2014)
1
http://dx.doi.org/10.1021/ie402750p
2
3
4
5
Decontamination of an industrial cotton dyeing wastewater by
6
chemical and biological processes
7
8
9
10
11
12
Carmen S.D. Rodrigues
1,2,
Luis M. Madeira
2, Rui A.R. Boaventura
1,*13
14
15
1
LSRE – Laboratório de Processos de Separação e Reação, Laboratório Associado LSRE/LCM
16
2
LEPABE – Laboratório de Engenharia de Processos, Ambiente, Biotecnologia e Energia
17
18
Departamento de Engenharia Química, Faculdade de Engenharia, Universidade do Porto,
19
R. Dr. Roberto Frias, 4200-465 Porto, Portugal
20
21
22
23
24
25
26
27
28
29
30
31
32
33
34
35
36
37
*Corresponding author: Tel. + 351-22-5081683; Fax: + 351-22-5081449; E-mail: bventura@fe.up.pt
Abstract
38
39
The organic matter mineralization, decolorization, biodegradability improvement and toxicity reduction of
40
an industrial cotton dyeing wastewater was investigated. Different treatment approaches, including single
41
and integrated processes, were studied, namely: coagulation/flocculation per se and its combination with
42
Fenton’s oxidation (Approach 1), Fenton’s process alone (Approach 2) and its integration with either
43
coagulation/flocculation (Approach 3) or biological oxidation in a sequential batch reactor (Approach 4).
44
All approaches provided a wastewater that meets the Portuguese legislated discharge limits, however
45
Approaches 1 and 3 require smaller operating costs (1.0 €/m3) with global removal efficiencies for these
46
two strategies of 70.8% for COD (Chemical Oxygen Demand), 66.1% for DOC (Dissolved Organic
47
Carbon) and 47.6% for BOD5 (Biological Oxygen Demand) in Approach 1 and 69.2% for COD, 60.4% for
48
BOD and 72.4% for DOC in Approach 3, along with almost complete color removal in both strategies and
49
toxicity reduction (0.0% inhibition of Vibrio fischeri in the effluent from Approach 1). A slight increase of
50
the effluent biodegradability was also observed (BOD5:COD increased from 0.26 to 0.33-0.46, and SOUR
51
(specific oxygen uptake rate) increased from 8.85 to 9.3-11.3 mgO2/(gVSS h)), depending on the treatment
52
approach. The use of a cheap process (coagulation/flocculation) as pre-treatment allowed reducing the
53
amount of reagents needed in the Fenton process, making the latter treatment slightly cheaper, and thereby
54
reducing the overall costs.
55
56
57
58
59
60
61
62
63
64
65
66
Keywords: Industrial textile dyeing wastewater; Coagulation/Flocculation; Fenton’s reagent; SBR;
67
Economic analysis.
68
69
70
Introduction
71
72
Textile industries consume large amounts of water in the dyeing process and generate highly polluted
73
effluents containing dyes, salts and other organic compounds. 1 When these pollutants come into contact
74
with the environment, many negative effects often occur such as a reduction of the re-oxygenation capacity
75
and a decrease in the sunlight penetration, thereby upsetting the biological activity of the aquatic life.2 In
76
order to minimize these impacts it is necessary to implement efficient and effective treatments of the
77
wastewater before discharge.
78
Many studies reported in literature, focused on the treatment of textile wastewaters, show results from the
79
application of physical-chemical processes (such as coagulation/flocculation, adsorption and membrane
80
separation),3-8 chemical oxidation,9-12 or biological processes.13-15 Among all these techniques,
81
coagulation/flocculation, advanced chemical oxidation with Fenton’s reagent and biological degradation
82
have been widely studied. The first technique has been used to remove dyes, colloidal organic compounds
83
and suspended solids16 through the addition of coagulants (usually iron or aluminum salts) and flocculants
84
(polymers) that promote the destabilization of the colloids and their aggregation. The removal of the
85
particles formed is achieved through filtration or sedimentation.17,18 The Fenton’s process allows the
86
oxidation of dyes and organic compounds, while reducing the toxicity and increasing the biodegradability.
87
This process is based on the generation of hydroxyl radicals (with very high oxidation potential)19 by the
88
decomposition of hydrogen peroxide catalyzed by ferrous ion in acid medium (eq. 1), the catalyst being
89
regenerated by reaction between Fe3+ and H2O2 (eq. 2). Finally, the hydroxyl radicals oxidize organic
90
compounds and dyes (eq. 3), the complex mechanism being shortly summarized by the following
91
reactions:2092
93
Fe2+ + H2O2 Fe3+ + HO + OH (1)94
95
Fe3+ + H2O2 Fe2+ + HO2 + H+ (2)96
97
HO + RH H2O + intermediates (3)98
99
Of course, the intermediates can be also oxidized and ultimately mineralized. The biological treatment in
100
sequential batch reactor (SBR) is a variant of the conventional activated sludge system21 operating in 5
101
stages per cycle (influent feeding, reaction, sedimentation, discharge of the clarified effluent, sludge purge
102
and idle).22 The SBR presents some advantages comparatively to the conventional biological treatment,
103
namely flexibility and simplicity, low cost and increased resistance to fluctuations in influent feeding.23
104
Additionally, equalization, reaction and clarification occur in the same reactor.24
105
This work aimed at evaluating several approaches for treating a real cotton dyeing wastewater (see Figure
106
1) taking into account the characteristics of the effluent as well as the results of a previous study focused
107
on the treatability of a simulated cotton dyeing effluent.25 In Approach 1 coagulation/flocculation was
108
combined with Fenton’s reaction (as coagulation/flocculation per se is not effective to comply with
109
legislated discharge standards, as detailed below). In Approach 2 only Fenton’s oxidation was applied and
110
in Approaches 3 and 4 the wastewater was pre-treated by Fenton’s oxidation and then treated by
111
coagulation/flocculation and a biological process (SBR), respectively. In all situations it was intended to
112
obtain the lowest operating cost and an effluent that meets the discharge limits imposed by the Portuguese
113
legislation for textile effluents. Therefore, to reduce costs, part of the catalyst used in the Fenton’s reaction
114
of Approach 1 was the residual dissolved iron resulting from coagulation/flocculation (this methodology
115
has been already applied to industrial wastewaters other than textile dyeing ones).26-28 In the same way, in
116
Approach 3 the coagulant used was the residual iron resulting from the Fenton’s reaction; however, in this
117
case the final effluent clearly complied with legislated standards, and so the Fenton’s stage was also
118
performed with doses of chemicals reduced to 3/4 and 1/2 of the optimum value found in Approach 2 (this
119
methodology has not yet been described in the literature). In Approach 4 the doses of reagents used in the
120
Fenton’s oxidation were also reduced, as described above, and the resulting effluent was subjected to a
121
biological process. It has been reported in literature 29 the need of using oxidative processes as a
pre-122
treatment step of industrial textile wastewaters with the aim of generating a biodegradable effluent without
123
extensive testing the behavior of the biological process. Recent works already integrated both processes,
124
particularly combining Fenton’s oxidation and biological degradation in SBR.30-34 The ultimate choice of
125
the technology to adopt should take also into account economic indicators, and so a cost analysis was
126
performed for each treatment strategy, as detailed in the next section. In this work, all possible treatment
127
strategies were applied for the first time to an industrial wastewater, taking into account current discharge
128
limits and the results of a previous study focused on the treatability of a simulated effluent, comparison
129
being made based on processes performance and associated operating costs (chemicals and energy
130
consumption).131
132
2.Operating Costs
133
To select the better integration of stages for wastewater treatment, but ensuring that the generated effluent
134
meets the discharge standards, the operating costs associated to the consumption of chemicals and energy
135
were assessed. However, to calculate the energy costs only the energy consumed in agitation (power
136
required = 0.61 W) and air insufflated (power = 4.5 W) in the SBR stage was considered because the costs
137
regarding stirring in coagulation/flocculation (0.002 €/m3) and Fenton oxidation (≈ 410-5 €/m3) are
138
negligible. The costs concerning the acidification in the Fenton process and further neutralization were also
139
taken into account (0.06 €/m3 and 0.11 €/m3, respectively). The cost of the energy required to heat the
140
effluent during the Fenton process was discarded having in mind the high temperature of dyeing
141
wastewaters (50-70 °C or even higher). Finally, the costs of treatment and disposal of the chemical sludge
142
generated in coagulation/flocculation and Fenton processes are highly variable and so were not considered.
143
In the economic analysis the costs of main chemicals were those given by Quimitécnica S.A. and Rivaz
144
Química S.A.: H2O2 (49.5% w/v, density at 25 ºC = 1.2 g/cm3) – 365 €/ton; FeSO4.7H2O (93 wt.% of purity)
145
– 233.7 €/ton; Magnafloc 155 – 3850 €/ton; H2SO4 (96% w/v, density = 1,84 kg/dm3) – 140 €/ton; NaOH
146
(30% w/w, density = 1,33 kg/dm3) - 185 €/ton. For energy it was considered the average value of 0.10
147
€/kWh.
148
The operating cost for the coagulation/flocculation step is the sum of costs of Fe2+ (eq. 4) and Magnafloc
149
155 (eq. 5), while for Fenton’s reaction is the sum of costs of Fe2+ used (eq. 4), H2O2 consumed (eq.6), as
150
well as the acid and base required for acidification and subsequent neutralization, respectively; finally, for
151
SBR is the cost of energy (eq. 7) only.
152
(7) ) 3 (m Volume (h) time * h) (kW Price * (kW) 10 * ) required Power (Power Cost (6) (kg/L) 100 % ) L kg ( ρ * ) m ton ( 10 * O H * ) ton € ( Price Cost (5) ) m ton ( 10 * 155 Magnafloc * ) ton € ( Price Cost (4) 100 purity of % MM MM * ) m ton ( 10 * Fe * ) ton € ( Price Cost effluent treated aeration energy 3 -agitation d insufflate air energy O H O H 3 3 2 2 O H O H 3 6 155 Magnafloc 155 Magnafloc Fe O 7H FeSO 3 6 2 O 7H FeSO Fe 2 2 2 2 2 2 2 2 2 2 4 2 4 2 153
154
In the previous equations, [i] represents the concentration of species i (in g/L for H2O2 and mg/L for Fe2+),
155
MMi stands for its molar mass (in g/mol) and the power required for agitation is expressed in W.
156
The total operating costs for the integrated processes are calculated by the sum of costs associated with
157
each process involved.
158
159
3.
Materials and Methods
160
3.1. Textile Dyeing Wastewater
161
The industrial wastewater used in this study was the cotton dyeing effluent coming from the equalization
162
tank of the dye-house Têxtil Luís Simões (Manhente – Barcelos, Portugal). The dyes used in the dyeing
163
bath are reactive ones but no information was provided about the specific dyes present in the tank.
164
The main wastewater characteristics are presented in Table 1; the raw effluent presents black color,
165
reasonable concentration of organic compounds (as inferred from the DOC and COD values), low
166
biodegradability (BOD5:COD ratio <0.4), and high toxicity to Vibrio fischeri. As the wastewater does not
167
comply with any of the legislated discharge standards for pH, COD, BOD5 and color (Ordinance no. 423
168
of June 25, 1997 – cf. Table 1), an appropriate treatment is required before discharge.
169
170
3.2. Experimental Procedure
171
172
3.2.1 Coagulation/Flocculation173
174
The coagulation/flocculation experiments were conducted in a Jar-test (ISCO, Italy). In all experiments, a
175
sample volume of 500 mL was employed. The pH of wastewater was adjusted and the solution transferred
176
into a beaker. The coagulant (ferrous sulfate) was added under rapid stirring (150 rpm), and the pH
177
readjusted, if necessary (it is worth noting that afterwards it remained constant, i.e. throughout the
178
experiments). After 3 min of rapid mixture the stirring rate was reduced to 20 rpm, the flocculant added
179
(Magnafloc 155) and the agitation proceeded during 15 minutes. After 30 min of sedimentation the
180
supernatant was collected and acidified with HNO3 (68%, from Merck, Germany) to pH < 4 to keep the
181
iron dissolved (so that it could be used as catalyst in Fenton’s reaction).
182
All coagulation/flocculation experiments were conducted at room temperature (22-24 ºC). All these
183
conditions were set based on preliminary results achieved with a similar synthetic effluent.35
184
185
3.2.2 Fenton’s Reaction
186
187
In Fenton’s oxidation runs 500 mL of wastewater pre-treated by coagulation/flocculation (Approach 1) or
188
raw wastewater (Approaches 2, 3 and 4 – cf. Fig. 1) was put into a batch jacketed reactor, connected to a
189
water thermostatic bath (Grant Y6, England) to maintain the temperature inside the reactor at 50 ºC. After
190
temperature stabilization, the pH was adjusted to 3.5 with 2M H2SO4 (from Merck, Germany). These values
191
of temperature and pH were found as the optimal ones for the treatment of cotton dyeing synthetic effluent
192
by Fenton’s oxidation after coagulation/flocculation.25 The catalyst (FeSO4, 7H2O, from Merck - Germany)
193
was then added and the reaction started with addition of H2O2 30% (w/v) (Merck, from Germany). During
194
the reaction the solution was constantly stirred by using a magnetic bar and a stir plate (Falc, Italy).
195
Before measuring the DOC of samples taken over time, the homogeneous reaction in the sampling vial was
196
stopped by addition of excess sodium sulfite, which immediately reacts with the remaining hydrogen
197
peroxide. For the other analytical determinations where sulfite interferes, the residual H2O2 was eliminated,
198
with simultaneous iron precipitation, by raising the pH to 12.3 through the addition of 10 M NaOH (from
199
Merck) and heating the samples at 80 °C for 10 minutes.36-37 Then the effluent was neutralized (to pH ~7.0)
200
with concentrated H2SO4, although the samples used for V. fischeri inhibition assessment were neutralized
201
with HCl, as proposed by the analytical methodology.38 This methodology was also applied to stop the
202
reaction when using the combination of the advanced oxidation with biological treatment (Approach 4).
203
In Approach 3 the effluent after the oxidation stage was acidified to pH ≈ 1 to keep the iron dissolved for
204
the coagulation/flocculation study, while simultaneously slowing down or inhibiting the Fenton’s reaction;
205
analyses of the effluent were performed immediately.
206
207
3.2.3 Biological Oxidation in SBR
208
209
The Sequencing Batch Reactor (SBR) is a jacketed cylindrical-conical tank (20 cm internal diameter, 45
210
cm total height, 30º slope conical bottom, 5.0 L effective working volume – cf. Figure S1 in Supporting
211
Information). Water from a thermostatic bath (Isco GTR 90, Italy) circulates through the jacket to keep the
212
temperature constant (25 ºC) inside the reactor.
213
The SBR operated in successive cycles of 12 hours (1 hour for feeding, 6 h of reaction under aeration, 4 h
214
of sedimentation, 0.8 h for discharge and 0.2 h idle), up to10 cycles. In the first cycle the reactor was fed
215
with 2.5 L of pre-treated wastewater with pH previously adjusted to ~7.0 using 2M H2SO4 and 10M NaOH.
216
Then 2.5 L of activated sludge (~ 5 g VSS/L) from the aeration tank of Rabada WWTP (Santo Tirso -
217
Portugal) was added to the reactor. In the subsequent cycles the reactor was fed with 2.5 L of effluent to
218
compensate the amount of treated effluent discharged. During the reaction stage, a mechanical stirrer was
219
employed (stirring rate = 400 rpm) and the dissolved oxygen content was maintained at ~3.0 mgO2/L by a
220
diffused air aeration system.
221
The values of dissolved oxygen and the duration of each cycle and each cycle stage were established in
222
accordance with literature: 0.05 to 1.1 h for filling, reaction between 6 to 19 h, 1 to 3.5 h for settling, 0.5 to
223
0.9 h for treated wastewater discharge and 0.05 to 0.5 h for the idle stage.13, 24, 30, 39-42
224
The acquisition of data and the automatic control of the unit, i.e., operation of the peristaltic pumps
225
(Watson-Marlow 502S, England), Burckert valve (Germany) and mechanical stirrer (VWR VOS power
226
control, Germany), was achieved by Labview 5.0 software (from National Instruments), through a
home-227
made designed interface.
228
229
3.3.
Analytical Methods
230
231
Color was quantified by measuring the absorbance at the wavelength of maximum absorbance (max = 600
232
nm), using a molecular absorption spectrophotometer (Pye Unicam, model Helios α, Germany). As the
233
absorbance varies with pH, in the treated effluent or samples taken over time, pH values were adjusted to
234
the initial ones before any absorbance measurements.
235
The specific oxygen uptake rate (k’) was evaluated at 20 ºC and calculated as the ratio between the oxygen
236
concentration decay rate (which was linear in the below-mentioned period) and the volatile suspended
237
solids (VSS) concentration after the addition of the inoculum (700 mg VSS/L).43,44 The samples were
238
inoculated with biomass from the activated sludge tank of a WWTP treating textile effluent, and the
239
dissolved oxygen concentration measured for 30 min (using a YSI Model 5300 B biological oxygen
240
monitor, USA). The activity of the activated sludge used in the k’ assessment was checked by using
241
methanol as substrate and the results showed that the biomass was in good status. The evaluation of the
242
effluent biodegradability was complemented by the value of the BOD5:COD ratio.
243
The inhibition of Vibrio fischeri test was performed according to standard DIN/EN/ISO 11348-3.38 The
244
bacteria were placed in contact with samples at 15 ºC and the bioluminescence measured after a contact
245
time of 5, 15 or 30 minutes in a Microtox model 500 analyzer (England).
246
Other analytical determinations were carried out according to Standard Methods:44 dissolved organic carbon
247
(DOC) was measured in a TC/TOC analyzer (Shimadzu 5000A, from Japan) - Method 5310 D; the
248
biochemical oxygen demand (BOD5) was determined according to Method 5210 B; the chemical oxygen
249
demand (COD) was assessed by the open reflux method (Method 5220 B); and total phosphorus by Method
250
4500P - E. Total nitrogen was determined by colorimetry according to Method D992-71 of the ASTM
251
Standards45 after previous digestion (Method 4500 - N C); the total suspended solids (TSS) and volatile
252
suspended solids (VSS) were evaluated by gravimetry - Method 2540 B and Method 2540 E, respectively.
253
The alkalinity was evaluated by titration with H2SO4 at pH 4.5 (Method 2320 D) while the pH was measured
254
using a selective electrode (Hanna Instruments HI 1230, Italy) and a pH meter (Hanna Instruments HI 8424,
255
Italy). The conductivity at 20 ºC was determined using a conductivity probe (WTW TetraCon 325,
256
Germany) and a conductivity meter (WTW LF538, Germany) - Method 2510 B. Finally, chlorides, nitrates,
257
sulfates and dissolved phosphorus were measured by ion chromatography (Dionex DX 120, from USA)
258
using a Dionex Ionpac AS9-HC 4 mm (10-32) column (from USA). Total dissolved iron was determined
259
by AAS (GBC 932 AB Plus).
260
All analytical determination were performed in duplicate, and the coefficients of variation were less than
261
2% for DOC, 6% for BOD5, 4% for COD and k’, and 5% for the other parameters.
262
263
4
. Results and Discussion
264
265
4.1. Coagulation/Flocculation plus Fenton’s Reaction (Approach 1)
266
267
This study started with the application of coagulation/flocculation to the raw industrial wastewater, using
268
ferrous sulfate and Maganafloc 155 as coagulant and flocculant, respectively. The operating conditions
269
used were the optimal ones determined in a prior study on the treatment of a synthetic cotton wastewater:35
270
Vcoagulation=150 rpm, tcoagulation= 3 min, [Fe2+]= 200 mg/L, pH= 9.4, Vflocculation=20 rpm, tflocculation= 15 min,
271
[Magnafloc 155] = 0.5 mg/L. The characteristics of the wastewater after treatment are presented in Table
272
1. One can conclude that coagulation/flocculation is very efficient as regards color removal (95.1% - percent
273
removal efficiencies are within brackets in the table), leads to a considerable removal of organic matter
274
(36.9% and 39.4% respectively for COD and DOC) and phosphorus (47.2%), but it is quite inefficient
275
concerning the removal of BOD5 (17.2%) and nitrogen (1.9%). Moreover, the values of COD and BOD5 in
276
the final effluent are above the discharge standards imposed by the Portuguese legislation, which makes
277
necessary an additional treatment.
278
So, for increasing the efficiency of organic matter removal, the effluent from the coagulation/flocculation
279
stage was subjected to Fenton’s oxidation, applying the operating conditions already optimized when
280
treating a synthetic effluent by the same integrated process:25 T= 50 ºC, pH= 3.5, t= 60 min, [H2O2]= 500
281
mg/L and [Fe2+]added= 98.3 mg/L (total ironconcentration = 100 mg/L, taking into account that 1.7 mg Fe/L
282
remained from the coagulation/flocculation step). Results included in Table 1 point out that Fenton’s
283
oxidation applied to the pre-treated effluent allowed obtaining COD, BOD5 and DOC removals of 53.7,
284
36.7 and 44.1%, respectively, color reduction of 89.3% and smaller decreases in total phosphorus and total
285
nitrogen concentrations (29.7 and 2.7%, respectively).
286
The global efficiencies for the combined process (coagulation/flocculation plus Fenton’s reaction) are
287
significant for color (99.5%), COD (70.8%), DOC (66.1%) and total phosphorous (62.9%), moderate for
288
BOD5 (47.6%) and low for total nitrogen (4.5%). Except for BOD5 the efficiencies reached are similar to
289
those obtained when treating a synthetic cotton dyeing effluent by the same integrated process (61.7, 25.8,
290
71.2 and 99.8% for COD, BOD5, DOC and color, respectively).25 Moreover, the resulting effluent meets
291
the discharge standards (Table 1), and this is reached at a low operating cost (1.0 €/m3), which was
292
calculated taking into account the amounts of chemicals employed in both coagulation/flocculation and
293
Fenton’s steps, as described in section 2, as well as the acidification and subsequent neutralization costs in
294
the Fenton process. Fenton´s oxidation contributes to the overall cost by about 70%. This puts into evidence
295
the importance of the integrated treatment strategy adopted. A cheaper process (coagulation/flocculation)
296
used as pre-treatment permits reducing the amounts of chemicals required by Fenton’s oxidation, thus
297
lowering the global operating cost. To the best of our knowledge no studies regarding the combination of
298
coagulation/flocculation with the Fenton process to treat industrial textile dyeing effluents are reported in
299
the literature.
300
301
302
4.2. Fenton’s Oxidation (Approach 2)
303
304
The study proceeded by applying the Fenton’s oxidation directly to the raw effluent having in mind the
305
possibility of meeting the discharge standards by this chemical process alone.
306
The effect of the hydrogen peroxide dose was first assessed, starting with the optimal dose found in the
307
treatment of synthetic cotton dyeing effluent by the same process (10 g/L)25 and then gradually decreasing
308
the dose down to 0.938 g/L, to reduce the costs associated with chemicals consumption. Reducing the
309
oxidant consumption, while complying legislated limits, is of paramount importance because it represents
310
the main contribution to the operating costs. The other variables were fixed according to the previous work
311
using simulated wastewater:25 pH = 3.5, T = 50 ºC, t = 60 min and [Fe2+] = 300 mg/L.
312
BOD5, COD, DOC, and color removals (see Figure 2 a) increased from 29.4, 46.5, 46.3 and 94.6 % to 38.9,
313
62.4, 63.2, and 97.8%, respectively, when raising the hydrogen peroxide dose from 0.938 to 1.25 g/L, but
314
further increases of the hydrogen peroxide dose did not result in any efficiency improvement. The optimal
315
dose found is much below that obtained in the previous study conducted with a synthetic dyeing cotton
316
wastewater (10 g/L);25 this is due to the fact that the chloride concentration in the real effluent (~ 1.2 g/L))
317
is much lower than in the synthetic one (~ 8.0 g/L), thus decreasing considerably the effect of hydroxyl
318
radical scavenging by this anion.2
319
The existence of an optimum H2O2 concentration was also observed by other authors9, 10, 44-47 and is
320
explained by the fact that a parallel reaction between H2O2, in excess, with the hydroxyl radicals occurs,
321
generating HO2 species with a lower oxidation potential (HO + H2O2 H2O + HO2). The optimum
322
value achieved (1.25 g/L) is close to those obtained by other authors, namely, Meriç et al.50 reached an
323
optimum H2O2 dose of 1.0 g/L for treating a reactive black 5 dye solution, Blanco et al.31 found 1.65 g/L as
324
the optimum dose for treating a real textile effluent and Wu and Wang49 achieved 1.5 g/L when treating a
325
mixture of printing and dyeing wastewaters by Fenton’s reaction.
326
To reduce the operating costs associated with the catalyst use, the Fe2+ dose was set at 37.5 mg/L
327
(corresponding to a Fe2+:H2O2 ratio of 1:33.3 (w/w) – optimum value reached when treating a synthetic
328
cotton wastewater by Fenton’s oxidation),25 maintaining the other variables (3.5, 50 ºC, 60 min and 1.25
329
g/L for pH, temperature, reaction time and H2O2 concentration, respectively). Figure 2 b shows the results
330
obtained for DOC, COD, BOD5 and color removals; it can be seen that only a small decrease occurred (33.6
331
% for BOD5, 53.0% for COD, 52.8% for DOC and 94.3% for color) in comparison with that corresponding
332
to the Fe2+ concentration previously employed (about one order of magnitude higher – 300 mg/L). It is
333
worthy remarking that this much smaller iron dose still allows obtaining an effluent that meets the legislated
334
discharge limits (see Table 1), although the COD value (232.8 mg/L) is not very far from the legislated
335
limit (250 mg/L). Daily or seasonal variations in the wastewater composition can cause that limit to be
336
exceeded and so additional subsequent treatments could be required to increase the overall efficiency, as
337
described below.
338
The selected dose of ferrous ion (37.5 mg/L) is similar to that reached by other authors to treat
dye-339
containing solutions, as well as synthetic and real wastewaters. Ramirez et al.9 obtained an optimum amount
340
of catalyst of 27.2 mg/L for 99.7% color removal (T=29 ºC) and 23.5 mg/L for 70.7% TOC reduction (T=50
341
ºC) from an orange II dye solution. Bali and Karagözoglu51 reached 25 mg/L of Fe2+ as the dose that
342
maximized the color removal (96.2%) of a synthetic textile effluent containing polyvinyl and remazol
343
turquoise blue G-133. Finally, Papadopoulos et al.19 needed to add 40 mg/L of Fe2+ to treat a real effluent
344
from polyethylene fibers processing.
345
The operating cost associated with chemicals consumption when applying the optimal doses achieved in
346
the treatment of simulated cotton dyeing wastewater (300 mg Fe2+/L and 10 g H2O2/L), along with the
347
sulfuric acid required for wastewater acidification to the pH required in the process, is 9.3 €/m3. However,
348
this cost is reduced to 1.3 €/m3 when using, in Fenton’s oxidation of the real wastewater, the selected doses
349
of 37.5 mg Fe2+/L and of 1.25 g H2O2/L; such reduced cost is ascribed to the much lower concentration of
350
chlorides in the real wastewater. To achieve a soluble iron concentration below the discharge limit (2 mg/L)
351
it is necessary to precipitate the iron as Fe(OH)3 by adjusting the pH to 6.0-9.0. The cost of NaOH required
352
for neutralization is about 0.11 €/m3. So, the operating costs associated with the chemicals consumption,
353
when the effluent is treated using the last operating conditions, is ≈1.4 €/m3.
354
355
4.3. Integration of Fenton’s Oxidation and Coagulation/Flocculation (Approach 3)
356
357
Coagulation/flocculation was applied to the effluent previously treated by the Fenton process to further
358
increase the organic matter reduction. However, several strategies were considered aiming reducing costs.
359
In this perspective, different conditions were tested in the Fenton’s stage: one run was performed in
360
conditions considered as the optimal ones – 1.25 g/L of H2O2 and 37.5 mg/l of Fe2+ (run #3); in the other
361
runs the doses of H2O2 and Fe2+ were reduced to 3/4 and 1/2, respectively (see Figure 1), with the objective
362
of decreasing the operating costs (runs #2 and #1, respectively). In the coagulation/flocculation stage the
363
coagulant used was the dissolved iron resulting from Fenton’s oxidation (13.3, 23.1 and 32.7 mg/L of Fe
364
in run#1, run#2 and run#3, respectively), for minimizing costs. The other variables correspond to the
365
optimal conditions obtained when treating the simulated cotton dyeing effluent by Fenton’s reagent plus
366
coagulation/flocculation:25 Vcoagulation=150 rpm, tcoagulation= 3 min, pH= 5, Vflocculation=20 rpm, tflocculation= 15
367
min, [Magnafloc 155] = 2.5 mg/L.
368
Table 2 presents the results obtained after Fenton’s oxidation and after coagulation/flocculation, as well as
369
the global removal efficiencies for each strategy (runs #1 to #3). The COD, DOC and color removals
370
reached in Fenton’s reaction are in all strategies higher than in the coagulation/flocculation stage, but BOD5
371
shows an opposite behavior. As expected, much better treatment efficiencies are reached in run #3, where
372
doses of chemicals in the Fenton’s stage are higher (69.2, 60.4, 72.4, and 96.6% for COD, BOD5, DOC and
373
color, respectively).
374
Final COD values below the discharge standards were only reached in runs#2 and #3, where greater H2O2
375
(and Fe2+) doses were used. However, despite the slightly lower organic matter removal efficiency, the
376
chemical dosages used in run #2 were selected because they originate smaller operating costs (1.0 €/m3),
377
comparatively to run #3 (1.4 €/m3), which is associated with the lower H2O2 and Fe2+ concentration
378
employed, without compromising compliance with the legislated discharge standards.
379
The use of dissolved iron resulting from Fenton process as coagulant in the subsequently stage of
380
coagulation/flocculation represents an economic advantage, since the operating cost is reduced by 27.5%
381
comparatively to Fenton’s oxidation alone.
382
383
4.4. Combination of Fenton’s Reaction and SBR (Approach 4)
384
385
As the biodegradability of the raw wastewater (in terms of BOD5:COD ratio and k') slightly increased after
386
Fenton’s oxidation (from 0.26 and 8.85 mg O2/(gvss h) to 0.36 and 9.5 mg O2/(gvss h), respectively), and
387
there was also a reduction in Vibro fischeri inhibition, as shown in Tables 1 and 2, the alternative integrated
388
process consisting of Fenton’s reaction followed by SBR was studied.
389
Three experiments were performed using different doses of chemicals in Fenton’s oxidation stage. One
390
experiment (run #3) was performed under the optimal conditions determined in Approach 2 (37.5 mg/L
391
Fe2+ and 1.25 g/L H2O2); in the other runs the doses of H2O2 and Fe2+ were reduced to 3/4 and 1/2,
392
respectively, with the objective of reducing the operating costs (runs #2 and #1, respectively) (see Figure
393
1).
394
Figure 3 shows the COD, DOC, BOD5, color, total nitrogen and total phosphorus removals during 10 cycles
395
of SBR operation for the 3 runs; one can conclude that the removals for all parameters analyzed remained
396
practically constant after 6 cycles in all runs/strategies tested, which means that a pseudo-steady state was
397
reached. The efficiencies increased with the doses of chemicals used in the Fenton’s reaction (run #3 > run
398
#2 > run #1), simultaneously with a significant decay of toxicity and a slight increase of biodegradability
399
(see also Table 3). Particularly the inhibition of Vibrio fischeri decreased from 44.5-49.2% in run # 1 to 0.0
400
(non-inhibition) in run # 3. The average removals achieved in the last 4 cycles are presented in Table 3.
401
BOD5 removal was greater in SBR probably due to the breakdown of the more recalcitrant compounds by
402
chemical oxidation. As regards decolorization, about 94% of the absorbance of raw wastewater was
403
removed by the Fenton’s reaction and only 38-40% of the residual absorbance was removed in the SBR.
404
As shown in Figure 4, the operating costs associated with the consumption of chemicals and energy increase
405
with the amount of chemicals used in the chemical treatment, i.e, run #3 (2.6 €/m3) > run #2 (2.3 €/m3) >
406
run #1 (2.0 €/m3). However, only runs #2 and #3 allowed obtaining effluents that meet the discharge
407
standards, namely in terms of COD (see Table 3). As the costs are slightly smaller, conditions used in run
408
#2 are proposed for practical applications. The overall efficiencies achieved by the combination of Fenton’s
409
oxidation and biological degradation in SBR under such conditions are 63.0, 49.5, 64.6, 12.7, 11.9 and
410
96.5% for COD, BOD5, DOC, total nitrogen, total phosphorus and color, respectively. It is noteworthy that
411
such integrated process is more expensive than Fenton’s oxidation per se (cf. Fig. 4), which is due to energy
412
consumption in the SBR (1.2 €/m3), although doses of chemicals were minimized in the chemical oxidation
413
stage.414
415
5. Conclusions
416
417
A combination of coagulation/flocculation and Fenton’s oxidation (Approach 1), Fenton’s oxidation alone
418
(Approach 2), and integrated processes of Fenton´s oxidation with coagulation/flocculation (Approach 3)
419
or biological degradation in SBR (Approach 4) were applied to a real cotton dyeing wastewater aiming at
420
organic matter mineralization, color removal and toxicity reduction while obtaining an effluent that meets
421
the legislated discharge limits at the lower operating cost.
422
All the treatment processes tested allowed obtaining an effluent that complies with the discharge limits, but
423
the cheapest alternatives are the application of coagulation/flocculation followed by Fenton’s oxidation or,
424
inversely, the combination of Fenton’s oxidation with subsequent coagulation/flocculation process. The
425
operating cost associated to the consumption of chemicals is 1.0 €/m3 for both approaches. This is in part
426
explained by initially using a cheaper treatment that permits a reduction of the amounts of chemicals
427
employed in the second process, then decreasing the total costs (Approach 1), and by taking advantage of
428
dissolved iron resulting from Fenton’s reaction as coagulant in the coagulation/flocculation step (Approach
429
3). Global removal efficiencies of 99.5, 70.8, 66.1, 47.6% and 96.6, 62.6, 64.4 and 47.5 % were obtained
430
for color, COD, DOC and BOD5, respectively, in the first and second integrated treatment processes
431
(Approaches 1 and 3).
432
This study showed that: i) industrial cotton dyeing effluents often present low biodegradability (BOD5:COD
433
ratio < 0.4), ii) Fenton´s oxidation slightly increases the biodegradability of the effluent; iii) Fenton’s
434
oxidation generates an effluent able to be discharged but with an organic load in terms of COD near the
435
discharge limit, so the integration of this process with coagulation/flocculation is a better treatment
436
approach; iv) The combination of Fenton’s oxidation with biological treatment in SBR is more expensive
437
than the above mentioned Approaches 1 and 3.
438
439
Acknowledgments
440
441
Carmen Rodrigues is grateful to FCT – Fundação para a Ciência e Tecnologia – for the financial support
442
through the PhD grant (Ref. SFRH/BD/46704/2008).
443
The authors are thankful to dye-house Têxtil Luís Simões (Manhente - Barcelos, Portugal) for kindly
444
supplying the industrial wastewater, to TRATAVE S.A. (WWTP of Rabada) for providing the aerobic
445
biological sludge for the respirometric tests and SBR inoculation, and to Quimitécnica S.A and Rivaz
446
Química S.A. for providing the prices of chemicals.
447
448
Supporting Information Available
449
450
A diagram of the SBR set-up is available in this section. This information is available free of charge via the
451
Internet at http://pubs.acs.org/.452
453
Literature Cited454
455
(1) Jonstrup, M.; Punzi, M.; Mattiasson, B. Comparison of anaerobic pre-treatment and aerobic
post-456
treatment coupled to photo-Fenton oxidation for degradation of azo dyes. J. Photoch. Photobio.A 2011
,
457
224, 55-61.
458
(2) Malik, P.K.; Saha, S.K. Oxidation of direct dyes with hydrogen peroxide using ferrous ion catalyst. Sep.
460
Purif. Technol. 2003, 31, 241-250.
461
462
(3) Ciardelli, G.; Corsi, L.; Marcucci, M. Membrane separation for wastewater reuse in the textile industry.
463
Resour. Conserv. Recy. 2001, 31, 189-197.
464
465
(4) Bes-Piá, A.; Mendonza-Roca, J.A.; Alcaina-Miranda, M.I.; Ilborra-Clar, A.; Ilborra-Cla, M.I. Reuse
466
of wastewater of the textile industry after its treatment with of physical-chemical treatment and membrane
467
technologies. Desalination 2002, 149, 169-174.
468
469
(5) Walker, G.M.; Weatherley, L.R. Textile Wastewater Treatment Using Granular Activated Carbon
470
Adsorption in Fixed Beds. Separ. Sci. Technol. 2002, 35, 1329-1341.
471
472
(6) Fersi, C.; Gzara, L;. Dhahbi, M.Treatment of textile effluents by membrane technologies. Desalination
473
2005,
185, 399-409.474
475
(7) Joo, D.J.; Shin, W.S.; Choi, J.-H.; Choi, S.J.; Kim, M.-C.; Han, M.H.; Ha, T.W.; Kim, Y.-H.
476
Decolorization of reactive dyes using inorganic coagulants and synthetic polymer. Dyes Pigm. 2007, 73,
477
59-64.
478
479
(8) Zahrim, A.Y.; Tizaoui, C.; Hilal, N. Evaluation of several commercial synthetic polymers as flocculant
480
aids for removal of highly concentrated C.I. acid black 210 dye. J. Hazard. Mater. 2010, 182, 624-630.
481
482
(9) Ramirez, J.H.; Costa, C.A.; Madeira, L.M. Experimental design to optimize the degradation of the
483
synthetic dye orange II using Fenton’s reagent. Catal. Today 2005, 107-108, 68-76.
484
485
(10) Rodrigues, C.S.D.; Madeira, L.M.; Boaventura, R.A.R. Optimization of the azo dye Procion Red
H-486
EXL degradation by Fenton’s reagent using experimental design. J. Hazard. Mater. 2009, 164, 987-994.
487
488
(11) Özdemir, C.; Öden, M.K.; Sahinkaya, S.; Kalipçi, E. Color removal from synthetic textile wastewater
489
by sono-Fenton process. Clean – Soil, Air, Water 2011, 39, 60-67.
490
491
(12) Ramachandran, G.; Kumarasamy, T. Degradation of textile dyeing wastewater by a modified solar
492
photo-Fenton process used steel scrap/H2O2. Clean – Soil, Air, Water 2013, 41, 267-274.
493
494
(13) Lourenço, N.D.; Novais, J.M.; Pinheiro, H.M. Effect of some operational parameters on textile dye
495
biodegradation in a sequential batch reactor. J. Biotechnol. 2001, 89, 163-174.
496
497
(14) You, S.J.; Tseng, D.H.; Ou, S.H.; Chang, W.K. Performance and microbial diversity of a membrane
498
bioreactor treating real textile wastewater. Environ. Technol. 2007, 28, 935-941.
499
500
(15) Mohan, S.V.; Babu, P.S.; Naresh, K.; Velvizhi, G.; Madamwar, D. Acid azo dye remediation in
anoxic-501
aerobic-anoxic microenvironment under periodic discontinuous batch operation: bio-electro kinetics and
502
microbial inventory. Bioresource Technol. 2012, 119, 362-372.
503
504
(16) Meriç, S.; Selçuk, H.; Belgiorno, V. Acute toxicity removal in textile finishing wastewater by Fenton’s
505
oxidation, ozone and coagulation-flocculation processes. Water Res. 2005, 39, 1147-1153.
506
507
(17) Cañizares, P.; Jiménez, C.; Martínez, F.; Rodrigo, M.A.; Sáez, C. The pH as a key parameter in the
508
choice between coagulation and electrocoagulation for the treatment of wastewaters. J. Hazard. Mater.
509
2009, 163, 158-164.
510
511
(18) Pang, Y.L.; Abdullah, A.Z. Current status of textile industry wastewater management and research
512
progress in Malaysia: A review. Clean – Soil, Air, Water 2013, 41, 751-764.
513
514
(19) Papadopoulos, A.E.; Fatta, D.; Loizidou, M. Development and optimization of dark Fenton oxidation
515
for treatment of textile wastewaers with high organic load. J. Hazard. Mater. 2007, 146, 558-563.
516
517
(20) Walling, C. Fenton’s reagent revisited. Accounts Chem. Res. 1975, 8, 125-131.
518
519
(21) Mahvi, A.H. Sequential batch reactor: A promising technology in wastewater treatment, Iranian
520
Journal of Environmental Health Science & Engineering 2008, 5, 79-90.
521
522
(22) Metcalf & Eddy. Wastewater Engineering: Treatment, Disposal and Reuse. 4th Ed., McGraw – Hill,
523
New York, 2003.
524
525
(23) Suresh, S.; Tripathi, R.K.; Rana, M.N.G. Review on treatment of Industrial Wastewater using
526
Sequential batch reactor. International Journal of Science Technology & Management 2011, 2, 64-84.
527
528
(24) EPA, U.S. Wastewater, Techonology Fact Sheet: Sequencing Batch Reactors. U.S. Environmental
529
Prottection Agency, Office of Water, EPA 932-F-99-073, Washington D.C., 1999.
530
531
(25) Rodrigues, C.S.D. ; Boaventura, R.A.R.; Madeira, L.M.P. Combination of coagulation/flocculation
532
and chemical oxidation processes for treating a cotton dyeing wastewater – Comparison of performances
533
and cost analysis. In Proceedings of the Sixteenth International Water Technology Conference, Istanbul,
534
Turkey, 2012, 156-157.
535
536
(26) Peres, J.A.; Heredia, J.B. de; Domínguez, J.R. Integrated Fenton’s reagent – coagulation/flocculation
537
process for the treatment of cork processing wastewaters. J. Hazard. Mater. 2004, 107, 15-121.
538
539
(27) Xing, Z.-P.; Sun, D.-Z. Treatment of antibiotic fermentation wastewater by combined polyferric sulfate
540
coagulation, Fenton and sedimentation process. J. Hazard. Mater. 2009, 168, 1264-1268.
541
542
(28) Perdigon-Melon, J.A.; Carbajo, J.B.; Petre, A.L.; Rosal, R.; Garcia-Calvo, E. Coagulation-Fenton
543
coupled treatment for ecotoxicity reduction in highly polluted industrial wastewater. J. Hazard. Mater.
544
2010, 181, 127-132.
545
546
(29) Oller, I.; Malato, S.; Sánchez-Pérez, J.A. Combination of advanced oxidation process and biological
547
treatments for wastewater decontamination – A review. Sci. Total Environ. 2011, 409, 4141-4156.
548
549
(30) Rodrigues, C.S.D.; Madeira, L.M.; Boaventura, R.A.R. Treatment of textile effluent by chemical
550
(Fenton’s Reagent) and biological (Sequencing batch reactor) oxidation. J. Hazard. Mater. 2009, 172,
551
1551-1559.
552
553
(31) Blanco, J.; Torrades, F.; Varga, M. de la; García-Montaño, J. Fenton and biological-Fenton coupled
554
processes for textile wastewater treatament and reuse. Desalination 2012, 286, 394-399.
555
556
(32) Elmolla, E.S.; Chaudhuri, M. The feasibility of using combined Fenton-SBR for antibiotic wastewater
557
treatment. Desalination 2012, 285, 14-21.
558
559
(33) Sanchis, S.; Polo, A.M.; Tobaja, M.; Rodriguez, J.J.; Mohedano, A.F. Degradation of clorophenoxy
560
herbicides by coupled Fenton and biological oxidation. Chemosphere 2013, 93, 115-122.
561
562
(34) Wu, D.-L.; Wang, W.; Guo, Q.-W.; Shen, Y.-H. Combined Fenton-SBR process for bamboo industry
563
wastewater treatment. Chem. Eng. J. 2013, 214, 278-284.
564
565
(35) Rodrigues, C.S.D.; Madeira, L.M.P.; Boaventura, R.A.R. Treatment of textile dye wastewaters using
566
ferrous sulphate in a chemical coagulation/flocculation process. Environ. Technol. 2012, 34, 719-729.
567
568
(36) Heredia, J.B.; Domínguez, J.R.; Lopez, R. Advanced Oxidation of Cork – Processing Wastewater
569
Using Fenton’s Reagent: Kinetics and Stoichiometry. J. Chem. Technol. Biotechnol. 2004, 79, 407-412.
570
571
(37) Martinez, N.S.S.; Fernandez, J.F.; Segura, X.F.; Ferrer, A.S. Pre – Oxidation of an Extremely Polluted
572
Industrial Wastewater by the Fenton’s Reagent. J. Hazard. Mater. 2003, B 101, 315-322.
573
574
(38) International Organization for Standardization. Water Quality - Determination of the Inhibitory Effect
575
of Water Samples on the Light Emission of Vibrio Fischeri (luminescent Bacteria Test) - Part 3: Method
576
Using Freeze-dried Bacteria, Part 3, 2005.
577
578
(39) Gray, N.F. Biology of wastewater treatment. 2nd Ed., Imperial College Press, London, 2004.
579
580
(40) García-Montaño, J.; Torrades, F.; García-Hortal, J.A.; Domènech, X.; Peral, J. Degradation of Procion
581
Red H-E7B reactive dye by coupling a photo-fenton system with sequencing batch reactor. J. Hazard.
582
Mater. 2006, B134, 220-229.
583
584
(41) Sirianuntapiboon, S.; Chairattanawan, K.; Jungphungsukpanich, S. Some properties of a sequencing
585
batch reactor system for removal of a vat dyes. Bioresource Technol. 2006, 97, 1243-1252.
586
587
(42) Çinar, Ö.; Yaşar, S.; Kertmen, M.; Demiröz, K.; Yigit, N.Ö.; Kitis, M.M. Effect of cycle time on
588
biodegradation of azo dye in sequencing batch reactor. Process Saf. Environ. 2008, 86, 455-460.
589
590
(43) Ramalho, R.S. Introduction to Wastewater Treatment Processes. Academic Press, New York, USA,
591
1997.
592
593
(44) APHA; AWWA; WEF. Standard Methods for the Examination of Water and Wastewater. 20th Ed.,
594
American Public Health Association/American Water Works Association/Water Environment Federation,
595
Washington DC, USA, 1998.
596
597
(45) Annual Book of ASTM Standards, Water; Atmospheric Analysis. Part 23, American Society for
598
Testing and Materials, Philadelphia, 1973.
599
600
(46) Azbar, N.; Yonar, T.; Kestioglu, K. Comparison of various advanced oxidation processes and chemical
601
treatment methods for COD and color removal from a polyester and acetate fiber dyeing effluent.
602
Chemosphere 2004, 55, 35-43.
603
604
(47) Alaton, I.A.; Teksoy, S. Acid Dyebath Effluent Pretreatment Using Fenton’s Reagent: Process
605
Optimization, Reaction Kinetics and Effects on Acute Toxicity. Dyes Pigm. 2007, 73, 31-39.
606
607
(48) Li, J.; Luan, Z.; Yu, L.; Ji, Z. Pretreatment of acrylic fiber manufacturing wastewater by the Fenton
608
process. Desalination 2012, 284, 62-65.
609
610
(49) Wu, H.; Wang, S. Impacts of operating parameters on oxidation-reduction potential and pretreatment
611
efficacy in the pretreatment of printing and dyeing wastewater by Fenton process. J. Hazard. Mater. 2012,
612
243, 86-94.
613
614
(50) Meriç, S.; Selçuk, H.; Belgiorno, V. Acute toxicity removal in textile finishing wastewater by Fenton’s
615
oxidation, ozone and coagulation-flocculation processes. Water Res. 2005, 39, 1147-1153.
616
617
(51) Bali, U.; Karagözoglu, B. Performance comparison of Fenton process, ferric coagulation and
618
H2O2/pyridine/Cu (II) system for decolourization os Remazol Turquoise Blue G-133. Dyes Pigm. 2007,
619
74, 73-80.
620
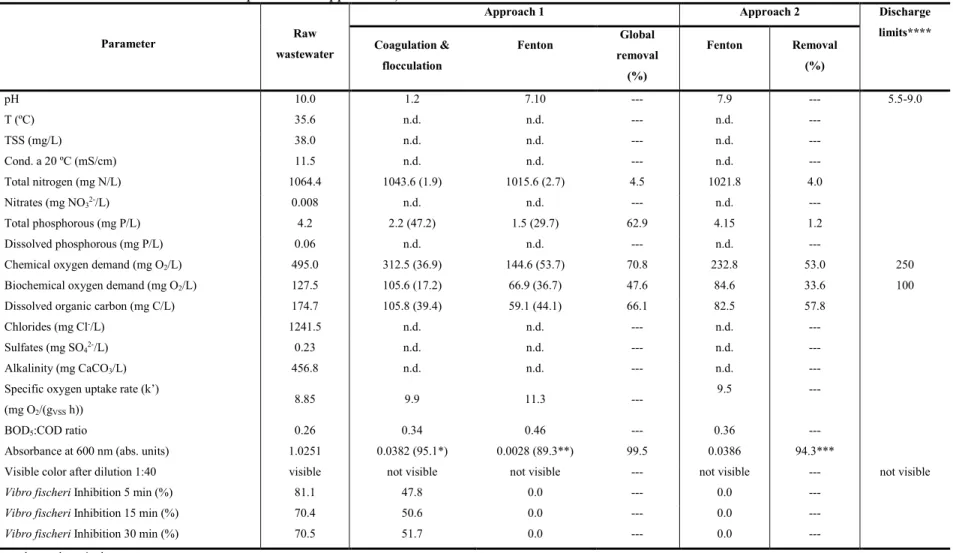
Table 1 - Characteristics of the industrial cotton dyeing wastewater, after coagulation/flocculation and after coagulation/flocculation plus Fenton’s
622
oxidation (Approach 1), after Fenton’s oxidation (Approach 2) and global removals for the combined processes (percent removal efficiencies are
623
given within brackets for each isolated process in Approach 1).
624
Parameter Raw
wastewater
Approach 1 Approach 2 Discharge
limits**** Coagulation & flocculation Fenton Global removal (%) Fenton Removal (%) pH 10.0 1.2 7.10 --- 7.9 --- 5.5-9.0 T (ºC) 35.6 n.d. n.d. --- n.d. --- TSS (mg/L) 38.0 n.d. n.d. --- n.d. --- Cond. a 20 ºC (mS/cm) 11.5 n.d. n.d. --- n.d. --- Total nitrogen (mg N/L) 1064.4 1043.6 (1.9) 1015.6 (2.7) 4.5 1021.8 4.0 Nitrates (mg NO32-/L) 0.008 n.d. n.d. --- n.d. --- Total phosphorous (mg P/L) 4.2 2.2 (47.2) 1.5 (29.7) 62.9 4.15 1.2 Dissolved phosphorous (mg P/L) 0.06 n.d. n.d. --- n.d. ---
Chemical oxygen demand (mg O2/L) 495.0 312.5 (36.9) 144.6 (53.7) 70.8 232.8 53.0 250 Biochemical oxygen demand (mg O2/L) 127.5 105.6 (17.2) 66.9 (36.7) 47.6 84.6 33.6 100 Dissolved organic carbon (mg C/L) 174.7 105.8 (39.4) 59.1 (44.1) 66.1 82.5 57.8
Chlorides (mg Cl-/L) 1241.5 n.d. n.d. --- n.d. ---
Sulfates (mg SO42-/L) 0.23 n.d. n.d. --- n.d. ---
Alkalinity (mg CaCO3/L) 456.8 n.d. n.d. --- n.d. ---
Specific oxygen uptake rate (k’) (mg O2/(gVSS h))
8.85 9.9 11.3 --- 9.5 ---
BOD5:COD ratio 0.26 0.34 0.46 --- 0.36 ---
Absorbance at 600 nm (abs. units) 1.0251 0.0382 (95.1*) 0.0028 (89.3**) 99.5 0.0386 94.3***
Visible color after dilution 1:40 visible not visible not visible --- not visible --- not visible
Vibro fischeri Inhibition 5 min (%) 81.1 47.8 0.0 --- 0.0 ---
Vibro fischeri Inhibition 15 min (%) 70.4 50.6 0.0 --- 0.0 ---
Vibro fischeri Inhibition 30 min (%) 70.5 51.7 0.0 --- 0.0 ---
n.d. – not determined
625
* calculated from the absorbance of real wastewater at pH 9.4 (0.7865 abs. units)
626
** calculated from the absorbance after coagulation/flocculation at pH 3.5 (0.0261 abs. units)
627
*** calculated from the absorbance at pH 3.5 (0.6805 abs. units)
628
**** Ordinance no 423 of June 25, 1997.
629
Table 2 - Characteristics of the cotton dyeing wastewater after Fenton’s oxidation and coagulation/flocculation (Approach 3) and global removal for
630
the combined process (runs #1 to #3 correspond to different dosages of hydrogen peroxide in the Fenton’s stage; percent removal efficiencies are
631
given within brackets for each isolated process).
632
Parameter
Run #1 – 0.625 g H2O2/L Run #2 – 0.938 g H2O2/L Run #3 – 1.25 g H2O2/L Fenton’s oxidation Coagulation & flocculation Global removal (%) Fenton’s oxidation Coagulation & flocculation Global removal (%) Fenton’s oxidation Coagulation & flocculation Global remov al (%) Discharge limit*** pH 1.20 7.0 - 1.25 7.02 - 1.10 7.03 - 5.5-9.0 Chemical oxygen demand (mg O2/L) 347.5 (29.8) 270.0 (22.3) 45.5 292.5 (40.9) 185.0 (36.8) 62.6 260.0 (47.5) 152.5 (41.3) 69.2 250 Biochemical oxygen demand (mg O2/L) 116.3 (8.8) 91.8 (21.1) 28.0 106.4 (16.5) 66.9 (37.1) 47.5 85.3 (33.1) 50.5 (40.8) 60.4 100 Dissolved organic carbon (mg C/L) 124.9 (28.5) 94.9 (24.0) 45.7 98.4 (43.7) 62.2 (36.8) 64.4 82.4 (52.8) 48.3 (41.4) 72.4 - BOD5:COD ratio 0.33 0.34 - 0.36 0.36 - 0.33 0.33 - - Absorbance at λmax (abs. units) 0.0407 (94.0*) 0.0234 (43.2**) 96.6 0.0392 (94.2*) 0.0230 (41.6**) 96.6 0.0387 (94.3*) 0.0233 (40.4**) 96.6 -
Visible color after
dilution 1:40 not visible not visible -
not
visible not visible -
not
visible not visible -
not visible * calculated from the absorbance of wastewater at pH 3.5 (0.6805 abs. units)
633
** calculated from the absorbance after Fenton at pH 5.0 (0.0412, 0.0394 and 0.0391 abs. units for run #1, #2 and #3, respectively)
634
*** Portuguese legislation for discharge of textile wastewaters (Ordinance no 423 of June 25, 1997).
635
Table 3 – Characteristics of the cotton dyeing wastewater after Fenton´s reaction and SBR (Approach 4) and average (last four cycles for SBR)
636
and global removals (respective removal efficiencies are given within brackets for each processes).
637
Parameter
Run #1 – 0.625 g H2O2/L Run #2 – 0.938 g H2O2/L Run #3 – 1.25 g H2O2/L
Discharge limit*** Fenton SBR Global Removal (%) Fenton SBR Global Removal (%) Fenton SBR Global Removal (%) pH 7.12 7.17 --- 7.05 7.15 --- 7.09 7.17 --- 5.5-9.0 Total nitrogen (mg N/L) 1021.8 (4.0) 1005.4 (1.6) 5.5 1021.8 (4.0) 929.1 (9.1) 12.7 1021.8 (4.0) 905.5 (11.4) 14.9 Total phosphorus (mg P/L) 4.2 (1.2) 3.8 (8.4) 9.5 4.2 (1.7) 3.7 (10.4) 11.9 4.2 (1.2) 3.6 (13.3) 14.3 COD (mg O2/L) 346.5 (30.0) 281.8 (18.7) 43.1 294.1 (40.6) 183.3 (37.7) 63.0 232.8 (53.0) 79.2 (66.0) 84.0 250 BOD5 (mg O2/L) 114.2 (10.4) 93.4 (18.2) 26.7 103.4 (18.9) 64.4 (37.7) 49.5 84.7 (32.6) 28.6 (66.2) 77.6 100 DOC (mg C/L) 124.7 (28.5) 103.3 (17.2) 40.8 98.0 (43.8) 61.7 (37.0) 64.6 82.5 (52.7) 28.1 (65.9) 83.9
SOUR – Specific oxygen uptake rate (k’) (mg O2/(gVSS .h))
8.9 n.d. --- 9.1 n.d. --- 9.5 n.d. ---
BOD5:COD ratio 0.33 0.33 --- 0.35 0.35 --- 0.36 0.36 ---
Absorbance at λmax (a.u.)
0.0410 (94.0*) 0.0257 (38.1**) 96.3 0.0393 (94.2*) 0.0240 (39.5**) 96.5 0.0386 (94.3*) 0.0234 (40.0**) 96.6
Visible color after dilution 1:40 not visible not visible --- not visible not visible --- not visible not visible --- not visible
Vibrio fischeri Inhibition 5 min (%) 44.5 n.d. --- 11.0 n.d. --- 0.0 n.d. ---
Vibrio fischeri Inhibition 15 min
(%) 46.7 n.d. --- 23.1 n.d. --- 0.0 n.d. ---
Vibrio fischeri Inhibition 30 min
(%) 49.2 n.d. --- 26.7 n.d. --- 0.0 n.d. ---
n.d. – not determined
638
* calculated from the absorbance at 520 nm of raw wastewater at pH 3.5 (0.6805 abs. units)
639
** calculated from the absorbance at 520 nm of wastewater after Fenton at pH 7.0 ( 0.0415, 0.0397 and 0.0390 abs. units in run #1, #2 and #3, respectively)
640
*** . Ordinance no 423 of June 25, 1997.
641
642
Figures captions
Figure 1 - Schematic diagram of all process configurations adopted.
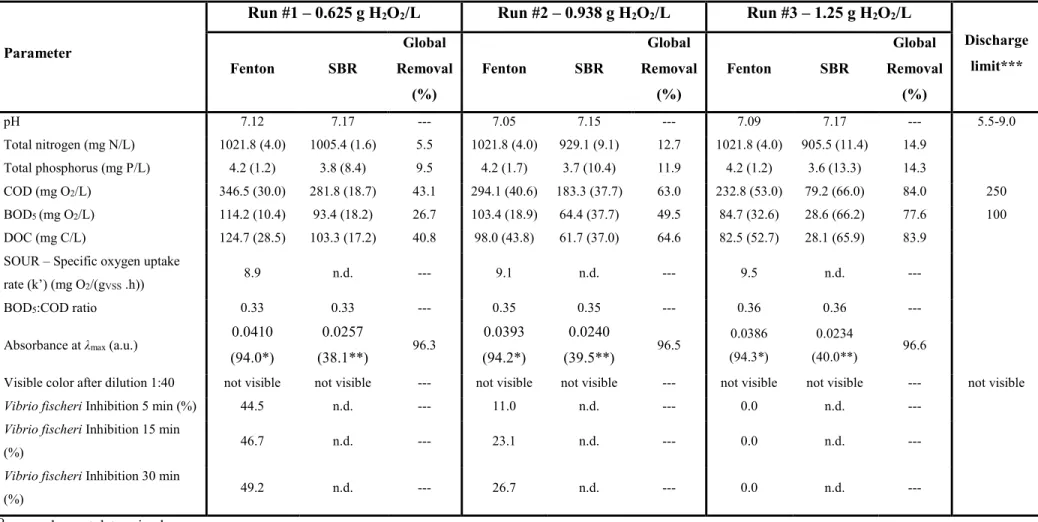
Figure 2 - Effect of H2O2 (a) and Fe2+ (b) concentration on COD, BOD5, DOC and color removals during Fenton’s oxidation (Approach 2) (initial pH=3.5, T=50 ºC and t = 60 min; in a) Fe2+ initial concentration was 300 mg/L while in b) H2O2 dose was 1.25 g/L).
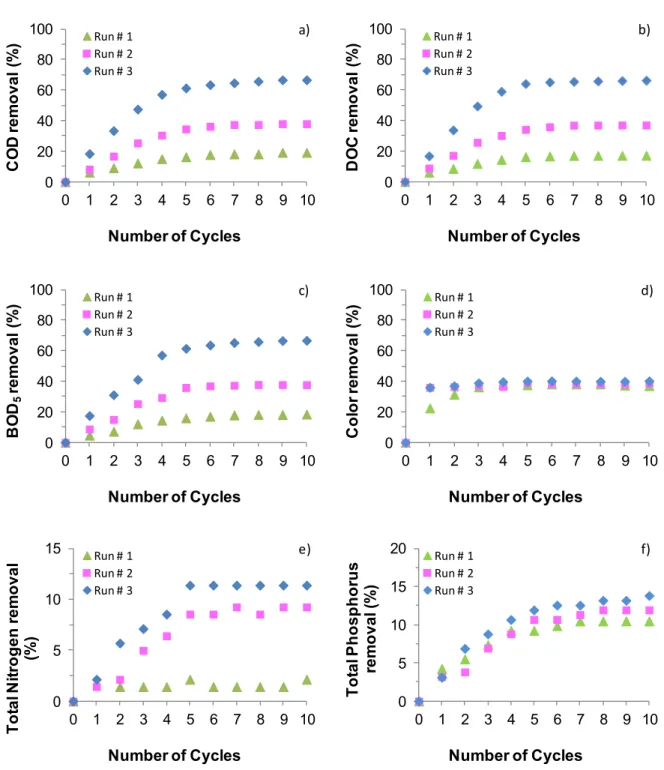
Figure 3 - Variation of COD (a), DOC (b), BOD5 (c), color (d) total nitrogen (e) and total phosphorus (f) removals during 10 cycles of SBR operation, after treatment by Fenton’s oxidation. Runs #3 to #1 refer to employing the Fenton’s stage with progressively decreasing doses of chemicals.
Figure 4 – Operating costs of Fenton alone and Fenton plus SBR for treatment of a real cotton dyeing wastewater.
Figure 1
Approach 1: Coagulation/flocculation followed by Fenton’s reaction Approach 2: Fenton’s oxidation alone
Approach 3: Fenton’s oxidation followed by coagulation/flocculation Approach 4: Integration of Fenton’s oxidation plus SBR Effluent Coagulation/ Flocculation Real Dyeing Wastewater Fenton 200 mg/L Fe2+ 0.5 mg/L Magnafloc 155 98.3 mg/L Fe2+ 500 mg/L H2O2 Effluent Real Dyeing Wastewater Fenton 37.5 or 300 mg/L Fe2+ 0.938 - 10 g/L H2O2 2.5 mg/L Magnafloc 155 Fe2+ H2O2 Effluent Coagulation/ Flocculation Real Dyeing Wastewater Fenton Fe2+ H2O2 Effluent SBR Real Dyeing Wastewater Fenton Run #1: 18.8 mg/L Fe2+ and 0.625 mg/L H 2O2 in Fenton’s oxidation
Run #2: 28.2 mg/L Fe2+ and 0.938 mg/L H2O2 in Fenton’s oxidation
Run #3: 37.5 mg/L Fe2+ and 1.25 mg/L H
2O2 in Fenton’s oxidation
Approaches 3 and 4
Figure 2 0 20 40 60 80 100 0,938 1,250 2,500 5,000 10,000
Remov
a
l
(%
)
[H
2O
2] (g/L)
BOD5 COD DOC color a) 0 20 40 60 80 100 37,5Remov
a
l
(%
)
[Fe
2+] (mg/L)
BOD5 COD DOC Color 300 b)Figure 3
0 20 40 60 80 100 0 1 2 3 4 5 6 7 8 9 10 C O D r e m o v a l (% ) Number of Cycles Run # 1 Run # 2 Run # 3 a) 0 20 40 60 80 100 0 1 2 3 4 5 6 7 8 9 10 D O C r e m o v a l (% ) Number of Cycles Run # 1 Run # 2 Run # 3 b) 0 20 40 60 80 100 0 1 2 3 4 5 6 7 8 9 10 B O D5 re m o v a l (% ) Number of Cycles Run # 1 Run # 2 Run # 3 c) 0 20 40 60 80 100 0 1 2 3 4 5 6 7 8 9 10 C o lo r re m o v a l (% ) Number of Cycles Run # 1 Run # 2 Run # 3 d) 0 5 10 15 0 1 2 3 4 5 6 7 8 9 10 T o ta l N it ro g e n r e m o v a l (% ) Number of Cycles Run # 1 Run # 2 Run # 3 e) 0 5 10 15 20 0 1 2 3 4 5 6 7 8 9 10 T o ta l P h o s p h o ru s re m o v a l ( % ) Number of Cycles Run # 1 Run # 2 Run # 3 f)
Figure 4
0 1 2 3
Fenton Run #1 Run #2 Run #3

![Figure 2 020406080100 0,938 1,250 2,500 5,000 10,000Removal (%) [H 2 O 2 ] (g/L) BOD5CODDOCcolora) 020406080100 37,5Removal (%) [Fe 2+ ] (mg/L) BOD5CODDOCColor300 b)](https://thumb-eu.123doks.com/thumbv2/123dok_br/15589259.1050402/24.918.221.663.150.821/figure-removal-bod-coddoccolora-removal-fe-bod-coddoccolor.webp)