A Work Project, presented as part of the requirements for the
Award of a Masters Degree in Management from the Faculdade
de Economia of Universidade Nova de Lisboa.
(Re)Financing in a Capital Intensive Industry
during Economic Crises
Ricardo Borges Jacinto, nº296
With the supervision of:
Professor Miguel Ferreira
Abstract
This case provides insight regarding how the survival of a company exercising its economic activity on a capital intensive industry, namely Cimpor – Cimentos de Portugal, SGPS, S.A., can be more affected during a financial/economic crisis than companies operating in non transformation sectors. Company performance positively correlated with the market and, the need for large amounts of debt capital required for survival, were key factors whenever a recession were in order. I will explore the factual evidence of such events, providing in the end a space for reflection through a set of questions concerning the approached subjects.
Keywords: Subprime Crises, Financial Indebtedness, Intensive Capital Industry, Debt Rating, Debt Snowball
Section I. Environmental Constraints………...…1
Section II. Firm History and Debt Profile..………...…...3
Section III. Debt Management at Cimpor………...….7
Section IV. Snow Ball financial planning strategies………...…...12
Section IV. Snow Ball financial planning strategies………...…...12
Section V. Investment Grade Maintenance………...………...…...16
Section VI. Requests and compliance………...……...………...18
Section VII. A hard road yet to be traveled ahead..…...……...………...…...22
Section VIII. Questions..…...……...………..………...….24
Section IX. References..…...……...………..…..…………...…...25
Section X. References..…...……...………..………...…...26
I.
Environment constraints
Since 1976, banks had been the primary source of external capital for CIMPOR – Cimentos de Portugal, SGPS, S.A. (Cimpor). With the increasing degree of openness over financial markets, on 2003 Cimpor started sourcing for capital outside the banking sector.
Acquiring credit has always been subject to dynamic relations between creditors and the borrower. Due to the irreversible nature of the investments undertaken by this cement mid size player, evaluating firm’s ability to fulfill contract obligations had been a subject to meticulous evaluation by lending institutions, until credit rating agencies reputational buildup. Until 2009, which shall be used as reference period for the case, debt ratings provided by rating agencies often justified no further use of bank’s own risk measurement models.
This evidence became even more acute upon the opening of the national banking sector to foreign bank institutions during the 1990’s. Access to foreign lenders by Cimpor had led the firm to build up relationships with those entities, as they were representing a brand new offer of much competitive products.
On implementing an internationalization strategy, external capital had been of the utmost importance for Cimpor’s growth and development. This way, liabilities became increasingly pushing weight over company’s operations and activities by capitalizing a large part of the left side of its balance sheet and eroding therefore, a large part of revenues.
With such encumbering, credit risk management decisions undertaken by the Area of Financial Operations (AOF) had constantly been subject to a dynamic set of management practices, all in line with firm’s main objective of shareholder value maximization.
By 2008, Cimpor had outstanding EUR 1.911 million long term financial debt. According to risk management practices for debt instrument diversification undertaken by the firm’s management team, debt was dispersed though various different facilities, most of them undertaken between 2003 and 2008. Amongst concomitant implications involving debt contraction, major maturities implied repayment over the next 3 years following 2009.
It was clear that financing and refinancing contracts until 2007 had been eased on encumbering costs, by business’s healthiness and expanding economic environmental. However, the credit crunch of 2007-2008 started affecting banks and firms surrounding the bank balance crisis. This trust crisis was by 2009 beginning limiting firm’s access to buyers’ credit as banks, pension funds, fixed income investors, among others were starting to back down on refinancing agreements over firm’s building maturities.
Providing that such behavior could be only the tip of the crisis iceberg, restructuring long term goals appeared to be a comprehensible agenda as with default avoidance, a need of cash allocation from investment to financing activities became evident.
With an increase over the firm’s cost of capital, many of the positive Net Present Value (NPV) projects were at the verge of being reversed to negative figures. Regardless of that, Cimpor management team were still believing in the fruit yet to be collected from a sudden exponential burst of employed capital undertaken since 2003.
Shareholders opinions were already diverging and, in line with Chava and Purnanandam (2008)2, a valuation loss over Cimpor’s equity was taking place. According to the authors, during a financial and economic crisis sustaining major credit supply shocks, such loss can be mainly traced to the association of bank-dependent firms such as Cimpor to banks that see their internal health damaged by massive losses traced back to substantial defaulting on outstanding balance loans.
High systematic risk exposure associated with such unleavened net debt balance and also with the closing of financial covenants disclosed over most important contracts, Standard and Poor’s rating agency (S&Ps) undertook a downgrade action over Cimpor’s long term obligations. As the above mentioned contracts included interest rate indexation with S&Ps long term credit rating, an irrational set of conditions worsening was occurring. Cimpor had relevant international credit rating solely provided by S&Ps.
Along with public investment, Cimpor was being led to a dramatic set of action having as basis significant cuts on investment and CAPEX. With firm’s decaying liquidity, two possible outcomes were expected. The positive one involved economic recovery based on the possibility of a new restructured state plan based on the American New Deal assumptions, returning this way firm’s bargaining margins over contract renegotiations to high standards. The remaining possibility involved either asset sales for contractual obligations fulfillment or, a capital increase that, given the depreciated financial position of its major shareholders, could probably be feasible of being undertaken by solely one of those same entities, namely Caixa Geral de Depósitos, S.A. (CGD) or, by any new player becoming shareholder of the firm.
At the beginning of 2009 Cimpor was being obliged to overcome the already abominable snowman of pushed forward financing outflows. Re-establishing creditors’ confidence through guarantee deed contracts for business-risk to bank-risk transfer and, S&Ps further downgrade avoidance either through contract renegotiations or liquidity increase was on top of agenda for financial management team. As banking credit was drying especially that
supplied by foreign financial institutions, the possibility favoring debt emissions over financial markets on the long/medium range was an option, as denoted by Lim (2003)11. Regardless on the effectiveness of those measures, Cimpor had to offset those challenges if it were to return to the high yields of returns to investor growth pattern displayed over the seven years preceding 2009.
II.
Firm History and Debt Profile
Cimpor has been operating in the capital intensive cement industry since 1976, being on the beginning of 2009 the Portugal national market leader of the cement, concrete and aggregates sector. Its international growth and development strategy made it present on the reference period over 13 different markets, dispersed among 4 different continents as can be seen in Figure A1. During this period, Cimpor was on an exponential phase of its expansion.
The need for external financing by this company had been as constant as its margins for 5 consecutive years, with an average return on equity of 18,8% between 2002 and 2007, and an average debt to equity ratio of 1,72 for the same period. Table B1 and Table B1.1 summarize in average, financial data for Cimpor between 2002 and 2008.
Being considered a known company in the sector by 2009 spring semester, Cimpor was positioned on the eight place of the best world performers regarding installed capacity, right bellow players such as Cemex SAB de CV (Cemex), Lafarge Ciments S.A. (Lafarge) and Holcim Ltd. (Holcim).
Cimpor’s leveraging profile were directly associated to investment pattern. The grounds behind strategic prospects for long term growth were supported by a constant market consolidation environment, implying as rules of engagement intensive capital growth by acquisition financed by buyers’ credit and own capital. With that in mind, Cimpor had on the reference period prospects for reaching 5% growth capacity until 2012. With a solid and liquid base of credit between 2002 and 2008, the firm had consecutively been able to pay off its obligations towards shareholders through growing cash dividend yield observable in Figure A2.
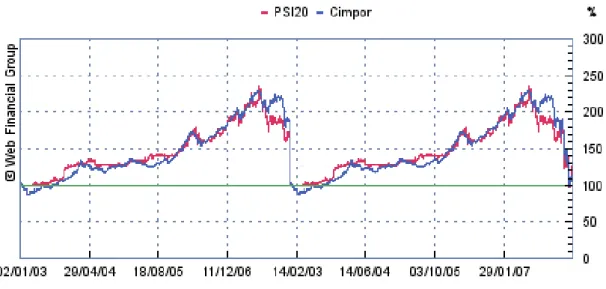
Since mid 2007, a downward spiral of investors trust over Cimpor’s performance can be depicted from the 672.000.000 outstanding shares of stock quotation behavior, observable in Figure A3. A peak value had taken place on the second semester of 2007, followed by downward spiral until reaching minimal values.
For an improved insight over market conditions depreciation starting on the above mentioned year, Figure A4 demonstrates not only the market behavior, but also the positive correlation that it has with the firm. Then, it can be said that Cimpor’s market share was not dependent on marketing strategies, but instead on a process of market consolidation through acquisition of local assets for production and distribution of the final product. This especially since the cement producer had no room for much product innovation, relying hence on its ability to acquire smaller local players, and also to avoid being acquired by larger players.
All over the 1990’s, companies began to source more actively for foreign debt supplied by international players new to the national banking sector. Those entities approached companies with offerings for competitive credit products that implied increasingly more competitive terms than those offered by national entities at the time. Being Cimpor already on that period an important player at national level, it also started seeking foreign credit in order to finance its strategic goals.
Table 1. Cimpor outstanding liabilities structure by 2007 and 2008 (Monetary values in thousands of Euros)
2008 2007 Change
Long Term Liabilities:
Bonds 883.055 855.939 3,07%
Bank Loans 1.028.075 467.993 119,68%
Other Loans - 315 -100%
1.911.130 1.324.247 44,32%
Short Term Liabilities:
Bank Loans 201.177 623.142 -67,72%
Other Loans 324 340 -4,71%
201.401 623.482 -67,70%
2.112.631 1.947.729 8,47%
Source: Cimpor 2008 annual report4; Company documentation5
Financial markets globalization efforts also brought new options in terms of corporate bonds. With access to recent fast growing international and foreign fixed income markets issuing a demand for longer maturity investor class products than those offered by banks, ever since 2003 Cimpor had taken steps towards corporate bond issuance, seeking external financing on public and private markets.
At the beginning 2009, firm’s debt structure was composed mainly by an instruments mix ranging from credit supplied from banks to bond instruments. Major creditors and debt holders were Banks, Insurance Companies, Fund Managers, Pension Funds. Total liabilities outstanding on the Firm’s balance sheet of the 2008 annual consolidated report are disclosed on Table 1 above and Table B2. Total debt with a book value of nearly EUR 2.112.million was divided through EUR 201 million short term liabilities, and EUR 1.911 million long term debt capital.
According to the risk management policies undertaken by firm’s financial managers, the above total debt was divided among several outstanding debt instruments displayed in Figure 1 bellow. At the end of 2008, 52% of total debt was Bank Loans leaving the remaining 46% and 2 % to 3 fixed income instruments and issued commercial paper respectively.
Figure 1 Major instruments composing Cimpor’s total outstanding debt between 2002 and 2008
Source: Cimpor 2002 - 2008 annual reports4; Company documentation5
Short term financing were usually resourced though overdrafts, commercial paper and short term bank loans, though commercial paper and overdrafts could be considered rolling instruments.
Other means of raising capital or improving the use of debt funding implicated firm’s access to derivative instruments. With options ranging from warrants, convertible debt, and so on, Cimpor could had managed to create a much more exotic instrument mix rendering through this way better and increasingly complex terms for either new or renegotiated credit.
Despite that, Cimpor did not have in its portfolio derivate facilities such as convertible bonds, for the obvious reasons concomitant with its shareholder’s protection policy.
During the reference period, despite having only three fixed income instruments outstanding, those nearly represented 46% of Cimpor’s outstanding debt. Regardless of such figures on 2008, that had not always been the frame, as can be observed on Figure 2 bellow.
Figure 2. Percentage decomposition of Cimpor's outstanding long term debt between Corporate Bonds and Bank Loans from 2002 until 2008
Source: Cimpor 2002 - 2008 annual reports4; Company documentation5
For further digging regarding this matter, Table 2 bellow displays detailed information concerning firm’s major Long Term debt instruments face values. Tables B3, B3.1 and B3.2 display accrued values of firm’s debt between 2002 and 2008.
Table 2. Cimpor's 2008 end outstanding long term debt face values (Monetary values in thousands of Euros)
*Exchange rate used for converting USD to EUR of 1,1720 retrieved on 26.JUN.2008 **European Investment Bank
***Santander&Totta
Bond debt value concentration had arisen mainly due to the common procedure for selling corporate bonds involving market best effort, usually mediated by banking institutions. This last permissive made emissions under EUR 500 million most of the times unreliable and unprofitable for these intermediaries, as commissions usually involved a percentage over face value being negotiated.
At the beginning of 2009, given the decline in business performance, firm’s financial managers concerns were mainly directed towards the EUR 600 million Eurobonds bullet repayment on 2011 and also, towards the EUR 300 million Bilateral Loan with a similar repayment method to take place on the year of 2010.
Justifying debt values presented by Cimpor’s 2008 annual report were the expansive strategic financing requirements that the firm had by that time. Being Cimpor a company operating in a capital intensive industry, acquisition of assets such cement plants, investments considered has being most of the times irreversible, required injections of capital in the order of the hundreds of millions of Euros.
Cimpor never resourced to stock issuance as a financing method. Given that at the beginning of 2009, major investor’s structure, displayed on Figure A5, were already suffering from firm’s depreciated incomes compared to previous years, requesting capital increases was considered an unreliable option, considering shareholder protection policy.
Debt was and had been therefore, the main and only source of external capital, starting the firm on 2003 to diversify its sources from 100% bank loans provided either by commercial or non commercial banking institutions. The main question for firm’s financial managers since that year had been which type instrument to use.
III.
Debt Management at Cimpor
Company’s interest on issuance of corporate bonds on either public or private equity markets came mainly from the terms that such contracts implied. In contrast to Bank Loans, Fixed Income contracts had longer term maturities, usually not shorter than 5 years, any S&Ps rating indexation, less restrictive covenants, fixed coupons and full principal repayment at maturity.
The comparable higher maturities coming at higher interest rate yields were very attractive to the firm given that one other characteristic of investments in the cement, concrete and aggregates sector, was the implication of having payback periods much higher than the
common 5 years demanded by investors on other industries. Eurobonds solely represented a tax advantage for the firm, as this type of facilities was issued without withholding tax.
Book building and benchmark practices characterized the bond pricing process, being Cimpor’s emissions commonly compared to other emissions issued either by the firm or by companies sharing similar conditions to those faced by the firm. A disadvantage posed by these securities usually came from the issuer being the seller and not the client, which usually carried less room for trade margin over expensive negotiations.
On 2003, Cimpor had issued 2 different tranches of US Private Placements securities (USPPs), therefore not subject to US Securities Exchange Commission (SEC) regulation, yielding at different maturities, coupons and durations. The issuance took place in the transatlantic market in accordance with a debt instrument diversification strategy underling company’s risk and financing cost management policies.
Being Cimpor an international company, Cimpor Financial Operations B.V. (Cimpor BV) had been created by the Group with the sole responsibility of the Corporate Bond issuance. For more information regarding the Group organizational structure, please see Annex I located in Appendix C.
Another subject arising from having international presence was the need for contracting debt in different currencies, as can be observed in Table B4, carrying these instruments therefore, an added currency risk.
Despite very constrictive, debt contracts had room for planning flexibility, in respect to market expectations and its relation with cost planning.
Usually, long term contracted liabilities, regardless of their nature, had clauses stating that interest payments could be changed from a biannual basis to a quarterly or even monthly one. Though this way, the firm could use to its advantage market expectations in order to minimize financing costs associated to floating interest rate instruments. However, with more frequent payments, added trade commission disbursement per periodic payments would come. Taking the above tradeoff into consideration, on the referenced period, the interest payment schedule for Cimpor’s long term major liabilities was distributed through annual, semiannual and monthly payments.
Floating interest rates were mostly associated to Bank Loan contracts, being usually the result of summing a floating index, to a contracted fixed Spread. On Cimpor’s debt portfolio outstanding at 2009 beginning, the main index accounting for such calculation were Euribor, whose variations can be seen in Figure A6.
On the above period, the company had in its debt balance two bilateral contracts, being them the Bilateral Loan S.T., contracted for refinance purposes only and, the EIB loan contracted with the aim of of financing a specific project. Both contracts had on one side one lender and, on the other side, one single borrower. Club Deals were usually characterized by being loans where either one single borrower or, several borrowers being joint liable towards the lenders, received financing from 2 to 3 different lenders sharing the same risk amongst them, distributed by equal tranches of the face value of the loan. Other types of loans usually contracted by the firm were Syndicated, where between to 10 to 30 lenders shared the risk of lending the necessary capital by equal or not amounts of capital. Despite on the reference period not having any of these type of facility outstanding, the firm had issued such contracts on the past, having one of them the imposing of a rating trigger clause. This term implied that in the advent of Cimpor crossing the investment grade barrier, an immediate full repayment of capital plus accrued interest would had to take place.
Besides the already mentioned main differences between contracted debt and issued debt, credit supply availability made Cimpor a Bank Dependent since 1976. Given that the firm resourced mostly to commercial Bank institutions, pricing competition had resulted on lower spreads over supplied interest rates. However, with 2008’s, credit crunch, banks intended to preserve their balances. With such trend, Cimpor management team was already considering a new issuance to be undertaken on 2010 aiming to refinance the EUR 300M Bilateral ST. With extensive written contracts, bank loans were often subject to protecting covenants, aiming to preserve firm’s ability to repay owned capital, being one example, the Negative Pledge clause present in almost all major contracts.
Cash needed to be available on interest and principal payment dates, otherwise an indemnity had to be paid and, on most contracts, default would be declared. Refinancing those contracts upon technical default could be very problematic for the firm since, as stated by Chava and Roberts (2008)3, a decrease in cash allocated to investment, undermining the strategic expansive objectives for the firm and delivering great debt costs escalations and possible control hand over to creditor entities, was a probable outcome at the event of default. The evidence became more acute when the authors revealed that whilst relations where quite superficial between lender and borrower, such problems could go sky-high, implicating almost complete cease of investing activities in order to produce a correct allocation of cash to debt repayment requirements. Therefore, good relations between borrower and lender were one top priority for the firm seeing its bargaining power over
negotiations constantly being further depreciated given the credit supply crunch raised by the trust crisis. Ability to influence lenders perspectives regarding firm’s ability to repay its obligations was of the utmost importance, and given that debt holders usually were well informed, knowing well their expectations could be regarded as an advantage for Cimpor effectively achieving competitive outcomes from such negotiations.
Financial planning was then crucial for the firm’s healthiness, implying thorough calculations of future expenses associated to financial leverage.
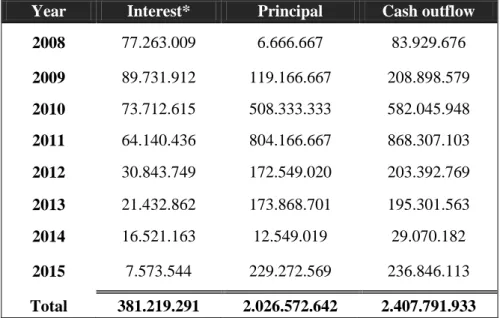
Table 3. Cash outflows from major debt instruments outstanding on 2009, scheduled from 2008 until 2015
(Monetary values in thousands of Euros)
Year Interest* Principal Cash outflow
2008 77.263.009 6.666.667 83.929.676 2009 89.731.912 119.166.667 208.898.579 2010 73.712.615 508.333.333 582.045.948 2011 64.140.436 804.166.667 868.307.103 2012 30.843.749 172.549.020 203.392.769 2013 21.432.862 173.868.701 195.301.563 2014 16.521.163 12.549.019 29.070.182 2015 7.573.544 229.272.569 236.846.113 Total 381.219.291 2.026.572.642 2.407.791.933
*Interest rates used for computing future interest payments resourced from forward rates supplied by Cimpor on April, 2009
Source: Cimpor 2008 Annual report4; Company documentation5
On the reference period, Cimpor had so far been able to balance its financial expense accounts with its EBITDA margins, as displayed on Figure A7. With those figures always higher than 25%, along with an increasingly relatively constant financial expense pattern and interest coverage ratios over 4,57x, business healthiness had been proved over and over.
Debt coverage ratio variations were mainly justified by contract terms agreed for capital amortization and interest schedules.
By associating this evidence of an apparent dynamic financial planning, either with the contractive economic consequences over yearly marginal generated EBITDA, and also with
the figures disclosed over data transferred from Table 3 above to Figure 3 bellow, firm’s managers started to realize a problem that had been constantly growing under the radar.
Figure 3. Cimpor cash outflows associated to outstanding long term debt facilities principal repayment between 2008 and 2015
Source: Company reports5
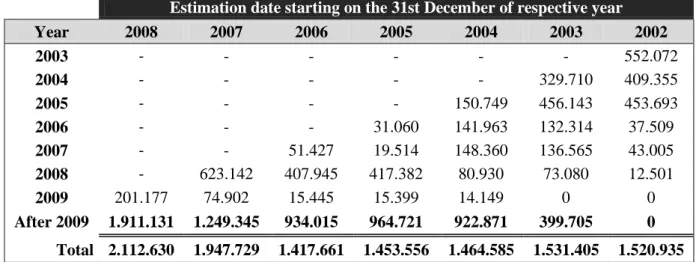
Having in mind that capital intensive investments had been undertaken on a basis that EBITDA generated from acquired capacity would compensate added financing costs from increased, consecutive financing had been being raised between 2002 and 2008 by the firm’s managers. Table 4 bellow captures those expectations through a demonstration of an exponential growth on amounts due on years following 2009, since 2002.
The main problems being faced by the firm on the beginning of 2009 where considered by management team as resulting from a combination of past blurred market expectations that failed to predict the abrupt market downturn.
Table 4. Principal repayment scheduled from 2002 until and after 2009, on the 31st December of each year between 2002 and 2008
(Monetary values in thousands of Euros)
Estimation date starting on the 31st December of respective year
Year 2008 2007 2006 2005 2004 2003 2002 2003 - - - 552.072 2004 - - - 329.710 409.355 2005 - - - - 150.749 456.143 453.693 2006 - - - 31.060 141.963 132.314 37.509 2007 - - 51.427 19.514 148.360 136.565 43.005 2008 - 623.142 407.945 417.382 80.930 73.080 12.501 2009 201.177 74.902 15.445 15.399 14.149 0 0 After 2009 1.911.131 1.249.345 934.015 964.721 922.871 399.705 0 Total 2.112.630 1.947.729 1.417.661 1.453.556 1.464.585 1.531.405 1.520.935
The irrational exuberance felt between 2002 and 2007 raised from an economic boom might had led managers all over the world to a belief where the golden egg chicken would endure for unforeseeable consecutive future periods, in a form of constant EBITDA margins increase, along with low spreads allocated to financing capital. Regardless of its origin being synthesized from a clouded but unavoidable human judgment and concomitant perspective, in periods of abundance Cimpor’s tendency from operating on a consolidative market basis was to use as an advantage the excess supply felt over the credit market to achieve better credit conditions for its expansion. However, as the firm intended to keep growing until its terminus, investment opportunities on the cement sector tended to be undertaken based on a competitive perspective of capacity increase for market capture. Hence, push-forwarding capital repayment for proper cash allocation to investment activity might have missed the premise that grains of obligations kicked to the future might had ended up filling the golden chicken’s stomach on the future, especially if it were to suffer from an economic/financial indigestion.
IV.
Snow Ball financial planning strategies
The cement industry, regardless of the different strategic plans adopted by its players (Greenfields Vs Growth by Acquisition), had always required huge loads of capital injections. Cimpor’s yearly capital employed in its businesses between 2002 and 2008 had kept increasing over the period, culminating with an Indian market entry. For a good insight over the strategic pattern of decisions involving investment, maintenance and financing undertaken by the firm, Figure A8 displays the main figures by whose those are reflected.
When comparing variations on capital employed and cash outflows from investment with generated operational revenue variations, there is an apparent deficit.
Cross referencing this set of data with the debt contraction profile had led firm’s financial managers to uncovering an active problem requiring immediate action to be undertaken by firm’s executives. Following EBITDA evolutionary trend, realistic forecasts were indicating that there would be not enough capital available by 2011 for complying with all financing obligations for that year, which would be a common situation for the mid size player if not so entrapped by a recessive economic environment. Figure 4 bellow displays the Cross Default Swaps (CDSs) traded over Cimpor’s major and larger competitors Holcim and Lafarge at values of approximately 600 basis points (bp), and Heidelberger Cement A.G (Heildelberger) above the 4000 bp bracket were reflecting investors’ perspectives.
A dynamic financial planning concerning financial liabilities portfolio had been accommodated by firm’s financial management team, combining contracted maturities ranging from 3 to 12 years, with the aim of establishing a best payment schedule. Despite the advantages posed by such dynamic allocation, a debt snowball peaking already on 2 years following 2009 intrinsically linked to the strategic congruence of the firm had been raised that, would had remained unnoticed if economy expansion continued.
Figure 4. Holcim and Lafarge CDS quotations on April 2009
Source: Bloomberg
As already seen, because payback periods over the firm’s projects were usually greater than 5 years, Cimpor often sourced for facilities providing longer maturities.
Such rational behind maturity scheduling were considered as being good, providing that debt instruments comprising large bullet payments on maturities lower than 5 years were neither contracted nor issued on the meantime. Because Cimpor had contracted long term liabilities on dates already close to the bullet repayment of the Eurobonds, it saw its financial outflow forecasts for the year 2011 escalate to figures higher than EUR 800 million. Taking into consideration EBITDA generated on 2008, and given that investment pattern of the last years preceding 2009 beginning were expected not to change due to a set of new investments that were already planned for that year, a 2008 year marked by a credit supply crunch did not made management team back down while considering the challenge of going to the credit market in order to contract or refinance maturities at excruciating costs of debt.
Such problem might have not entirely been due to management indulgence regarding these matters. As the capital markets demand, players who survive are those who are better equipped to sustained heavy and intensive muscle load without suffering from cramps. In this industry specifically, timely debt cost allocation to the future, either by refinances or bullet contracts arose from the firm’s growth model. Because growth objectives required asset acquisition, the firm required further debt in order to finance its growth and avoid being acquired. Therefore, planning to use revenues generated from such investments to cover costs associated to financing where the roll margin serving as base for financial planning.
Whenever repayment was close to EBITDA generated, postponing expenditure effectuation was then the main option for the firm. As a consequence, bullet payments, as also debt costs, instead of being eliminated, were added to subsequent periods. While the market is booming, usually refinancing outstanding contracts were granted at competitive yields, such as the example of the Bilateral Loan S.T. contracted with a face value of EUR 392 million on 2005, refinanced on 2008 with a maturity of 2 years and a floating rate of Euribor plus a fixed Spread indexed to long term S&Ps credit rating, observable on Table 5 bellow.
Table 5. Cimpor major contracts indexed spread tables on 2008
Club Deal 1 (280 M) Club Deal 2 (225 M) Club Deal 3 (200 M) Bilateral ST 300 M
Rating BBB BBB- BB+ BBB BBB- BB+ BBB BBB- BB+ BBB BBB- BB+ Spread 0,28% 0,30% 0,60% 0,75% 0,95% 1,45% 0,28% 0,30% 0,60% 0,55% 0,85% 0,85%
Source: Cimpor loan contracts4; Company documentation5
On 2008, creditors were already demonstrating risk aversive behavior, leading maturities for the refinancing contracts become shorter. That was the case for the Bilateral Loan ST refinancing on 2008, which was renegotiated for a term of only 2 years. By analyzing Figure 5 bellow, it is possible to see the debt cake fermenting its maturities and face value over time as expansion proceeded at the cost of issued and contracted debt.
Over betting on uncertain outcomes can lead to off chart results, on both ends of the chart. This fact becomes even more important when considering investments in emergent economies. When compared to the currency by which the company reported its results, distributed its cash dividends and paid its major debt obligations (Euro), emerging market currencies were usually not only weaker, which would represent an advantage if the product manufactured at discount were not inevitably sold on a local basis, but also were subject to outside risk factors such as periodic hyperinflation, political, social and so on and so forth.
Proportional to company expansion, the apparent 10-12 years long term maturities accounting for less than 500 million Euros over company’s total debt portfolio on 2002 observed on Table 4, had slowly kept growing until reaching in 2008 nearly 2.000 million Euros in not so longer maturities. This evidence directly reflects an antagonistic effect deriving from the snow ball. As the company decreased its systematic risk through geographic diversification, because it often resourced to debt for meeting expansion requirements, credit risk had been raised on a similar amount.
Figure 5. Cimpor snowball effect over debt amounts and maturities (Exchange rate used for converting USD to EUR on the USPP instruments retrieved on issuance date)
Source: Cimpor Annual Reports 2002-20084;Company documentation5
So, in resume, what started to be a business facing the risk of cement consumption slow down, turned out on the beginning of 2009 to be a business comprising a large debt snowman of more than EUR 2.000 million raised from continually procrastinated aggregated debt expenses, already with a life of its own as banks, the main source of firms credit, were displaying signs of increased bargaining power when compared to 2002.
Comparing Cimpor’s behavior with that of its major competitors Lafarge and Holcim framed in Figure A9, an establishment of the difference between Holcim’s consolidative organic growth supplied by firm’s own generated capital and growth by acquisition at the debt expense growth model undertaken by Cimpor and its relatively much larger player Lafarge can be inferred. Due to the intrinsic characteristic of the cement industry, for the juvenile player Cimpor, growth by acquisition and concomitant debt contraction was regarded as an inevitable outcome. However such growth did not required to be undertaken all at the same time with no time to breath between each market opportunity. When looking at evidence displaying indebtedness over firm’s actual capacity, managers were considering at that period, allocating retained earnings to principal amortization. Being Cimpor a company directed towards yearly dividend distribution, such outcome were being hardly accepted by financially fragile stock holders.
Regardless of the apparent harm, contracting debt right before economic peaks could also be an advantage for the player. On 2008 first half, with an expectant bullish market, Interbank offering rates escalation had pushed spreads to its lowest levels. On the limit, floating debt contracted on the top of the peak would come with the lowest possible spreads offered on the CDSs market, during that economic cycle. With a sudden fall on the market prospective trend, those same spreads escalated almost 1000% from 50 bp to nearly 500bp, meaning that floating rates contracted on 2008 with 27,5 bp, 55bp and 75bp with long term maturities were actually posing an advantage during the credit crunch, discrediting the snow ball menace.
However, creditors were aware of such matters and in order to offset this matter, there was usually a clause stating an interest rate revision date where, if no agreement were to be achieved, immediate repayment were to take place. With the possibility of a further downgrade over firm’s long term debt capital by this rating agency, financial management team were evaluating the consequences that would arise from refinancing the contracts maturing with bullet payments on 2010 and 2011, questioning themselves whether a Budyko effect was or was not already in motion.
V.
Investment grade Maintenance
With an S&Ps long term credit rating of BBB+ on 2000, the firm saw with regard on February 2009, reaching the lowest investment grade rank of BBB- staying on CreditWatch
with negative implications until 8th of May 2009, date where the rating agency would decide whether to left the classification unchanged, or to appoint a further downgrade.
Low liquidity at Cimpor and Cimpor Inversiones level, where major long term liabilities were concentrated, along with inexistent signs of recovery on the constructions sector, S&Ps which were not concerned with the liquid situation of other than the core Portugal and Spain business units, moved forward with a downgrade over company’s long term debt rating from BBB to BBB-. Depreciated EBITDA generation associated with high volumes of debt outstanding on firm’s balance was the main reason behind the decision. Unexpected financial turn of events over banking sector had putted Cimpor’s competition on the same boat, all suffering similar downgrades as disclosed in Table 6 bellow.
CreditWatch with negative implications implicated the possibility of a further downgrade to BB+ (investment grade loss) occurring. This was a very soaring paradox.
If S&P were to undertake the decision of removing investment grade status from Cimpor’s, it would be because the firm was presenting a depreciated financial position. The illogicality on that is that one of the main causes for the firm having its liquid financial position depreciated arose from the previous downgrade from BBB to BBB-. Following the reasoning, upon investment grade loss, this position would be even more depreciated, with costs of debt almost doubling in some cases, which according to this pattern of action, would lead to another placement on Credit Watch with negative implications.
Table 6. S&P debt ratings for Cimpor and its main competitors between 2002 and 2009 spring semester
2009 2008 2007 2006 2005 2004 2003 2002
CIMPOR -Cimentos de
Portugal, SGPS, S.A. BBB- BBB BBB BBB BBB BBB BBB+ BBB+ Holcim Ltd. BBB BBB+ BBB+ BBB+ BBB+ BBB+ BBB+ BBB+ Lafarge Ciments S.A. BBB- BBB BBB BBB BBB BBB BBB BBB
Cemex SAB de CV BB+ BBB- BBB BBB BBB- BBB- BBB- BBB-
Source: Bloomberg
One other inconsistency could be found on the rating system. In order to keep the rating unchanged upon Credit Watch removal, the firm had to renegotiate some of its outstanding contract covenants, meaning that besides the escalated costs arising from the BBB to BBB- downgrade, more costs would be added or aggravated from such renegotiations. The controversial matter here is that, despite the liquid situation becoming
even more degraded than it was before, according to S&P criteria, the risk profile of Cimpor’s long term debt would be allayed, leading to the desired negative implications removal and leaving the rating unchanged along with decreased liquidity.
With aggravating consequences coming from the fact that the firm were at the verge of becoming junk bond grade, compliance with S&Ps requirements were mandatory at that time.
VI.
Requests and compliance
The first demand made by S&Ps concerned the liquid situation of the holding solely. Cimpor’s Brazilian business unit hold in its possession an Austrian treasury bills note purchase worth of about 119 million Euros contracted for tax benefit purposes. Despite being a natural cash generator by that time, which can be verified on Figure 6 bellow, and also in greater detail on Table B5, cash positions and short term credit lines associated to the Brazilian business unit were not taken into consideration for the calculation of short term financial position borrower.
Figure 6. Cimpor business units’ contributions to Group generated EBITDA between 2002 and 2008
Source: Cimpor 2002-2008 Annual Reports4; Company documentation5
Taking that into consideration, one of the firm’s management main goals was to find a way of transferring liquidity packages from its subsidiaries, directly to the debt core.
One of the main factors contributing for the firm’s illiquid profile came from an acquisition performed on Spanish soil, aimed to increase storage capacity on the Canaries
Islands for a large amount of a cement intermediary product already produced and stored, which were beginning to depreciate through unsustainable warehousing.
With the forecasts of OECD by 2008 end predicting an economic contraction in the Euro zone of approximately 3,2%, added exposure to Spanish risk had made S&Ps very resilient over Cimpor’s country risk exposure and future EBITDA.
Going against S&P advice, this acquisition took place on the 31st December of 2008, leading to a frame where no EBITDA was generated from the acquisition on accounts closing date, having only liabilities outstanding in its balance sheet. In order to offset this problematic accounting unbalance, a pro-forma EBITDA representing EBITDA generated during the year of acquisition by the previous owner, was transacted to the buyer’s sheet in the form of this special account created uniquely for such purpose. For liquidity assessment by S&Ps and before going forward with its decision, the pro-forma EBITDA also respective to Indian and Chinese acquisitions were added to the liquid situation of the Group.
Still regarding Liquidity, S&Ps also considered Cimpor to have low levels of commercial paper and overdraft short term credit lines available, when compared to net financial debt outstanding. As means of offsetting this problem, renegotiations concerning commercial paper lines were being undertaken by the firm, accommodating at the same time a new contract for a new commercial paper program of 300 million Euros committed credit lines, starting with 75 million Euros being already committed at proposal date by the leader. Increasing overdrafts was also a short term planning objective, provided that the cost of maintaining those lines of on-demand credit was equal or lower than the costs incurred from sustaining a downgrade.
The negotiations concerning a previous commercial program with 1 year of existence and the negotiation of the new program are disclosed in more detail on Annex II, located in Appendix C.
Most important debt contracts outstanding on Cimpor’s balance sheet had as told before, financial covenants aiming to assure repayment ability by the borrower. Of the many contractual protective terms, the most important concerned covenants aiming to restrain the ability to contract debt above certain pre established levels associated to its ability to generate funds for meeting contractual obligations. The Net Debt/EBITDA financial ratio was one of them. By imposing a maximum limit of 3,5x over this ratio, creditors and debt holders were able to control the ability of the firm to repay capital plus interest, also including the pro-forma component.
One other covenant was the EBITDA/Net interest, with minimum limit of 5x, inserted with the objective of restraining operational margins to certain levels of efficiency, and a subsidiary indebtedness restriction aimed to oblige the holding to comply with the previously disclosed demands regarding the maintenance of certain levels of debt.
On the year of 2009 it was expected by Cimpor’s management team that the second financial ratio above disclosed would not represent much of a liability. However, with financial costs escalating on the following year of 2010 and providing that no reliable EBITDA trend would occur, the value corresponding to this item could decrease from the current 6,889x to a value much closer to its limit, which would implicate further action from S&Ps similar to the one stated so far.
Because lenders intended to indirectly control borrower’s ability to fulfill contractual obligations, the Net Debt/EBITDA limit clause would be discredited if a subsidiary indebtedness limit was not imposed, whenever the borrower was a mother company and not a subsidiary itself. Therefore, a subsidiary indebtedness clause had been inserted in the USPPs contract for an upper level limit of 10% consolidated subsidiary assets.
Figure 7. Holcim 2009 March Euro bond issuance in detail
Source: Privately Held Reports5
On the beginning of 2009, the Net Debt/EBITDA ratio was closing to the 3,5x limit, contributing already by 2008, with a value of 2,9x, disclosed on Table B6 data. S&Ps
demands therefore were directed towards the renegotiation of this limit present in contracts namely the USPPs and the Bilateral Loan S.T. This would no doubt impose serious increase over financial outflows given. Through benchmarking from an emission of EUR 500 million, representing approximately 5% of Holcim debt portfolio on the beginning of 2009 disclosed on Figure 7 above, yielding at a coupon rate of 9%, Cimpor who was planning a similar issuance in order to refinance the EUR 300 million Bilateral Loan S.T., were already counting with a coupon of approximately 12% annually. Such forecast would not imply a highly competitive disadvantage if sustaining a similar dimension as Holcim had, given that an emission of such amount would represent 25% of Cimpor’s long term liabilities.
The reasons behind such demand by the rating agency came from the consequence of crossing ratio limits. In the advent of failure to comply with contract terms, Cimpor would automatically be in technical default and from that, a major problem would be posed to Cimpor’s going concern. Because all debt contracts had cross default covenants, some delimiting minimum limits over amounts defaulted, some not, an official default over one single contract would imply an echo over all Cimpor’s outstanding debt contracts in a chain reaction model of successive defaults, similar to a nuclear debt bomb detonating the company perspectives for the future by erasing firm’s assets through alienation in order to comply with such obligations.
Additional information regarding the negotiations process regarding the USPP’s financial covenant can be found in Annex III, located in Appendix C.
Rating triggers could also be present in contract terms. These clauses aimed to set the contract to default whenever the company’s debt crossed the investment grade barrier to junk bond. On 2003, through contract comparison and benchmark of a previously outstanding syndicated loan, USPPs investors noticed a rating trigger clause on that relevant contract. As a result, USPPs investors also demanded such clause to be inserted on the proposed contract. Following negotiations culminated with the insertion of a clause stating that in the event of insertion on any other contract of a rating trigger, USPPs investors would be immediately informed and a similar clause would be added to the underlying contracts.
The interest in removing that trigger from a longer maturity contract came to be highly valuable for the firm, since by the end of 2008 the situation was not the same as it were in 2003. In order to execute a new project taking place on the Turkish Business unit at the cost of internal generated capital plus a financing from EIB in the value of EUR 50 million was
objected to take place on 2009, a contract was firstly drafted by the borrower with a rating trigger clause inserted in it.
With the notion that this would imply having to disclose also a rating trigger over the USPPs contract, which would be outstanding until 2015, Cimpor refused the proposal, which resulted in a new proposal demanding a Banking Guarantee and Indemnity Deed contract as a way of assuring Cimpor’s compliance with contractual.
Annex IV of Appendix C displays further details regarding this specific contract. Following the above referred contract restrictions, all tree Club Deals had a covenant restricting borrower indebtedness with a lower bound limit. The clause defined that Cimpor Inversiones, responsible for Group’s geographic expansion, had to have at least 75% of total aggregated financial of the Cimpor Inversiones’s Group.
With the contract still being on negotiation process, convergence of expectations was very important for its success.
VII.
A hard road yet to be travelled ahead
On 2009 Cimpor was becoming more and more willing to issue bond instruments as a way of avoiding as much as possible loan contraction from banking institutions. With only the disadvantage of being issued at a fixed rate and having principal to be repaid in bullet, these facilities presented better and attractive options for external fund raising, as most of those constraints could be swapped on the market.
Perverse incentives raised from adverse selection were strangling the corporate neck, characterized also by an inconspicuous snow ball effect of consecutive worsening of credit conditions intrinsically linked to the parameters by which S&Ps applied downgrades were the main challenges to be overcome by firm’s managers. Risk management theory dictated that as credit risk increases, so shall the interest rates underlying such risky contracts or securities. However, this axiom was starting to be considered highly irrational. Given that by demanding such higher rates, creditors were actually increasing the odds of default occurring by squeezing company’s decreased revenues from a contractive economic environment, not allowing it to operate normally and efficiently in order to fulfill those same characteristics.
Regardless of the above situation, the fact remained that debt cost escalation were almost a promise for bullet contracts being renegotiated with investors willingly desiring to be repaid unless financial sector recovery were announced. State intervention through CGD social capital participation as last resort was not excluded from the agenda, especially in the
case of events turning spiral down as opposed to expectations. Expectations implied that, credit rating could be shifted to Portuguese state rating at 2009 beginning of AA- , eliminating this way all the challenges that the firm was facing concerning financing costs.
However, that situation was still on the far horizon for Cimpor and the fact remained that with a downgrade on long term debt, Cimpor would had to start taking decisions between changing cash allocation patterns from investment in order to successfully deleverage the firm and through that, benefit from auspicious negotiated outcomes regarding cost of debt either from debt renegotiation or simple new debt contraction. Naturally, the remaining option implied keeping capital allocated to investments as preferred management practice, in accordance with specific perquisites for players operating in the building materials sector, and also in accordance with expectations for an economic recovery and expansion for years following 2009. Despite unlikely, such scenario was actually based on empirical evidence from past events where sudden inflationary trends took place under economic recession. Through state direct action over employment creation by allocating capital raised either from taxes or country debt, to public investment which by chance was the main source of revenue for Cimpor’s major clients.
Not to forget was the fact that financial liabilities contracted on recession periods would carry on high spreads upon economic recovery, bringing even higher costs to the firm that could not accompany sales recovery.
VIII.
Questions
1. Were Cimpor’s growth prospects justifiable and sustained, or should the company had a slow down its expansion before 2008?
2. State one possible reason for Cimpor choosing to issue Corporate Bonds in the transatlantic market instead of resourcing to Euro Debt.
3. What advantages could Cimpor have by creating Cimpor BV instead of allocating bond issuance to any of its Holding and Sub-Holdings?
4. Given the large portion of Euro denominated financial indebtedness outstanding on firm’s debt accounts, compared to debt contracted in other currencies, should Cimpor seek foreign debt and therefore, decrease Euro currency concentration underlying outstanding instruments? Should Cimpor decentralize Group financing?
5. Would Cimpor’s choice to augment bond debt on its outstanding financing instruments for the coming years incapacitate firm’s ability to manage the Debt Snowball?
6. Give one possible reason for Cimpor not having convertible debt in its portfolio.
7. Elaborate a sensitivity analysis on Cimpor’s interest due on the years following 2009, for the debt instruments displayed on Table 2, whenever Euribor index changes 1 base point.
8. What possible constraints could arise from refinancing the USPPs covenant? Considering question 6, what impact would such constraints promote to future firm’s liquidity? What solution do you propose to this problem?
9. Do you believe that asset sale will be required in the future to fulfill debt obligations? 10. Should Cimpor use to advantage covenant negotiations to renegotiate maturities also? 11. Given market juncture on 2009 beginning, what type of interest rate should Cimpor
choose regarding the brand new EIB financing for EUR 50M (Fixed Vs. Floating rate)?
12. Why did the EIB not define nor disclosed Fixed Spreads on its proposal for the contract mentioned on question 8?
IX.
References
- 1Agência Financeira. 2009. Media Capital/Prisa/IOL. http://www.agenciafinanceira.iol.pt/
- 2Chava, Sudheer and Amiyatosh Purnanandam. 2008. “The Effect of Banking Crisis on Bank-Dependent Borrowers”, Working Paper
- 3Chava, Sudheer and Michael R. Roberts. 2008. “How Does Financing Impact Investment? The Role of Debt Covenants.” The Journal of Finance, Volume LXIII, NO 5
- 4Cimpor Annual Reports for the years: 2002, 2003, 2004, 2005, 2007 and 2008
- 5Cimpor privately held reports, proposals, debt contracts and documentation
- 6€uribor®. 2009. EBF/ACI. http://www.euribor.org/
- 7European Central Bank – Eurosystem. 2009. ECB. http://www.ecb.int/
- 8Holcim Annual Reports for the years: 2002, 2003, 2004, 2005, 2007 and 2008
- 9Jornal de Negócios on-Line. 2009. © MediaFin SA 2003/Bolsamania Tech Solutions. http://www.jornaldenegocios.pt/
- 10Lafarge Annual Reports for the years: 2002, 2003, 2004, 2005, 2007 and 2008
- 11Lim, Youngjae. 2003. “Sources of Corporate Financing and Economic Crisis in Korea: a Micro-Evidence”, National Bureau of Economic Research, NBER Working Paper Series, Working Paper 9575
- 12Ross, Stephen A., Randolph W. Westerfield, Jeffrey Jaffe, Bradford D. Jordan. 2008.
X.
Appreciations
I am very grateful to Dr. Jorge Saraiva, Professor Miguel Ferreira, Dra. Nélia Veloso, Dr. Rui Zenoglio, Dr. Armando Mendes, all the Cimpor management team from the Financial Operations Area and all Universidade Nova de Lisboa – Faculdade de Economia academic and management team, for all the support given in order to make this project feasible and possible.
Appendix A
Figure A1. International presence of Cimpor by 2009 beginning
Source: Cimpor presentation 20085; Company documentation5
Figure A2. Cimpor dividend payout ratio between 2002 and 2008
Figure A3. Cimpor's Stock price evolution between 2003 and 2009 ( Quotations from 8.APR.2003 until 29.MAY.2009)
Source: Bloomberg
Figure A4. Cimpor's stock evolution Vs. PSI20 index trend between 2003 and mid 2007
Figure A5. Cimpor’s shareholder structure as it was on April 2009
Source: Company documentation5; Agência Financeira1
Figure A6. Euribor evolution comparison to ECB reference interest rates on outstanding Euro-denominated amounts to non-financial corporations with
maturities over 1 year up to 5 years
Figure A7. Cimpor EBITDA margins, interest coverage and interest cash outflows between 2002 and 2008
Figure A8. Cimpor Capital Employed Vs. Group yearly generated EBITDA, invested capital and net debt between 2002 and 2008
Figure A9. Cimpor EBITDA and investment pattern compared with that of Holcim and Lafarge (Exchange rate used for converting CHF to EUR retrieved on the 31st.DEC.2008)
Appendix B
Table B1. Cimpor resumed financial data between 2002 and 2008
(Monetary values in thousands of Euros. Exchange rate used for converting CHF to EUR retrieved on the 31st.DEC.2008)
Source: Cimpor Annual Reports from 2002 – 20084; Holcim Annual Reports 2003-20088; Lafarge Annual Reports 2003-200810 ; Company documentation5
Resumed Income Statement Holcim Lafarge Cimpor
2008 2007 2006 2005 2004 2003 2002
Operational Revenue 16.934.127 19.033.000 2.088.900 1.966.100 1.638.900 1.534.800 1.365.600 1.360.900 1.317.200
Costs and Expenses -13.336.205 -14.595.000 -1.502.600 -1.359.100 -1.075.800 -1.039.000 -906.900 -848.400 -805.800
EBITDA 3.597.921 4.438.000 586.300 607.000 563.100 495.800 458.700 512.500 511.400
Depreciation & Amortization -1.336.178 -1.076.000 -193.700 -168.900 -155.050 -140.400 -210.500 -223.500 -227.600
EBIT 2.261.743 3.362.000 392.600 438.100 408.050 355.400 248.200 289.000 283.800
Financial revenue 12.790 216.000 138.627 100.490 94.147 112.749 91.778 - -
Interest and financial losses -666.406 -1.157.000 -187.816 -158.794 -167.628 -152.972 -138.597 -45.830 -28.439
Results from affiliates 154.149 -3.000 -86.735 8.025 19.146 35.211 39.039 7.051 3.760
Results from financial investment 182.420 - 1.537 2.291 12.035 1.756 1.049 3.264 1.349
EBT 1.944.695 2.418.000 258.213 390.112 365.750 352.144 241.469 253.485 260.470
Taxes -446.290 -479.000 -24.900 -69.341 -60.140 -75.695 -52.881 -72.633 -40.646
Net Income 1.498.405 1.939.000 233.313 320.771 305.610 276.449 188.588 180.852 219.824
Net income attributable to shareholders 1.199.531 1.598.000 2.194.000 304.073 291.915 266.159 256.150 173.622 214.751
Earnings per share 4,59 8,27 0,33 0,45 0,44 0,40 0,38 0,28 0,27
Number of Shares Outstanding (units) 263.586.090 195.236.534 672.000.000 672.000.000 672.000.000 672.000.000 672.000.000 672.000.000 672.000.000 Dividends paid (in Euros) 584.283.579 784.000.000 153.235.000 143.951.000 127.191.000 120.299.000 113.465.000 104.568.000 86.807.000
Table B1.1. Cimpor resumed financial data between 2002 and 2008
(Monetary values in thousands of Euros. Exchange rate used for converting CHF to EUR retrieved on the 31st.DEC.2008)
Resumed Balance Sheet Holcim Lafarge Cimpor
2008 2007 2006 2005 2004 2003 2002
Non Current Assets 23.693.776 32.928.000 3.720.666 3.680.155 2.866.789 2.725.472 2.725.472 2.271.037 2.388.102
Current Assets 6.727.339 7.680.000 894.589 1.153.813 991.022 685.995 685.995 818.135 949.757
Shareholders’ Equity 12.098.978 14.635.000 1.615.786 1.899.281 1.653.736 1.222.918 1.222.918 960.586 949.577 Non Current Liabilities 7.246.328 17.043.000 2.418.411 1.928.574 1.849.476 1.758.163 1.758.163 1.213.620 989.433 Current Liabilities 11.075.809 8.930.000 581.059 1.006.113 354.599 430.386 430.386 570.913 1.007.655 Net Financial Debt 10.128.704 16.884.000 1.862.600 1.359.300 865.600 1.079.400 1.312.300 1.238.500 1.148.900
Financial Ratios Holcim Lafarge Cimpor
2008 2007 2006 2005 2004 2003 2002
Current ratio 0,61 0,86 1,54 1,15 2,79 1,59 1,59 1,43 0,94
Total Debt ratio 60,23% 63,96% 64,99% 60,71% 57,13% 64,15% 64,15% 68,90% 71,55%
Times Interest ratio 0,42 2,09 1,37 2,46 2,18 2,30 1,74 5,53 9,16
Cash Coverage ratio -0,91 1,98 1,06 1,70 1,51 1,41 0,27 1,43 1,98
Debt-Equity ratio 1,51 1,77 1,86 1,55 1,33 1,79 1,79 1,86 2,10
Asset Turnover ratio 55,67% 46,87% 45,26% 40,67% 42,48% 44,99% 40,03% 44,05% 39,46%
Capital Intensity ratio 1,80 2,13 2,21 2,46 2,35 2,22 2,50 2,27 2,53
Profit Margin -0,67% 10,19% 11,17% 16,32% 18,65% 18,01% 13,81% 13,29% 16,69%
ROA -0,37% 4,77% 5,06% 6,64% 7,92% 8,10% 5,53% 5,85% 6,59%
ROE 10,40% 13,25% 13,30% 18,10% 18,90% 19,70% 19,30% 19,50% 17,30%
ROI -0,37% 8,80% 10,40% 11,60% 13,10% 12,10% 9,70% 10,30% 9,90%
Net Debt/EBITDA 4,18 3,80 3,18 2,24 1,54 2,18 2,86 2,42 2,25
Table B2 Cimpor outstanding liabilities structure on the 31st of December of each year between 2002 and 2008 (Monetary values in thousands of Euros)
2008 2007 2006 2005 2004 2003 2002
Long Term Liabilities:
Bonds 883.055 855.939 885.239 920.263 881.216 344.709 -
Bank Loans 1.028.075 467.993 471.536 4.896.955 418.132 844.718 958.933
Other Loans - 315 630 5.797 8.952 8.383 9.630
Subtotal 1.911.130 1.324.247 1.357.405 1.417.015 1.308.273 1.197.810 968.564
Short Term Liabilities:
Bank Loans 201.177 623.142 52.578 33.891 153.883 331.069 552.072
Other Loans 324 340 7.678 2.650 2.403 2.531 304
Subtotal 201.501 623.482 60.256 36.541 156.287 333.604 552.376
Total 2.112.631 1.947.729 1.417.661 1.453.556 1.464.560 1.531.411 1.520.941
Table B3 Cimpor's outstanding Bond values accrued on the 31st of December of each year between 2002 and 2008 (Monetary values in thousands of Euros)
Issuer Debt Instrument Issuance Date Maturity 2008 2007 2006 2005 2004 2003 2002
Cimpor Financial Operations B.V. Eurobonds 27.May.04 27.May.11 608.107 597.598 596.903 596.202 595.500 - - Cimpor Financial Operations B.V. US Private Placements 10Y 27.Jun.03 27.Jun.13 102.762 96.352 106.073 118.977 105.153 127.986 - Cimpor Financial Operations B.V. US Private Placements 12Y 27.Jun.03 27.Jun.15 172.186 161.989 182.263 205.084 180.563 216.723 -
Total 883.055 855.939 885.239 920.263 881.216 344.709 - Source: Cimpor Annual Reports from 2002 – 20084; Company documentation5
Table B3.1 Cimpor's outstanding long term Banks Loans accrued on the 31st of December of each year between 2002 and 2008 (Monetary values in thousands of Euros)
Long Term Debt Instrument Currency Interest Rate 2008 2007 2006 2005 2004 2003 2002
Bilateral Loan EUR Euribor + 0,50% - - - 48.000
Bilateral Loan EUR Euribor + 0,75% - - - 150.000
Syndicated Loan EUR Euribor* + 0,50% - - - - 300.000 300.000 -
Bilateral Loan EUR Euribor + 0,675% - - - 250.000 250.000
Syndicated Loan EUR Euribor + 0,40% - - - 94.503 283.509
EIB Loan EUR EIB** basic rate 40.000 46.667 53.334 60.000 60.000 60.000 -
Bilateral Loan EUR Euribor + 0,60% - - 8.702 14.502 15.833 50.000 50.000
Bilateral Loan EGP Caibor*** + 1,125% - - - 20.998 26.773
Syndicated Loan USD Libor**** + 0,40% - - - 19.794 71.517
Bilateral Loan BRL Several 7.280 13.043 16.636 11.178 11.101 9.412 -
Bilateral Loan USD Libor**** + 1,00% - - - 4.750 11.919
Bilateral Loan EUR Euribor + 1,50% - - - 9.375 15.625 3.508 -
Bilateral Loan MZM TAM***** + 5,25% - - - 1.415 4.701 6.797 9.849
Bilateral Loans EUR Several - - - 31.192
Bilateral EGP 11,70% - - - - 62 - -
Bilateral Loans ZAR Several - - - - 261 - -
Bilateral Loans EUR Several 72.022 126.676 364 1.985 10.549 - -
Bilateral Loan EUR Euribor + 0,275% - - 392.500 392.500 - - -
Bilateral Loan CVE Several 11 49 - - - - -
Bilateral Loans CNY Several - 930 - - - - -
*European Interbank Offering Rate **European Investment Bank ***Cairo Interbank Offering Rate ****London Interbank Offering Rate
Source: Cimpor Annual Reports from 2002 - 20084; Company documentation5
Table B3.1 Cimpor's 2008 end outstanding long term Bank Loans accrued on the 31st of December of each year between 2002 and 2008 continued
(Monetary values in thousands of Euros)
Long Term Debt Instrument Currency Interest Rate 2008 2007 2006 2005 2004 2003 2002
Bilateral Loan INR 10,50% 14.838 - - - -
Bilateral Loan MAD Several 1.667 - - - -
Club Deal 1 EUR Euribor + 0,275% 280.000 280.000 - - - - -
Club Deal 2 EUR Euribor + 0,75% 111.997 - - - -
Club Deal 3 EUR Euribor + 0,275% 199.627 - - - -
Bilateral Loan ST EUR Euribor + 0,55% 299.526 - - - -
Sundry Finance - - - 24.953 26.172