1980–2017: a systematic analysis for the Global Burden of
Disease Study 2017
GBD 2017 Causes of Death Collaborators*
Summary
Background
Global development goals increasingly rely on country-specific estimates for benchmarking a nation’s
progress. To meet this need, the Global Burden of Diseases, Injuries, and Risk Factors Study (GBD) 2016 estimated
global, regional, national, and, for selected locations, subnational cause-specific mortality beginning in the year
1980. Here we report an update to that study, making use of newly available data and improved methods. GBD 2017
provides a comprehensive assessment of cause-specific mortality for 282 causes in 195 countries and territories from
1980 to 2017.
Methods
The causes of death database is composed of vital registration (VR), verbal autopsy (VA), registry, survey,
police, and surveillance data. GBD 2017 added ten VA studies, 127 country-years of VR data, 502 cancer-registry
country-years, and an additional surveillance country-year. Expansions of the GBD cause of death hierarchy resulted
in 18 additional causes estimated for GBD 2017. Newly available data led to subnational estimates for five additional
countries—Ethiopia, Iran, New Zealand, Norway, and Russia. Deaths assigned International Classification of Diseases
(ICD) codes for non-specific, implausible, or intermediate causes of death were reassigned to underlying causes by
redistribution algorithms that were incorporated into uncertainty estimation. We used statistical modelling tools
developed for GBD, including the Cause of Death Ensemble model (CODEm), to generate cause fractions and
cause-specific death rates for each location, year, age, and sex. Instead of using UN estimates as in previous versions,
GBD 2017 independently estimated population size and fertility rate for all locations. Years of life lost (YLLs) were
then calculated as the sum of each death multiplied by the standard life expectancy at each age. All rates reported here
are age-standardised.
Findings
At the broadest grouping of causes of death (Level 1), non-communicable diseases (NCDs) comprised the
greatest fraction of deaths, contributing to 73·4% (95% uncertainty interval [UI] 72·5–74·1) of total deaths in
2017, while communicable, maternal, neonatal, and nutritional (CMNN) causes accounted for 18·6% (17·9–19·6),
and injuries 8·0% (7·7–8·2). Total numbers of deaths from NCD causes increased from 2007 to 2017 by 22·7%
(21·5–23·9), representing an additional 7·61 million (7·20–8·01) deaths estimated in 2017 versus 2007. The death
rate from NCDs decreased globally by 7·9% (7·0–8·8). The number of deaths for CMNN causes decreased by
22·2% (20·0–24·0) and the death rate by 31·8% (30·1–33·3). Total deaths from injuries increased by 2·3%
(0·5–4·0) between 2007 and 2017, and the death rate from injuries decreased by 13·7% (12·2–15·1) to
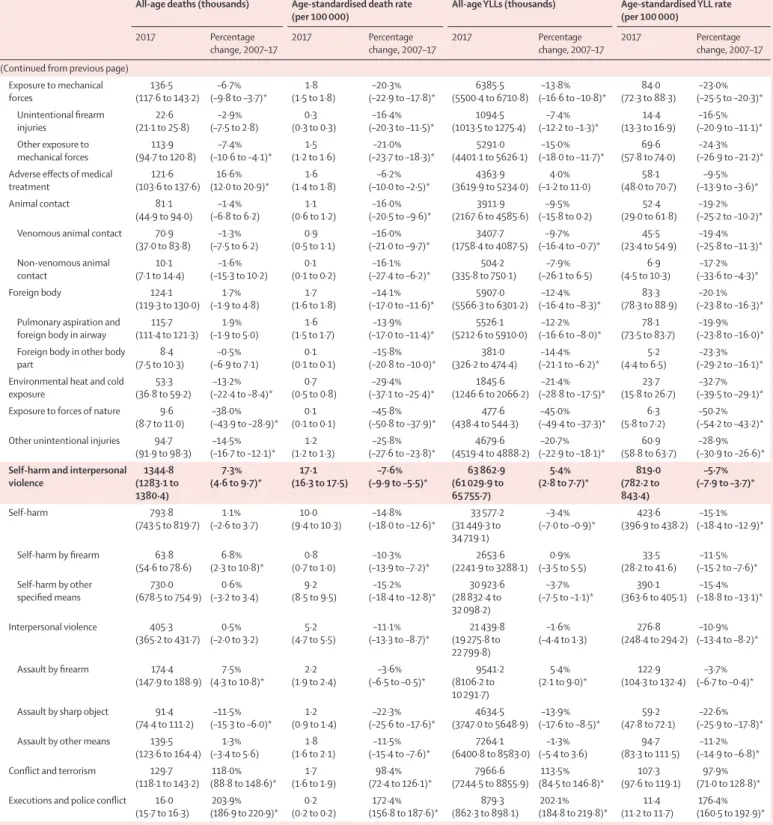
57·9 deaths (55·9–59·2) per 100 000 in 2017. Deaths from substance use disorders also increased, rising from
284 000 deaths (268 000–289 000) globally in 2007 to 352 000 (334 000–363 000) in 2017. Between 2007 and 2017,
total deaths from conflict and terrorism increased by 118·0% (88·8–148·6). A greater reduction in total deaths and
death rates was observed for some CMNN causes among children younger than 5 years than for older adults,
such as a 36·4% (32·2–40·6) reduction in deaths from lower respiratory infections for children younger than
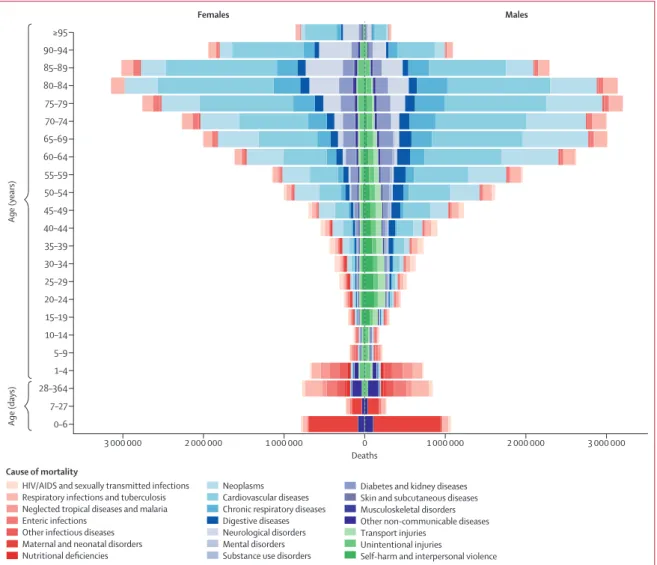
5 years compared with a 33·6% (31·2–36·1) increase in adults older than 70 years. Globally, the number of
deaths was greater for men than for women at most ages in 2017, except at ages older than 85 years. Trends in
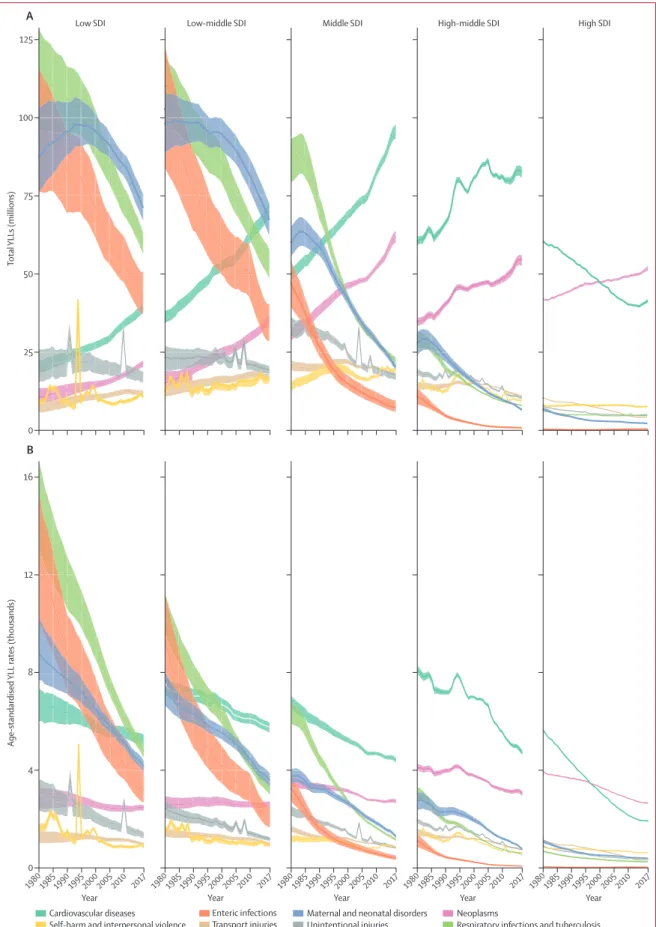
global YLLs reflect an epidemiological transition, with decreases in total YLLs from enteric infections, respiratory
infections and tuberculosis, and maternal and neonatal disorders between 1990 and 2017; these were generally
greater in magnitude at the lowest levels of the Socio-demographic Index (SDI). At the same time, there
were large increases in YLLs from neoplasms and cardiovascular diseases. YLL rates decreased across
the five leading Level 2 causes in all SDI quintiles. The leading causes of YLLs in 1990—neonatal disorders,
lower respiratory infections, and diarrhoeal diseases—were ranked second, fourth, and fifth, in 2017. Meanwhile,
estimated YLLs increased for ischaemic heart disease (ranked first in 2017) and stroke (ranked third), even
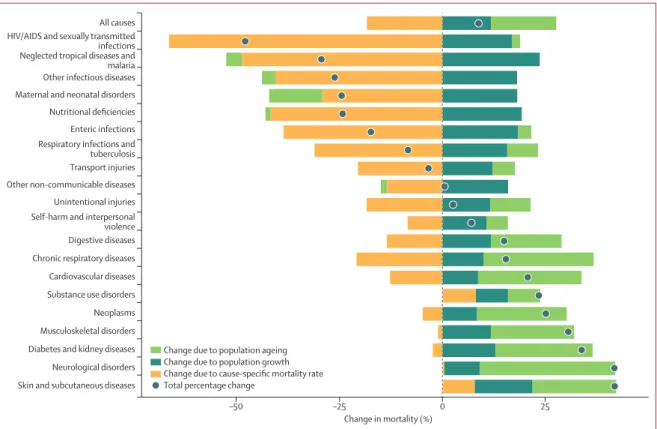
though YLL rates decreased. Population growth contributed to increased total deaths across the 20 leading
Level 2 causes of mortality between 2007 and 2017. Decreases in the cause-specific mortality rate reduced the effect
of population growth for all but three causes: substance use disorders, neurological disorders, and skin and
Lancet 2018; 392: 1736–88
This online publication has been corrected. The corrected version first appeared at thelancet.com on November 9, 2018, and further corrections were made on June 20, 2019
*Collaborators listed at the end of the paper Correspondence to: Dr Gregory Roth, Institute for Health Metrics and Evaluation, Seattle, WA 98121, USA
Introduction
Systematic recording and analysis of causes of
human death remains one of the most resilient successes
for public health, beginning with routine and continuous
reporting of deaths by physicians starting in the
15th century.
1Today, hundreds of thousands of physicians
evaluate and select the cause of death for millions of
deaths annually, codifying the results according to the
International Classification of Diseases (ICD) system.
2These efforts form the basis of a global mortality
reporting system that is widely relied upon to prioritise
health system investments, track progress towards
global development goals, and guide scientific research.
Although there remains a need for wider adoption and
improvement of these systems, continuous reporting of
cause-specific mortality in many countries represents a
success for global health.
3More mortality data are now becoming available
because of broader adoption of vital registration
systems and increased information-sharing made
possible by digital communication. At the same time,
efforts to correct, sort, analyse, and report this massive
Research in context
Evidence before this study
Previously, the Global Burden of Diseases, Injuries, and Risk
Factors Study (GBD) 2016 provided estimates for 264 causes of
death for 195 countries and territories, by age and sex, from 1980
to 2016. GBD 2016 incorporated newly available data for many
locations, expanded and refined the included causes of death,
improved modelling techniques, and developed a star rating
system for the quality of cause of death data. To better assess
mortality among the oldest adults, terminal age categories for
age 90–94 years and 95 years and older were added. Other
organisations periodically produce estimates of cause‐specific
mortality, including for a wide list of causes and across multiple
age groups (WHO), for selected cancers (the International Agency
for Research on Cancer), and for child deaths (the Maternal and
Child Epidemiology Estimation [MCEE] group). GBD continues to
provide the only peer‐reviewed annual estimates of cause‐specific
mortality available for all locations over time.
Added value of this study
GBD 2017 includes estimates for 2017 and also updates the
entire series from 1980 produced for GBD 2016. The list of
included causes has been expanded and study methods have
been improved in multiple ways. First, inclusion of an
independent estimation of population and fertility developed
for GBD 2017 substantially improved estimates in selected
countries. Second, additional data were identified, including
127 country‐years of vital registration and ten verbal autopsy
studies. Third, new subnational assessments were developed
for five countries in 2017: Ethiopia, Iran, New Zealand, Norway,
and Russia. Fourth, a new stratum was developed for
subnational‐level estimation in New Zealand to characterise
populations by ethnicity as Māori or non‐Māori. Fifth, we
revised adjustments made for misclassified deaths due to
dementia, Parkinson’s disease, and atrial fibrillation. Finally,
additional diseases are now estimated, including
non‐rheumatic calcific aortic and degenerative mitral valve
disease; subarachnoid haemorrhage; myelodysplastic,
myeloproliferative, and other haemopoietic disorders;
diabetes mellitus as type 1 and type 2 (previously combined);
poisoning by carbon monoxide; liver cancer due to
non‐alcoholic steatohepatitis; ectopic pregnancy; and invasive
non‐typhoidal salmonella.
Implications of all the available evidence
Deaths due to communicable, maternal, neonatal, and
nutritional causes continue to decline, while deaths from non‐
communicable diseases increase and injury deaths are stable.
Declines in death rates of some non‐communicable diseases
have slowed or ceased. GBD 2017 has increased its
collaboration with governments, leading to additional data
for subnational estimation. Engagement with GBD
collaborators, policy makers, disease experts, and the public is
guiding expansions of the cause list and resulting decreasing
burden classified in residual “other” categories.
Non‐communicable diseases remain the leading causes of
death globally, and their burden is rising. GBD 2017 is
motivated by the same goals as GBD 2016, including the belief
that annual updates, reflecting improvements due to
improved data availability, new causes estimated, and better
methods to reduce bias and improve transparency in
reporting, are contributing to the formulation and tracking of
new evidence‐based health policy. We intend for GBD 2017 to
serve as a global public good, freely available for policy makers
and the public seeking to improve human health.
NCDs, and the death rate for selected causes has increased in the past decade.
Funding
Bill & Melinda Gates Foundation.
due to specific causes are frequently observed and
require recurrent updates to global estimates. Examples
of mortality spikes include opioid-associated deaths in
parts of the USA,
4suicide in eastern Europe in the
1990s,
5and conflict-associated deaths in the eastern
Mediterranean and North Africa region.
6Causes of
death are now reported digitally in many locations,
allowing health authorities to improve the quality and
timeliness of mortality reporting.
7,8Global development
goals increasingly rely on country-specific estimates for
benchmarking a nation’s progress. Global commitments,
such as the UN’s Sustainable Development Goals
(SDGs),
9the Moscow Declaration to End Tuberculosis,
10WHO’s First Global Conference on Air Pollution and
Health
11in October, 2018, and the UN High-level
Meetings on NCDs
12and tuberculosis,
13both in
September, 2018, will require ongoing tracking of
cause-specific mortality, including in locations where
mortality surveillance data remain limited.
The following study represents an annual update to
the Global Burden of Diseases, Injuries, and Risk Factors
Study (GBD), an effort to produce consistent and
com-parable estimates of cause-specific mortality for all
locations globally. GBD 2017 includes results by age and
sex, for the years 1980 through to 2017, for 195 countries
and territories. A cycle of continuous quality
improve-ment has led to substantial changes, including new data
sources, new causes of death, and updated methods.
For the first time, population estimates have been
independently produced by GBD 2017,
14and
subna-tional estimates have been produced for Ethiopia, Iran,
New Zealand, Norway, and Russia. The purpose of GBD
2017 is to serve as a global public good, freely available
for policy makers and the public seeking to improve
human health.
Methods
Overview
GBD cause of death estimation incorporates methods to
adjust for incomplete or missing vital registration (VR)
and verbal autopsy (VA) data, general heterogeneity in
data completeness and quality, and the redistribution
of so-called garbage codes (insufficiently specific or
implausible cause of death codes). A general description
of these methods is provided in this section, with further
detail presented in appendix 1. GBD 2017 complied with
the Guidelines for Accurate and Transparent Health
Estimates Reporting (GATHER)
15statement (appendix 1
section 1.3). Analyses were completed with Python
version 2.7.14, Stata version 13.1, and R version 3.3.2.
Statistical code used for GBD estimation is publicly
Each year, GBD includes sub national analyses for a few
new countries and continues to provide subnational
estimates for countries that were added in previous cycles.
Subnational estimation in GBD 2017 includes five new
countries (Ethiopia, Iran, New Zealand, Norway, Russia)
and countries previously estimated at subnational levels
(GBD 2013: China, Mexico, and the UK [regional level];
GBD 2015: Brazil, India, Japan, Kenya, South Africa,
Sweden, and the USA; GBD 2016: Indonesia and the UK
[local government authority level]). All analyses are at the
first level of administrative organisation within each
country except for New Zealand (by Māori ethnicity),
Sweden (by Stockholm and non-Stockholm), and the UK
(by local government authorities). All subnational
estimates for these countries were incorporated into
model development and evaluation as part of GBD 2017.
To meet data use requirements, in this publication we
present all subnational estimates excluding those pending
publication (Brazil, India, Japan, Kenya, Mexico, Sweden,
the UK, and the USA); because of space constraints these
selected subnational results are presented in appendix 2.
Subnational estimates for countries with populations
larger than 200 million (measured with our most recent
year of published estimates) that have not yet been
published elsewhere are presented wherever estimates
are illustrated with maps but are not included in data
tables.
The complete cause-specific estimation results include
the years 1980 through to 2017, and are available for
exploration by an online data visualisation tool. To better
support current health policy assessment, we include a
subset of analyses in the current study featuring the
most recent interval, 2007–17.
The GBD cause of death hierarchy
The GBD study attributes each death to a single
underlying cause that began the series of events leading
to death, in accordance with ICD principles. The GBD
study organises causes of death in a hierarchical list
containing four levels (appendix 1 section 7). At the
highest level (Level 1), all disease burden is divided
among three mutually exclus
ive and collectively
exhaustive categor
ies: communicable, maternal,
neonatal, and nutritional (CMNN) diseases;
non-communicable diseases (NCDs); and injuries. Level 2
distinguishes these Level 1 categories into 21 cause
groups, such as cardiovascular diseases; diarrhoeal
diseases, lower respiratory infections (LRIs), and other
common infectious diseases; or transport injuries.
Level 3 disaggregates these causes further; in most
cases this disaggregation represents the finest level of
For the data visualisation tool see https://vizhub.health data.org/gbd‐compare/
See Online for appendix 1
For the statistical code see https://github.com/ihmeuw/ See Online for appendix 2
extensively drug-resistant tuberculosis. For GBD 2017,
the cause hierarchy was further refined to separately
estimate causes with sub stantial policy interest or high
levels of burden. Specific changes included separate
estimation of non-rheumatic calcific aortic and
degen-erative mitral valve dis
eases, and myelodysplastic,
myeloproliferative, and other haemo poietic neoplasms,
resulting in a reduction in the estim
ates of some
residual causes. Disaggregation of residual causes also
allowed separate estimation of type 1 and type 2 diabetes,
chronic kidney disease due to type 1 and type 2 diabetes,
poisoning by carbon monox ide, liver cancer due to
non-alcoholic steatohepatitis (NASH), subarachnoid
haemorrhage, ectopic pregnancy, and invasive
non-typhoidal salmonella. Maternal and neonatal disorders,
previously estimated as separate cause groupings at
Level 2 of the hierarchy, were estimated for GBD 2017
at Level 3 of the hierarchy, and then aggregated up to
Level 2 to better capture the epidemiological connections
and linked burden between them. The complete
hierarchy of causes included in GBD 2017 and their
corresponding ICD9 and ICD10 codes are described in
appendix 1 (section 7).
Cause of death data
The GBD cause of death database consists of VR and VA
data; survey and census data for injuries and maternal
mortality; surveillance data for maternal mortality and
child death; cancer registries; and police records for
interpersonal violence and road injuries. Self-harm
estimates incorporate VR data and are based on ICD
categorisation as described in appendix 1 (section 7). In
this iteration of GBD, ten new VA studies and 127 new
country-years of VR data were added at the country
level. 502 new cancer-registry country-years were
added, as was one additional new surveillance
country-year. Data sources comprising the GBD cause of
death database can be reviewed on the Global Health
Data Exchange website. Multiple factors can influence
changes between GBD studies in estimates for a given
cause-location-year, including the quality of a country’s
data system (as represented by the GBD star rating
system) and the addition of more recent data.
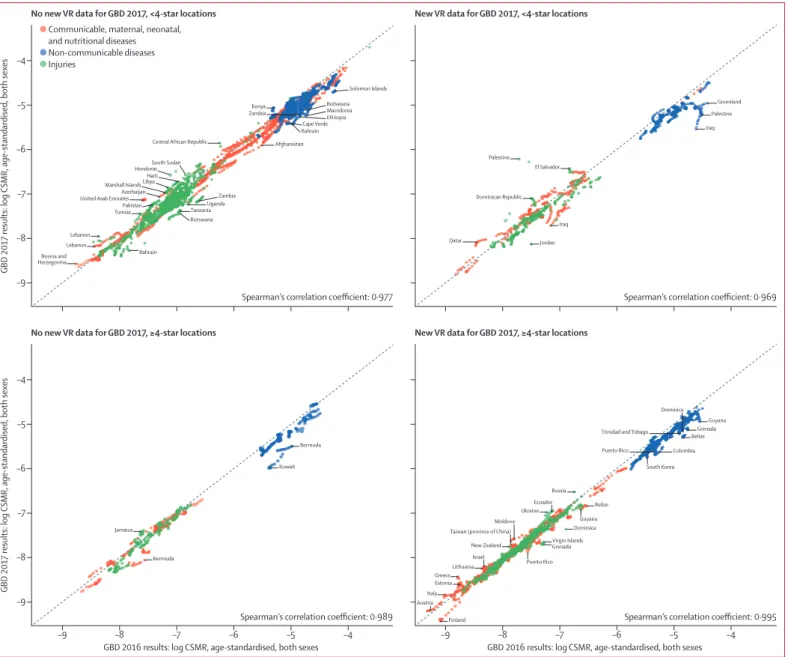
Figure 1 shows the relative stability of GBD estimates
between study iterations. Variation between GBD 2016
and GBD 2017 estimates was greater in countries with
both low star ratings and no new VR data updates
occurring between these iterations of the study. Changes
to estimates can be seen even in high star rating
locations because of changes in modelling strategy or
model covariates even when no new VR data were
available between cycles.
address differences in ICD codes due to national
variation or revision, as described in appendix 1
(section 2). Garbage codes, deaths with non-specific
codes (eg, unspecified stroke), deaths assigned to ICD
codes that could not be underlying causes of death
(eg, senility), or deaths assigned to intermediate but
not underlying causes of death (eg, heart failure), were
redistributed by age, sex, location, and year to the
most likely causes of death. Methods used for this
redistribution included regression models,
redistri-bution based on fixed proportions, pro
portional
reassignment, and fractional assignment of a death
assigned to multiple causes, as developed by Naghavi
and colleagues
16and detailed in appendix 1 (section 2.7).
We excluded all data sources with more than 50% of
deaths assigned to major garbage codes (those at
Level 1 or Level 2 of the GBD hierarchy) in any
location-year to mitigate the potential for bias from these
sources. The proportion of VR data assigned to major
garbage code categories for each location-year is
shown, with supporting detail, in appendix 1 (section 7).
New to GBD 2017, the uncertainty around
re-distribution methods was also estimated. Additional
details for this process are provided in appendix 1
(section 2.7). Because mortality due to HIV/AIDS is
sometimes coded to other causes of death such as
tuberculosis, meningitis, or toxoplasmosis, we also
corrected the cause of death assignment to HIV/AIDS
for peak epidemic times. Tuberculosis deaths can be
misclassified as pneumonia deaths in children in
locations with a high tuberculosis burden. Methods to
adjust for this potential mis classi fication are described
in detail in appendix 1 (section 3.3).
Mortality rates from dementia and Parkinson’s disease
reported in VR systems cannot be reconciled with
observed trends in prevalence and excess mortality—a
disparity that can be attributed to variation in death
certification practices for these causes across countries
and over time.
17For GBD 2017, we sought to address this
known bias by using details from multiple cause of
death data. For GBD 2017, multiple cause of death data
were available to investigators only for the USA, where
recent years show improved use of previously
under-utilised codes such as dementia. Statistical models of
these USA data were used to reclassify deaths from
other GBD causes and garbage codes to dementia and
Parkinson’s disease according to the pattern of
intermediate and immediate causes observed in the
most recent years. Model results were applied to all
countries. A similar reallocation pro cess was used for
atrial fibrillation deaths misclassified as deaths due to
heart failure or thromboembolic events. A detailed
For the Global Health
Data Exchange see
description of these redistribution procedures and the
manner in which they were applied to all countries is
available in section 2 of appendix 1. This reallocation is
illustrated in appendix 1 (section 7).
For the first time in GBD 2017, we separately estimated
deaths from diabetes by type. Deaths due to diabetes can
be reported in VR and VA data as type 1, type 2, or
unspecified. Two data manipulation steps were necessary.
younger than 15 years were type 1 regardless of the
original code assignment. Second, we redistributed
unspecified diabetes deaths on the basis of a regression
in which the true proportions of type 1 and type 2 deaths
by age-sex-location-year are a function of the proportion
of unspecified deaths, age, the age-standardised
pre-valence of obesity, and an interaction term for age and
obesity prevalence. These methods are described in detail
Figure 1: Effect of new VR data on Level 1 cause estimates from GBD 2016 to GBD 2017, based on national locations with varying quality of VR data, 2008–16
The figure shows the degree of consistency between GBD 2016 and GBD 2017 estimates for Level 1 causes at the national level from 2008 to 2016. The diagonal line represents no change from GBD 2016 to GBD 2017. Each point represents one country‐year, with colours indicating the Level 1 cause grouping (communicable, maternal, neonatal, and nutritional diseases; non‐communicable diseases; and injuries). Panels indicate whether or not any new VR data between 2008 and 2016 were added for that location for GBD 2017, and whether or not a location has 4‐star or 5‐star VR quality. Points that are outside of the standard 95% prediction interval for a linear regression of 2017 values on 2016 values are annotated (if the same location‐cause had multiple points in a time series, only the furthest‐most point was annotated). The Spearman’s correlation coefficient is noted in the lower right‐hand corner of each panel. CSMR=cause‐specific mortality rate. GBD=Global Burden of Diseases, Injuries, and Risk Factors Study. VR=vital registration.
Bermuda Kuwait
GBD 2017 results: log
CSMR, age-standardised, both sexes
–9 –8 Bosnia and Herzegovina Bahrain Lebanon
Spearman’s correlation coefficient: 0·977 Spearman’s correlation coefficient: 0·969
Spearman’s correlation coefficient: 0·989 Spearman’s correlation coefficient: 0·995
TunisiaPakistan Azerbaijan Marshall Islands Libya
HondurasSouth Sudan Central African Republic
ZambiaKenya
United Arab Emirates
Lebanon Bahrain Botswana TanzaniaUganda Zambia Qatar Jordan Afghanistan Cape VerdeEthiopia
Macedonia Botswana Solomon Islands –7 –6 –5 –9 –8 –7 –6 –5 –4 GBD 2017 results: log
CSMR, age-standardised, both sexes
GBD 2016 results: log CSMR, age-standardised, both sexes –9 –8 –7 –6 –5 –4
No new VR data for GBD 2017, ≥4-star locations
–9 –8 –7 –6 –5 –4
GBD 2016 results: log CSMR, age-standardised, both sexes
New VR data for GBD 2017, ≥4-star locations
Iraq Dominican Republic Palestine El Salvador Iraq Palestine Greenland Bermuda Finland Austria Italy Jamaica Puerto Rico Virgin Islands Dominica Dominica Belize BelizeGrenada Guyana South Korea Colombia Russia Puerto Rico Trinidad and Tobago
Ecuador Guyana Grenada Greece Lithuania Israel Estonia New Zealand Taiwan (province of China)
Moldova Ukraine Haiti
corresponding age-sex-location-year to adjust all included
sources to 100% completeness. VA and VR data availability
and completeness are shown for each location-year in
appendix 1 (section 7). To further char acterise the quality
of data available in each country, the GBD study rated
each location-year from 1980 to 2017 on a level of 0 to
5 stars according to methods previously described.
18Ratings convey an overall measure of the reliability of
cause of death estimates for each location-year but do not
directly affect the estimation process.
Cause of death estimation with CODEm
The GBD Cause of Death Ensemble model (CODEm)
systematically tested and combined results from
different statistical models according to their
out-of-sample pre dictive validity. Results are incorporated into
a weighted ensemble model as detailed in appendix 1
(section 3.1) and below. For GBD 2017, CODEm was
used to estimate 192 causes of death (appendix 1
section 7). To predict the level for each cause of death,
we used CODEm to systematically test a large number
of functional forms and permutations of covariates.
18Each resulting model that met the predetermined
req-uirements for regression coefficient significance and
direction was fit on 70% of the data, holding out 30% for
cross-validation (appendix 1 section 3.1). Out-of-sample
pre dictive validity of these models was assessed by use
of repeated cross-validation tests on the first 15% of the
held-out data. Various ensemble models with different
weighting parameters were created from the
com-bination of these models, with the highest weights
assigned to models with the best out-of-sample
pre-diction error for trends and levels, as detailed in
appendix 1 (section 7). Model performance of these
ensembles was assessed against the root-mean squared
error (RMSE) of the ensemble model predictions of the
log of the age-specific death rates for a cause, assessed
with the same 15% of the data. The ensemble model
performing best was subsequently selected and
assessed against the other 15% of the data withheld
from the statistical model building. CODEm was run
independently by sex for each cause of death. A separate
model was run for countries with 4-star or greater
VR systems to avert uncertainty inflation from more
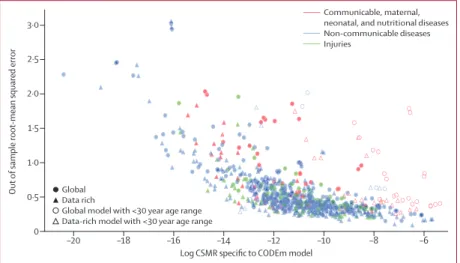
heterogeneous data. The distribution of RMSE relative
to cause-specific mortality rates (CSMRs) at Level 2 of
the GBD hierarchy shows that model performance was
weakest for causes of death with comparatively low
mortality rates (figure 2; appendix 2), while models for
more common causes of death such as stroke, chronic
obstructive pulmonary disease, and self-harm and
interpersonal violence generally had low RMSE.
Cause of death estimation with alternative estimation
strategies
Alternative estimation strategies were used to model a
subset of causes of death with unique epidemiology,
large changes in reporting over time, or particularly
limited data availability, including HIV/AIDS, malaria,
chronic kidney disease, cirrhosis, liver cancer,
men-ingitis, de
mentia, and atrial fibrillation. Alternative
strategies included prevalence-based models, incidence
and case fatality models, and sub-cause proportion
models as described in appendix 1 (section 7).
Mortality-incidence ratio models based on registry data were used
to estimate mortality from 32 cancers (appendix 1
section 3.3). Negative-binomial models were used for
eight causes of death with typically low death counts
or causes that typically have no deaths in countries
with a high Socio-demographic Index (SDI),
includ-ing ascariasis, cystic echinococcosis, cysticer
cosis,
diphtheria, iodine deficiency, other intestinal infectious
diseases, schistosomiasis, and varicella and herpes
zoster virus. Once underlying cause of death estimates
and accompanying uncertainty were generated, these
models were combined with the cause of death
correction procedure (CoDCorrect) to establish estimates
consistent with all-cause mortality levels for each
age-sex-year location.
Estimation of fatal discontinuities
Fatal discontinuities are large changes in deaths due to
unexpected spikes in injuries or epidemics—defined by
GBD as more than one per million or more than
Figure 2: Out-of-sample model performance for CODEm models and age-standardised cause-specific
mortality rate by Level 1 causes
Model performance was defined by the root‐mean squared error of the ensemble model predictions of the log of the age‐specific death rates for a cause with 15% of the data held out from the statistical model building. The figure shows the association between the root‐mean squared error and the log of the CSMR, aggregated over 1980–2017. Each point represents one CODEm model specific for model‐specific age ranges and sex. Circles denote models run with all locations. Triangles denote models run on only data‐rich locations. Colours denote the Level 1 cause categories. Open circles and triangles denote models that were run with restricted age groups of less than 30 years. CODEm=Cause of Death Ensemble model. CSMR=cause‐specific mortality rate.
–20 –18 –16 –14 –12 –10 –8 –6
0
Out
of sample root
-mean squared error
Log CSMR specific to CODEm model 0·5 1·0 1·5 2·0 Global Data rich
Global model with <30 year age range Data-rich model with <30 year age range
Data on fatal discontinuities came from VR data in the
75 countries with a 4-star or 5-star data quality
rat-ing for the interval of 1980–2017. For the remainrat-ing
120 countries with a rating of 3 stars or lower, we used
alternative databases (appendix 1 section 7). Cholera
and meningitis were estimated as fatal discontinuities to
reduce the risk of underestimation for small-magnitude
outbreaks caused by the smoothing of VR or VA data
over time in CODEm. To address lags in reporting and
publishing of data, we included news reports and other
supplemental data sources when known gaps existed.
Further detail about fatal discontinuity estimation is
presented in appendix 1 (section 3.3).
Pathogen counterfactual analysis
Aetiology-specific mortality was estimated for LRIs and
diarrhoeal diseases by use of a counterfactual approach
that relates the frequency of each aetiology in a
population and the association with that aetiology and
either LRI or diarrhoea. LRI and diarrhoea were selected
as initial candidates for this counterfactual analysis
approach given the large disease burden they represent
and the broad interest in interventions, mostly
vaccine-based, to reduce their burden.
19We attributed LRI
deaths to four aetiologies: Haemophilus influenzae
type B pneumonia, Streptococcus pneumoniae
pneum-ococcal pneumonia, influenza, and respiratory syncyt ial
virus pneumonia. Diarrhoeal deaths were
attribu-ted to 13 aetiologies: adenovirus, Aeromonas spp,
Campylobacter spp, Clostridium difficile,
cryptospori-diosis (Cryptosporidium spp), amoebiasis (Entamoeba
histolytica), typical entero patho genic Escherichia coli,
enterotoxigenic E coli, noro
virus, rotavirus,
non-typhoidal Salmonella spp, shigellosis (Shigella spp), and
cholera (Vibrio cholerae). The mortality attributable to
each aetiology is the product of the attributable fraction
and the mortality due to LRI or diarrhoea. The current
counterfactual analysis is an extension of work begun in
GBD 2010, based on the most common pathogens and
available data. This method allows for less common
aetiologies to be added in the future.
YLL computation
Years of life lost (YLLs) are a measure of premature death
calculated as the sum of each death multiplied by the
standard life expectancy at each age. The standard life
expectancy was taken from the lowest observed risk of
death for each five-year age group in all populations
greater than 5 million. In 2017, GBD 2017 included a
new demographic assessment of population, fertility,
migration, and all-cause mortality.
14We used these
(section 4.3).
Decomposition of change in global deaths
Using methods adapted from demographic research
from Das Gupta,
20we decomposed change in numbers of
deaths by cause from 2007 to 2017, using three
ex-planatory components: as change occurring from growth
in the total population; as shifts in population structure
by age; or as changes in cause-specific mortality rates.
We calculated the fraction of change in deaths by cause
from each component using counter factual scenarios,
changing the level of one factor from 2007 to 2017, with
all other factors held constant. Since the effect depends
on the order of entry of the factor, we calculated the
average of all combinations of the three factors. Thus, the
change in global deaths due to shifts in population age
structure could be calculated by comparing the number
of deaths in 2007 to the number of deaths in 2017, using
the population age structure from 2017 and holding both
population size and cause-specific mortality rates at 2007
levels (appendix 1 section 7).
Uncertainty analysis
Uncertainty in our estimates was attributable to
cause-specific model cause-specifications; varied availability of data by
age, sex, location, or year; and variability of sample size
within data sources. We quantified and propagated
uncertainty into final estimates by calculating uncertainty
intervals (UIs) for cause-specific estimation components
based on 1000 draws from the posterior distribu tion
of cause-specific mortality by age, sex, location, and
year.
2195% UIs were calculated with the 2·5th and
97·5th percentiles, and point estimates were calculated
from the mean of the draws. Changes over time were
considered statistically significant when the uncertainty
interval of the percentage change over time did not cross
zero.
Socio-demographic Index and epidemiological
transition analysis
The SDI is a value between 0·0
and 1·0 calculated from
the geometric mean of three rescaled components: total
fertility rate under 25 years (TFRU25), lag-distributed
income per capita (LDI), and average educational
attainment in the population older than 15 years.
22Because the total fertility rate—used in the calculation
of SDI for GBD 2016—has a U-shaped association at
the highest levels of development, for GBD 2017 we
recomputed the SDI using TFRU25
only, an age range for
which the association with development is clearest.
14We
used a generalised additive model with a Loess smoother
All causes 55 945·7 (55 356·4 to 56 516·7) 9·3% (8·2 to 10·2)* (729·9 to 745·4)737·7 (–15·0 to –13·5)*–14·2% (1 622 870·6 to 1 646 249·6 1 673 178·4) –9·0% (–10·1 to –7·6)* (21 601·1 to 21 926·4 22 314·9) –22·2% (–23·2 to –21·0)* Communicable, maternal,
neonatal, and nutritional diseases 10 389·9 (10 004·0 to 10 975·9) –22·2% (–24·0 to –20·0)* (138·4 to 151·6)143·8 (–33·3 to –30·1)*–31·8% (558 815·0 to 578 416·6 600 759·1) –30·4% (–32·4 to –28·2)* (8005·4 to 8280·6 8602·8) –35·4% (–37·3 to –33·4)* HIV/AIDS and sexually
transmitted infections (983·3 to 1073·6 1182·4) –47·7% (–50·0 to –45·1)* (12·6 to 15·5)13·9 (–55·8 to –51·0)*–53·6% (53 533·7 to 60 550·2 69 156·3) –47·3% (–50·2 to –44·0)* 806·4 (703·1 to 936·7) –52·1% (–55·2 to –48·6)* HIV/AIDS 954·5 (907·3 to 1009·7) –50·3% (–52·1 to –48·3)* (11·5 to 12·9)12·1 (–58·0 to –54·7)*–56·5% (47 658·0 to 50 497·1 53 595·8) –51·2% (–52·9 to –49·2)* (617·5 to 696·4)655·1 (–58·1 to –54·8)*–56·6% HIV/AIDS and drug‐susceptible tuberculosis co‐infection 194·6 (137·7 to 253·0) (–58·4 to –51·6)*–55·4% (1·8 to 3·2)2·5 (–63·7 to –57·7)*–61·1% (7613·4 to 13 757·1)10 664·8 (–58·7 to –51·7)*–55·6% (100·2 to 180·0)140·0 (–63·1 to –57·0)*–60·5% HIV/AIDS and multidrug‐
resistant tuberculosis without extensive drug resistance co‐infection
22·6
(13·4 to 34·5) (–66·4 to –33·2)*–52·2% (0·2 to 0·4)0·3 (–70·5 to –41·5)*–58·1% (746·6 to 1906·7)1247·8 (–65·7 to –33·2)*–51·7% (9·8 to 25·1)16·4 (–69·3 to –40·4)*–56·8% HIV/AIDS and extensively
drug‐resistant tuberculosis co‐infection
1·2
(0·8 to 1·8) (–26·8 to 14·7)–8·3% (0·0 to 0·0)0·0 (–36·4 to –0·2)*–20·3% (38·3 to 92·9)62·7 (–28·4 to 11·5)–10·5% (0·5 to 1·2)0·8 (–36·7 to –1·4)*–21·0% HIV/AIDS resulting in other
diseases (659·5 to 817·7)736·0 (–51·1 to –45·9)*–48·7% (8·4 to 10·4)9·3 (–57·2 to –52·6)*–55·1% (34 381·3 to 38 521·8 43 095·5)
–49·8%
(–52·3 to –46·9)* (444·2 to 558·4)497·9 (–57·6 to –52·8)*–55·4% Sexually transmitted
infections excluding HIV (50·8 to 220·4)119·1 (–18·4 to –2·5)*–10·8% (0·7 to 3·3)1·8 (–21·5 to –6·6)*–14·4% (4057·0 to 10 053·1 18 915·2) –11·4% (–19·0 to –3·2)* (60·6 to 285·3)151·3 (–21·8 to –6·6)*–14·4% Syphilis 113·5 (45·2 to 214·5) (–19·1 to –2·8)*–11·3% (0·7 to 3·2)1·7 (–21·8 to –6·4)*–14·3% (3848·5 to 9836·1 18 676·4) –11·5% (–19·3 to –3·1)* (58·0 to 282·3)148·6 (–21·8 to –6·2)*–14·3% Chlamydial infection 1·1 (0·9 to 1·2) (–4·5 to 11·3)2·5% (0·0 to 0·0)0·0 (–21·0 to –8·4)*–15·2% (32·6 to 45·0)40·5 (–12·2 to 2·5)–5·5% (0·4 to 0·6)0·5 (–23·7 to –11·0)*–17·9% Gonococcal infection 3·0 (2·4 to 3·3) (–3·4 to 12·5)3·7% (0·0 to 0·0)0·0 (–20·8 to –8·2)*–14·9% (90·2 to 124·9)112·8 (–10·7 to 4·3)–3·8% (1·1 to 1·6)1·4 (–23·5 to –10·7)*–17·4% Other sexually transmitted
infections (1·2 to 1·7)1·5 (–6·4 to 8·3)0·2% (0·0 to 0·0)0·0 (–21·6 to –9·5)*–15·9% (51·0 to 70·7)63·6 (–12·7 to 1·1)–6·2% (0·6 to 0·9)0·8 (–23·9 to –11·7)*–18·2%
Respiratory infections and
tuberculosis (3629·4 to 3752·3 3889·3) –8·0% (–10·3 to –5·5)* (48·8 to 52·3)50·5 (–26·4 to –22·6)*–24·5% (141 335·1 to 148 233·5 155 291·4) –24·7% (–27·4 to –21·7)* (1956·3 to 2056·0 2160·7) –32·8% (–35·4 to –30·0)* Tuberculosis 1183·7 (1129·8 to 1245·3) –14·9% (–18·2 to –10·3)* (14·3 to 15·7)14·9 (–34·1 to –27·6)*–31·4% (39 972·4 to 41 876·9 44 120·5) –21·2% (–24·4 to –17·4)* (509·1 to 562·6)533·4 (–35·9 to –30·0)*–33·3% Drug‐susceptible tuberculosis (951·6 to 1044·1 1129·2) –15·5% (–22·3 to –8·6)* (12·0 to 14·2)13·2 (–37·3 to –26·4)*–31·9% (33 846·8 to 36 932·5 39 919·1) –21·9% (–27·8 to –16·0)* (431·3 to 508·4)470·7 (–38·7 to –29·0)*–33·8% Multidrug‐resistant tuberculosis without extensive drug resistance
126·9
(70·1 to 202·2) (–47·4 to 38·1)–11·6% (0·9 to 2·5)1·6 (–57·4 to 11·4)–28·6% (2582·5 to 6984·6)4505·1 (–49·4 to 26·5)–17·6% (33·0 to 88·4)57·2 (–56·9 to 6·6)–30·2% Extensively drug‐resistant
tuberculosis (8·6 to 18·0)12·6 (–18·7 to 58·7)14·0% (0·1 to 0·2)0·2 (–34·1 to 28·8)–7·7% (306·2 to 616·5)439·2 (–23·2 to 44·9)5·5% (3·8 to 7·7)5·5 (–35·2 to 22·1)–11·1% Lower respiratory infections 2558·6
(2442·2 to 2655·4) –4·3% (–6·9 to –1·5)* (33·8 to 36·8)35·4 (–23·2 to –18·9)*–21·1% (99 746·4 to 105 834·5 111 767·8) –25·9% (–29·2 to –22·2)* (1424·8 to 1515·1 1602·2) –32·6% (–35·7 to –29·2)* Upper respiratory infections 9·1
(6·1 to 12·4) (–41·0 to –14·5)*–30·5% (0·1 to 0·2)0·1 (–49·6 to –29·9)*–42·1% (247·3 to 730·5)477·3 (–44·1 to –12·9)*–33·2% (3·5 to 10·6)6·9 (–48·3 to –19·4)*–38·6%
Otitis media 0·9
(0·7 to 1·5) (–51·6 to –28·4)*–41·4% (0·0 to 0·0)0·0 (–58·8 to –39·9)*–50·4% (31·2 to 72·1)44·8 (–59·9 to –35·5)*–49·4% (0·4 to 1·0)0·6 (–64·1 to –41·8)*–54·5% (Table 1 continues on next page)
(Continued from previous page) Enteric infections 1766·0 (1398·0 to 2386·0) –17·2% (–24·6 to –8·2)* (19·5 to 32·4)24·4 (–34·9 to –23·1)*–29·9% (73 770·6 to 84 625·5 100 720·2) –30·6% (–36·3 to –23·7)* (1064·1 to 1208·6 1424·7) –36·6% (–41·8 to –30·7)* Diarrhoeal diseases 1569·6 (1176·0 to 2193·0) –16·6% (–25·3 to –6·7)* (16·4 to 29·7)21·6 (–36·1 to –22·7)*–30·2% (60 421·1 to 70 574·3 86 165·2) –32·0% (–38·6 to –23·9)* (870·5 to 1009·1 1211·0) –38·1% (–43·9 to –31·3)* Typhoid and paratyphoid 135·9
(76·9 to 218·9) (–27·3 to –18·1)*–22·3% (1·1 to 3·0)1·9 (–32·8 to –23·9)*–27·8% (5484·9 to 9686·1 15 746·2) –23·8% (–29·3 to –19·4)* (77·0 to 220·9)136·3 (–34·0 to –24·4)*–28·7% Typhoid fever 116·8 (65·4 to 187·7) (–29·0 to –19·3)*–23·7% (0·9 to 2·6)1·6 (–34·1 to –25·0)*–29·1% (4632·5 to 8331·7 13 419·2) –25·3% (–31·0 to –20·8)* (65·5 to 188·5)117·3 (–35·6 to –25·7)*–30·1% Paratyphoid fever 19·1 (8·7 to 37·3) (–20·1 to –4·2)*–12·7% (0·1 to 0·5)0·3 (–26·1 to –10·8)*–18·9% (622·3 to 2620·2)1354·4 (–21·3 to –3·8)*–13·2% (8·8 to 36·6)19·0 (–26·5 to –9·7)*–18·6% Invasive non‐typhoidal salmonella (33·3 to 98·1)59·1 (–25·1 to –8·7)*–17·9% (0·5 to 1·4)0·8 (–31·9 to –15·6)*–24·8% (2382·0 to 7378·6)4260·8 (–25·7 to –6·8)*–17·2% (34·7 to 107·6)61·6 (–30·7 to –12·5)*–22·6% Other intestinal infectious
diseases (1·0 to 2·2)1·4 (–67·1 to 9·7)–39·7% (0·0 to 0·0)0·0 (–70·1 to 2·3)–44·7% (67·8 to 170·7)104·4 (–71·6 to 11·9)–43·6% (1·0 to 2·5)1·5 (–73·7 to 6·3)–46·9%
Neglected tropical diseases
and malaria (530·7 to 720·1 938·8) –29·0% (–37·3 to –19·3)* (7·5 to 13·2)10·1 (–43·7 to –27·3)*–36·1% (35 574·6 to 48 656·2 64 934·2) –33·7% (–42·4 to –23·7)* (508·0 to 699·9 933·6) –38·6% (–46·7 to –29·2)* Malaria 619·8 (440·1 to 839·5) (–39·4 to –20·8)*–30·8% (6·1 to 11·9)8·7 (–45·4 to –27·9)*–37·3% (29 966·3 to 43 546·6 59 772·4) –34·5% (–43·8 to –23·6)* (432·6 to 858·7)629·4 (–48·2 to –28·8)*–39·2% Chagas disease 7·9 (7·5 to 8·6) (–1·6 to 12·9)3·8% (0·1 to 0·1)0·1 (–25·2 to –14·3)*–21·1% (166·1 to 193·5)174·9 (–9·0 to 4·8)–4·2% (2·0 to 2·4)2·2 (–28·9 to –18·1)*–25·1% Leishmaniasis 7·5 (0·0 to 34·5) (–96·8 to –44·5)*–64·8% (0·0 to 0·5)0·1 (–97·5 to –50·3)*–67·8% (0·3 to 2440·2)509·8 (–92·1 to –39·7)*–63·8% (0·0 to 34·6)7·2 (–93·2 to –43·8)*–66·2% Visceral leishmaniasis 7·5 (0·0 to 34·5) (–96·8 to –44·5)*–64·8% (0·0 to 0·5)0·1 (–97·5 to –50·3)*–67·8% (0·3 to 2440·2)509·8 (–92·1 to –39·7)*–63·8% (0·0 to 34·6)7·2 (–93·2 to –43·8)*–66·2% African trypanosomiasis 1·4 (0·3 to 4·9) (–95·6 to –27·8)*–80·7% (0·0 to 0·1)0·0 (–96·0 to –34·3)*–82·8% (15·0 to 283·6)77·6 (–95·6 to –27·2)*–80·8% (0·2 to 3·8)1·0 (–96·0 to –33·6)*–82·3% Schistosomiasis 8·8 (8·0 to 9·8) (–17·6 to –6·4)*–12·3% (0·1 to 0·1)0·1 (–32·7 to –23·7)*–28·5% (305·3 to 384·3)342·3 (–21·9 to –8·8)*–15·6% (3·9 to 5·0)4·4 (–32·9 to –21·4)*–27·4% Cysticercosis 0·7 (0·5 to 1·0) (–42·7 to 23·3)–15·9% (0·0 to 0·0)0·0 (–50·5 to 5·3)–27·3% (26·9 to 55·0)39·6 (–46·9 to 18·2)–20·5% (0·4 to 0·7)0·5 (–52·5 to 4·8)–28·9% Cystic echinococcosis 1·2 (0·9 to 1·5) (–52·1 to –1·3)*–30·0% (0·0 to 0·0)0·0 (–59·8 to –19·0)*–41·9% (38·1 to 68·0)52·0 (–56·8 to –12·9)*–38·8% (0·5 to 0·9)0·7 (–62·0 to –24·1)*–46·4% Dengue 40·5 (17·6 to 49·8) (21·7 to 99·7)*65·5% (0·2 to 0·7)0·5 (3·6 to 69·7)*40·7% (716·6 to 2312·9)1902·9 (–1·8 to 61·2)32·0% (9·8 to 31·7)26·1 (–12·0 to 45·0)18·2% Yellow fever 4·8 (1·0 to 13·8) (–28·7 to –2·0)*–16·6% (0·0 to 0·2)0·1 (–34·4 to –9·6)*–23·3% (67·2 to 900·2)313·9 (–28·9 to 0·0)–16·0% (0·9 to 12·4)4·3 (–33·6 to –5·8)*–21·3% Rabies 11·7 (9·3 to 14·7) (–58·8 to –37·3)*–48·1% (0·1 to 0·2)0·2 (–63·8 to –45·0)*–54·8% (504·4 to 836·4)633·7 (–61·3 to –38·9)*–51·5% (6·8 to 11·5)8·6 (–65·1 to –44·3)*–56·2% Intestinal nematode infections (2·5 to 4·1)3·2 (–56·1 to –25·0)*–43·1% (0·0 to 0·1)0·0 (–59·5 to –30·1)*–47·2% (194·1 to 336·3)257·1 (–57·6 to –25·0)*–44·1% (2·9 to 5·0)3·8 (–60·4 to –29·6)*–47·6% Ascariasis 3·2 (2·5 to 4·1) (–56·1 to –25·0)*–43·1% (0·0 to 0·1)0·0 (–59·5 to –30·1)*–47·2% (194·1 to 336·3)257·1 (–57·6 to –25·0)*–44·1% (2·9 to 5·0)3·8 (–60·4 to –29·6)*–47·6%
Ebola virus disease 0·0
(0·0 to 0·0) (–98·4 to –98·0)*–98·2% (0·0 to 0·0)0·0 (–98·6 to –98·2)*–98·4% (0·5 to 0·5)0·5 (–98·3 to –97·9)*–98·1% (0·0 to 0·0)0·0 (–98·4 to –98·0)*–98·2%
Zika virus disease 0·0
(0·0 to 0·1) ·· (0·0 to 0·0)0·0 ·· (0·2 to 3·4)1·0 ·· (0·0 to 0·0)0·0 ··
Other neglected tropical
diseases (8·0 to 36·3)12·6 (–8·1 to 28·2)8·1% (0·1 to 0·5)0·2 (–18·3 to 13·9)–3·7% (442·8 to 2696·6)804·3 (–16·3 to 29·4)3·9% (6·3 to 39·6)11·6 (–22·2 to 20·7)–3·5% (Table 1 continues on next page)
(Continued from previous page)
Other infectious diseases 830·5 (732·2 to 947·8) –25·9% (–32·4 to –18·8)* (10·1 to 13·3)11·6 (–39·3 to –27·4)*–33·8% (44 786·0 to 53 008·6 63 000·4) –33·0% (–39·6 to –25·1)* (640·5 to 911·5)762·8 (–44·0 to –30·5)*–37·9% Meningitis 288·0 (254·3 to 333·2) (–26·0 to –11·0)*–20·1% (3·6 to 4·6)4·0 (–33·1 to –19·3)*–27·8% (16 935·1 to 19 436·9 22 335·8) –25·2% (–31·5 to –15·7)* (243·6 to 323·2)280·5 (–36·3 to –21·4)*–30·2% Pneumococcal meningitis 42·1 (36·6 to 49·4) (–20·6 to –2·3)*–13·4% (0·5 to 0·7)0·6 (–28·9 to –12·4)*–22·4% (2325·8 to 3276·5)2751·8 (–26·8 to –6·5)*–18·5% (33·4 to 47·0)39·6 (–32·1 to –12·8)*–24·2% H influenzae type B meningitis (66·7 to 92·0)75·7 (–39·6 to –26·0)*–33·7% (0·9 to 1·3)1·1 (–45·8 to –33·9)*–40·6% (4232·2 to 5813·6)4907·3 (–46·1 to –33·0)*–40·4% (60·6 to 83·9)70·5 (–50·1 to –37·7)*–44·7% Meningococcal infection 30·0 (25·7 to 35·7) (–37·4 to –22·8)*–31·5% (0·4 to 0·5)0·4 (–42·6 to –29·2)*–37·1% (1819·8 to 2614·5)2180·3 (–41·4 to –26·4)*–34·9% (26·5 to 38·4)31·9 (–45·0 to –30·5)*–38·8% Other meningitis 140·3 (121·4 to 161·8) (–15·4 to 1·4)–8·9% (1·7 to 2·3)2·0 (–23·4 to –7·5)*–17·3% (8195·6 to 9597·5 11 118·5) –12·8% (–20·4 to –0·7)* (118·3 to 160·5)138·5 (–25·7 to –7·4)*–18·4% Encephalitis 92·4 (83·1 to 107·9) (–14·2 to 16·2)0·0% (1·1 to 1·4)1·2 (–26·5 to –0·9)*–14·3% (4059·5 to 5230·7)4588·2 (–28·1 to 4·5)–12·1% (56·6 to 72·4)64·1 (–35·0 to –5·0)*–20·1% Diphtheria 3·6 (2·2 to 6·1) (–55·6 to 36·4)–23·9% (0·0 to 0·1)0·1 (–58·8 to 29·2)–28·6% (181·8 to 510·0)298·7 (–56·7 to 38·7)–23·9% (2·7 to 7·6)4·4 (–59·5 to 31·4)–28·3% Whooping cough 91·8 (45·9 to 163·2) (–54·8 to 35·6)–23·3% (0·7 to 2·4)1·4 (–57·1 to 28·8)–27·1% (3938·1 to 7879·2 14 010·3) –23·3% (–54·8 to 35·4) (58·9 to 209·6)117·9 (–57·0 to 28·8)–27·1% Tetanus 38·1 (25·9 to 48·8) (–65·9 to –39·1)*–54·9% (0·4 to 0·7)0·5 (–69·3 to –45·0)*–59·6% (1734·9 to 3199·0)2447·7 (–69·9 to –43·5)*–59·3% (25·0 to 46·3)35·1 (–72·1 to –47·0)*–62·1% Measles 95·3 (34·5 to 205·2) (–61·9 to –51·9)*–57·0% (0·5 to 3·1)1·4 (–64·0 to –54·4)*–59·3% (2935·7 to 8105·1 17 469·0) –56·9% (–61·8 to –51·8)* (43·7 to 260·4)120·8 (–63·9 to –54·3)*–59·2% Varicella and herpes zoster 15·6
(14·4 to 17·3) (–22·9 to –9·5)*–16·4% (0·2 to 0·2)0·2 (–34·7 to –23·4)*–29·2% (742·3 to 938·1)833·0 (–31·4 to –13·2)*–22·5% (10·7 to 13·6)12·1 (–36·6 to –19·4)*–28·4% Acute hepatitis 126·4 (94·5 to 143·7) (–15·5 to –2·3)*–9·8% (1·2 to 1·9)1·6 (–29·2 to –18·4)*–24·5% (4040·3 to 6330·0)5478·4 (–27·7 to –14·4)*–21·7% (52·9 to 83·9)72·3 (–36·5 to –24·9)*–31·2% Acute hepatitis A 18·6 (13·6 to 23·8) (–41·9 to –22·5)*–33·1% (0·2 to 0·3)0·3 (–46·8 to –28·6)*–38·7% (935·2 to 1633·7)1286·7 (–45·1 to –24·3)*–36·0% (13·0 to 22·9)18·0 (–49·1 to –29·0)*–40·7% Acute hepatitis B 89·6 (66·1 to 102·5) (–8·4 to 8·5)–0·8% (0·8 to 1·3)1·1 (–25·4 to –12·4)*–19·6% (2367·8 to 3819·1)3262·4 (–19·7 to –2·7)*–12·2% (30·1 to 49·3)41·8 (–31·9 to –17·5)*–25·6% Acute hepatitis C 3·5 (1·9 to 6·0) (–35·9 to –9·4)*–23·7% (0·0 to 0·1)0·0 (–42·4 to –19·6)*–32·1% (120·1 to 371·3)219·7 (–43·3 to –15·3)*–31·0% (1·8 to 5·4)3·2 (–47·2 to –20·7)*–35·5% Acute hepatitis E 14·7 (10·4 to 18·5) (–27·2 to –3·1)*–15·8% (0·1 to 0·2)0·2 (–35·3 to –15·6)*–25·8% (489·6 to 903·9)709·6 (–35·2 to –14·5)*–25·5% (6·4 to 11·8)9·3 (–40·6 to –22·0)*–31·9% Other unspecified infectious
diseases (59·9 to 85·1)79·3 (–3·1 to 7·9)1·6% (0·8 to 1·2)1·1 (–17·5 to –8·1)*–13·4% (2831·7 to 4325·8)3941·3 (–16·2 to –2·4)*–10·2% (39·6 to 61·3)55·6 (–23·6 to –10·6)*–17·9%
Maternal and neonatal
disorders (1890·1 to 1977·4 2060·6) –24·1% (–26·9 to –21·0)* (28·2 to 30·8)29·5 (–29·3 to –23·5)*–26·6% (160 060·7 to 167 684·6 174 918·2) –24·2% (–27·1 to –20·9)* (2403·8 to 2518·2 2627·1) –26·5% (–29·3 to –23·3)* Maternal disorders 193·6 (179·9 to 209·6) (–28·4 to –19·5)*–24·0% (2·3 to 2·7)2·5 (–34·8 to –26·6)*–30·7% (10 198·9 to 10 993·1 11 928·5) –25·3% (–29·7 to –20·9)* (130·8 to 153·0)140·9 (–35·5 to –27·5)*–31·5% Maternal haemorrhage 38·5 (33·2 to 45·2) (–59·0 to –44·2)*–52·1% (0·4 to 0·6)0·5 (–62·7 to –49·3)*–56·4% (1859·7 to 2552·5)2173·8 (–60·1 to –45·0)*–53·0% (23·8 to 32·7)27·8 (–63·6 to –49·7)*–57·1% Maternal sepsis and other
pregnancy‐related infections 21·2 (18·2 to 25·0) (–38·8 to –15·1)*–27·1% (0·2 to 0·3)0·3 (–44·2 to –22·6)*–33·5% (1022·8 to 1420·8)1198·0 (–41·1 to –16·2)*–28·9% (13·1 to 18·3)15·4 (–45·4 to –22·5)*–34·5% Maternal hypertensive disorders (25·4 to 34·5)29·4 (–20·7 to 11·2)–5·5% (0·3 to 0·4)0·4 (–27·3 to 2·6)–13·0% (1487·6 to 2033·2)1729·6 (–22·1 to 10·2)–6·6% (19·2 to 26·4)22·3 (–28·1 to 2·0)–13·6% Maternal obstructed labour
and uterine rupture (10·2 to 16·8)13·0 (–35·9 to 2·9)–17·7% (0·1 to 0·2)0·2 (–41·0 to –6·3)*–25·2% (565·5 to 946·4)720·9 (–37·6 to 1·9)–18·9% (7·2 to 12·1)9·2 (–42·9 to –6·9)*–25·8% (Table 1 continues on next page)
(Continued from previous page) Maternal abortive outcome 17·4
(14·7 to 20·8) (–22·3 to 10·1)–7·0% (0·2 to 0·3)0·2 (–29·3 to –0·4)*–15·7% (807·6 to 1161·1)963·4 (–24·2 to 8·7)–8·9% (10·3 to 14·9)12·3 (–30·7 to –0·5)*–16·8%
Ectopic pregnancy 10·2
(7·1 to 15·2) (–41·4 to 27·9)–11·6% (0·1 to 0·2)0·1 (–46·2 to 16·8)–19·2% (409·0 to 881·4)590·6 (–43·8 to 26·9)–13·3% (5·3 to 11·4)7·6 (–48·1 to 17·0)–20·3% Indirect maternal deaths 34·1
(30·0 to 38·7) (–16·7 to 8·5)–4·1% (0·4 to 0·5)0·4 (–24·0 to –1·0)*–12·5% (1694·2 to 2216·7)1934·4 (–19·2 to 6·8)–6·1% (21·7 to 28·5)24·8 (–25·8 to –2·3)*–13·9% Late maternal deaths 3·4
(2·6 to 4·3) (–7·0 to 5·5)–0·9% (0·0 to 0·1)0·0 (–14·7 to –4·0)*–9·5% (152·2 to 251·4)194·7 (–8·2 to 4·1)–2·0% (2·0 to 3·2)2·5 (–15·4 to –4·5)*–10·1% Maternal deaths
aggravated by HIV/AIDS (1·0 to 2·1)1·6 (–31·0 to –16·0)*–23·9% (0·0 to 0·0)0·0 (–38·4 to –25·2)*–32·1% (53·0 to 113·8)84·4 (–33·6 to –19·2)*–26·7% (0·7 to 1·4)1·1 (–40·6 to –27·5)*–34·2% Other maternal disorders 24·8
(20·8 to 29·8) (–24·7 to 11·2)–8·5% (0·3 to 0·4)0·3 (–31·2 to 1·5)–16·5% (1159·5 to 1690·3)1403·1 (–26·7 to 10·8)–9·8% (14·9 to 21·7)18·0 (–32·9 to 1·2)–17·2% Neonatal disorders 1783·8 (1698·5 to 1864·7) –24·1% (–27·2 to –20·6)* (25·8 to 28·3)27·1 (–29·1 to –22·7)*–26·2% (149 207·2 to 156 691·6 163 802·2) –24·1% (–27·2 to –20·6)* (2263·7 to 2377·2 2485·1) –26·2% (–29·1 to –22·7)* Neonatal preterm birth 649·4
(605·4 to 721·3) (–31·3 to –21·5)*–26·2% (9·2 to 10·9)9·9 (–33·2 to –23·6)*–28·1% (53 182·3 to 57 052·0 63 367·1)
–26·2%
(–31·3 to –21·5)* (806·9 to 961·5)865·6 (–33·2 to –23·6)*–28·1% Neonatal encephalopathy
due to birth asphyxia and trauma 533·3 (476·9 to 580·3) –24·5% (–30·2 to –18·0)* (7·2 to 8·8)8·1 (–32·0 to –20·2)*–26·5% (41 894·1 to 46 845·9 50 985·7) –24·5% (–30·2 to –18·0)* (635·7 to 773·7)710·8 (–32·0 to –20·2)*–26·5% Neonatal sepsis and other
neonatal infections (178·7 to 267·1)203·0 (–20·5 to –1·7)*–11·9% (2·7 to 4·1)3·1 (–22·7 to –4·4)*–14·4% (15 692·9 to 17 830·7 23 459·0)
–11·9%
(–20·5 to –1·7)* (238·0 to 355·8)270·4 (–22·7 to –4·4)*–14·4% Haemolytic disease and
other neonatal jaundice (42·9 to 55·9)49·1 (–45·3 to –28·2)*–37·5% (0·7 to 0·8)0·7 (–46·8 to –30·2)*–39·3% (3771·2 to 4914·0)4309·1 (–45·3 to –28·2)*–37·5% (57·2 to 74·5)65·4 (–46·8 to –30·2)*–39·3% Other neonatal disorders 349·0
(294·9 to 382·3) (–29·8 to –15·5)*–23·6% (4·5 to 5·8)5·3 (–31·7 to –17·8)*–25·7% (25 899·7 to 30 654·0 33 578·7) –23·6% (–29·8 to –15·5)* (392·9 to 509·4)465·0 (–31·7 to –17·8)*–25·7% Nutritional deficiencies 270·0 (249·3 to 295·5) –23·9% (–29·2 to –15·7)* (3·5 to 4·2)3·8 (–38·1 to –26·5)*–33·6% (14 051·5 to 15 658·0 17 506·6) –34·7% (–40·5 to –26·1)* (204·9 to 228·7 255·9) –39·4% (–44·8 to –31·4)* Protein‐energy malnutrition 231·8 (212·4 to 254·2) (–31·7 to –17·9)*–26·1% (3·0 to 3·7)3·3 (–39·4 to –27·5)*–34·6% (12 873·5 to 14 405·4 16 128·0) –35·1% (–41·1 to –26·7)* (189·0 to 237·3)211·8 (–45·0 to –31·6)*–39·4% Other nutritional deficiencies 38·2
(33·7 to 44·6) (–14·6 to 3·1)–7·2% (0·4 to 0·6)0·5 (–31·7 to –17·5)*–25·8% (1087·5 to 1435·2)1252·7 (–36·9 to –19·7)*–29·2% (14·6 to 19·5)16·9 (–45·4 to –30·4)*–38·6% Non-communicable diseases 41 071·1 (40 470·9 to 41 548·9) 22·7% (21·5 to 23·9)* (528·4 to 542·2)536·1 (–8·8 to –7·0)*–7·9% (859 538·6 to 872 601·8 884 787·7) 13·6% (12·2 to 14·9)* (10 928·6 to 11 097·4 11 253·8) –9·6% (–10·7 to –8·6)* Neoplasms 9556·2 (9395·7 to 9692·3) 25·4% (23·9 to 27·0)* (119·1 to 122·9)121·2 (–5·6 to –3·3)*–4·4% (221 608·8 to 225 738·1 229 322·4) 19·6% (17·8 to 21·4)* (2751·5 to 2803·4 2848·8) –5·6% (–7·0 to –4·1)*
Lip and oral cavity cancer 193·7
(184·7 to 201·6) (29·5 to 40·8)*35·6% (2·3 to 2·5)2·4 (–0·6 to 8·0)4·0% (4819·5 to 5328·3)5090·6 (23·8 to 36·4)*30·5% (58·9 to 65·1)62·2 (–2·3 to 7·6)3·0%
Nasopharynx cancer 69·5
(66·9 to 72·3) (20·0 to 28·8)*24·4% (0·8 to 0·9)0·9 (–6·4 to 0·4)–3·0% (1954·7 to 2117·4)2034·5 (13·9 to 23·1)*18·3% (23·8 to 25·8)24·8 (–8·5 to –1·3)*–5·0% Other pharynx cancer 117·4
(102·1 to 124·5) (29·7 to 48·4)*40·4% (1·3 to 1·5)1·4 (–0·3 to 14·0)7·9% (2766·3 to 3405·1)3204·2 (25·4 to 44·2)*36·0% (33·5 to 41·3)38·9 (–1·7 to 12·8)6·5% Oesophageal cancer 436·0 (425·0 to 447·6) (9·9 to 16·3)*13·0% (5·3 to 5·6)5·5 (–16·9 to –12·0)*–14·5% (9410·7 to 9903·5)9647·5 (5·8 to 12·2)*8·9% (115·4 to 121·4)118·3 (–18·6 to –13·7)*–16·2% Stomach cancer 865·0 (848·3 to 884·7) (7·1 to 12·1)*9·4% (10·8 to 11·2)11·0 (–18·8 to –15·1)*–17·1% (18 409·7 to 18 782·0 19 207·7) 4·8% (2·4 to 7·4)* (227·0 to 236·8)231·6 (–20·5 to –16·6)*–18·6% Colon and rectum cancer 896·0
(876·3 to 915·7) (24·0 to 31·3)*27·8% (11·3 to 11·8)11·5 (–7·1 to –1·8)*–4·3% (17 678·0 to 18 106·7 18 525·0)
23·8%
(19·2 to 27·6)* (219·4 to 229·9)224·7 (–8·0 to –1·7)*–4·5% (Table 1 continues on next page)
(Continued from previous page) Liver cancer 819·4 (789·7 to 855·5) (23·0 to 32·9)*27·0% (9·8 to 10·7)10·2 (–5·6 to 2·0)–2·5% (19 678·7 to 20 536·2 21 551·9) 21·2% (17·0 to 27·4)* (240·4 to 263·0)250·7 (–8·0 to 0·1)–4·6% Liver cancer due to
hepatitis B (304·6 to 325·4 348·2) 20·3% (15·3 to 28·2)* (3·7 to 4·3)4·0 (–10·0 to 0·1)–6·2% (8837·3 to 9449·0 10 138·6) 14·7% (9·7 to 21·9)* (107·3 to 123·0)114·6 (–12·2 to –2·6)*–8·4% Liver cancer due to
hepatitis C (219·4 to 250·6)234·3 (26·7 to 35·0)*30·4% (2·8 to 3·2)3·0 (–4·9 to 1·4)–2·1% (4554·0 to 5259·3)4898·4 (23·3 to 31·6)*26·9% (56·2 to 64·7)60·3 (–5·8 to 0·5)–3·0% Liver cancer due to alcohol
use (114·5 to 147·3)129·3 (26·8 to 37·3)*31·7% (1·4 to 1·8)1·6 (–3·0 to 4·8)0·6% (2647·6 to 3549·8)3040·7 (22·4 to 33·9)*27·8% (32·5 to 43·3)37·2 (–4·5 to 3·9)–0·6% Liver cancer due to NASH 66·9
(59·6 to 74·5) (38·0 to 47·6)*42·3% (0·8 to 0·9)0·8 (4·4 to 11·7)*7·6% (1288·9 to 1605·9)1443·8 (32·7 to 42·8)*37·3% (15·9 to 19·7)17·8 (2·9 to 10·5)*6·3% Liver cancer due to other
causes (57·4 to 70·6)63·5 (23·6 to 34·3)*28·2% (0·7 to 0·9)0·8 (–4·2 to 3·6)–0·9% (1528·4 to 1903·8)1704·2 (16·0 to 27·4)*21·1% (18·8 to 23·3)20·9 (–7·2 to 1·4)–3·5% Gallbladder and biliary tract
cancer (154·2 to 184·9)174·0 (21·5 to 28·7)*25·0% (2·0 to 2·4)2·2 (–9·4 to –4·0)*–6·7% (3009·7 to 3660·0)3434·0 (17·8 to 26·3)*21·8% (37·3 to 45·4)42·6 (–9·9 to –3·5)*–6·8%
Pancreatic cancer 441·1
(432·8 to 449·0) (36·7 to 42·6)*39·9% (5·5 to 5·7)5·6 (2·5 to 6·8)*4·8% (8806·6 to 9162·9)8988·1 (32·5 to 38·6)*35·8% (108·9 to 113·2)111·1 (1·5 to 6·1)*4·0%
Larynx cancer 126·5
(123·4 to 129·9) (17·8 to 24·4)*21·1% (1·5 to 1·6)1·6 (–10·1 to –5·2)*–7·7% (3089·7 to 3260·3)3170·0 (13·9 to 20·9)*17·3% (37·6 to 39·6)38·5 (–11·7 to –6·4)*–9·1% Tracheal, bronchus, and lung
cancer (1844·2 to 1883·1 1922·8) 29·6% (26·5 to 32·5)* (23·3 to 24·2)23·7 (–4·3 to 0·1)–2·0% (39 506·7 to 40 391·6 41 285·6) 24·8% (21·7 to 27·6)* (485·5 to 507·2)496·4 (–6·5 to –2·0)*–4·1% Malignant skin melanoma 61·7
(47·9 to 70·3) (19·0 to 26·9)*23·6% (0·6 to 0·9)0·8 (–8·5 to –2·5)*–5·1% (1220·7 to 1774·4)1513·2 (12·7 to 20·0)*16·1% (15·1 to 21·9)18·7 (–9·8 to –3·8)*–7·2% Non‐melanoma skin cancer 65·1
(63·1 to 66·5) (34·9 to 41·2)*38·6% (0·8 to 0·9)0·8 (0·0 to 4·5)*2·7% (1200·2 to 1266·6)1239·1 (26·2 to 32·7)*30·0% (15·0 to 15·8)15·5 (–2·3 to 2·6)0·5% Non‐melanoma skin cancer
(squamous‐cell carcinoma) (63·1 to 66·5)65·1 (34·9 to 41·2)*38·6% (0·8 to 0·9)0·8 (0·0 to 4·5)*2·7% (1200·2 to 1266·6)1239·1 (26·2 to 32·7)*30·0% (15·0 to 15·8)15·5 (–2·3 to 2·6)0·5% Breast cancer 611·6 (589·2 to 640·7) (21·3 to 31·2)*27·0% (7·4 to 8·0)7·6 (–6·9 to 0·4)–2·6% (15 737·0 to 16 400·7 17 320·2) 23·9% (17·3 to 28·7)* (192·1 to 211·4)200·2 (–6·8 to 2·1)–1·7% Cervical cancer 259·7 (241·1 to 269·2) (12·9 to 22·8)*18·8% (3·0 to 3·3)3·2 (–11·7 to –4·0)*–7·2% (7227·4 to 8087·8)7773·5 (9·4 to 19·1)*15·1% (88·1 to 98·5)94·6 (–11·8 to –3·9)*–7·2% Uterine cancer 85·2 (83·2 to 87·4) (15·8 to 22·5)*18·8% (1·0 to 1·1)1·1 (–12·5 to –7·7)*–10·4% (1879·9 to 1983·0)1930·0 (11·6 to 19·0)*14·8% (23·1 to 24·3)23·7 (–13·7 to –8·0)*–11·2% Ovarian cancer 176·0 (171·4 to 181·2) (26·8 to 33·7)*30·3% (2·1 to 2·3)2·2 (–3·6 to 1·6)–1·0% (4370·7 to 4642·1)4496·9 (24·8 to 33·1)*29·1% (53·4 to 56·7)54·9 (–2·2 to 4·2)1·1% Prostate cancer 415·9 (357·3 to 489·5) (29·3 to 38·4)*32·5% (4·7 to 6·5)5·5 (–4·9 to 1·9)–2·5% (5324·2 to 7293·0)6214·5 (24·9 to 34·5)*28·3% (68·1 to 93·0)79·3 (–6·2 to 1·2)–3·6% Testicular cancer 7·7 (7·4 to 8·0) (2·3 to 10·9)*6·1% (0·1 to 0·1)0·1 (–12·6 to –5·2)*–9·4% (323·8 to 357·4)338·7 (–3·3 to 6·3)0·9% (4·1 to 4·5)4·3 (–14·5 to –6·1)*–10·8% Kidney cancer 138·5 (128·7 to 142·5) (26·2 to 34·1)*30·1% (1·6 to 1·8)1·8 (–4·3 to 1·7)–1·3% (2952·2 to 3234·1)3143·3 (18·5 to 27·3)*23·1% (37·0 to 40·5)39·4 (–6·9 to 0·0)–3·3% Bladder cancer 196·5 (191·5 to 205·8) (25·1 to 30·4)*27·8% (2·5 to 2·7)2·6 (–7·3 to –3·4)*–5·4% (3257·4 to 3511·6)3350·1 (19·9 to 25·3)*22·6% (41·0 to 44·1)42·2 (–8·9 to –4·8)*–6·9% Brain and nervous system
cancer (213·0 to 265·0)247·1 (23·2 to 33·4)*29·2% (2·7 to 3·3)3·1 (–1·0 to 7·0)3·8% (7527·0 to 9359·3)8577·8 (11·9 to 24·6)*18·4% (96·1 to 120·0)109·8 (–5·6 to 5·3)0·0% Thyroid cancer 41·2 (39·9 to 44·1) (24·3 to 33·3)*28·9% (0·5 to 0·6)0·5 (–4·5 to 2·0)–1·2% (963·6 to 1074·0)1001·2 (16·7 to 28·0)*22·1% (12·0 to 13·4)12·4 (–6·6 to 2·4)–2·3% Mesothelioma 29·9 (29·1 to 30·6) (20·1 to 32·6)*26·9% (0·4 to 0·4)0·4 (–8·4 to 0·7)–3·4% (635·2 to 677·0)655·7 (13·8 to 27·3)*21·0% (7·9 to 8·4)8·1 (–10·8 to –0·8)*–5·4% Hodgkin lymphoma 32·6 (27·6 to 38·1) (–3·5 to 3·6)0·2% (0·4 to 0·5)0·4 (–19·8 to –14·0)*–16·8% (1110·1 to 1567·7)1327·6 (–8·6 to –1·8)*–5·2% (14·3 to 20·2)17·1 (–20·1 to –13·9)*–17·1% (Table 1 continues on next page)