A Work Project, presented as part of the requirements for the Award of a Masters Degree in Finance from the NOVA – School of Business and Economics
Market Value of Corruption
Luís Guilherme Mendonça de Almeida
Student Number 720A Project carried out under the supervision of: Professor Miguel Ferreira
2
Market Value of Corruption
Abstract
This paper studies the impact of the Brazilian anticorruption legislation, PL 6826/2010, on stock returns. I show that, around the law approval date, the greater the link between the corporate and political worlds, the worse is the companies’ performance. Companies awarded with public contracts in 2012 suffer more with the new legislation approval. Firms with above median contract values have 2.9% lower returns than its peers. The negative effect is more pronounced for bigger and more complex entities, associated with higher levels of Corporate Responsibility and Governance and not subject to the US FCPA.
3
Acknowledgments
I thank to Professor Miguel Ferreira for the opportunity to work on this challenging subject as well as for his insightful and patient guidance. To my girlfriend and parents a warm thanks for all the support.
1. Introduction
“Corruption is an ancient problem” (Bardhan, 1997). It is one of the biggest threats to economic and social development. According to the OECD – Organization for Economic Co-operation and Development, in its Convention on Combating Bribery of Foreign Public Officials in International Business Transactions, corruption is a worldwide problem. It “refers to acts in which the power of public office is used for personal gain in a manner that contravenes the rules of the game” (Jain, 2002). Does it create or destroy value? Is it essential to develop business or is it an obstacle? Theories go in both directions. On the one hand, investors may decide not to put their money in markets perceived as corrupt, adversely affecting firms. On the other hand, investors may price corruption and ask for greater returns.
This Work Project studies the impact of the Brazilian Anticorruption Law, PL 6826/2010, approved on the 24th of April, 2013. It assesses whether the possibility to use bribes affects firm value. As a matter of fact, Brazil is a good opportunity to analyze this subject. The criminal cases that shed light on intimate connections between politicians and companies, the limited level of institutional development and the scores on the Transparency International’s Perceived Corruption Index (CPI), show that Brazil is prone to such practices.1 A recent study by Global Financial Integrity states that every
4 year $30 billion from illegal activities, including corruption, leave Brazil. This corresponds to 1.5% of the total wealth generated by the country2.
Zeume (2014) presents two interesting views on the consequences of approving this kind of laws. “If firms use bribes as an investment to create firm value, the passage of costly anti-bribery regulation should destroy firm value. Alternatively, managers might use bribes for their personal benefits: in this case, anti-bribery regulation punishing individual managers for the use of bribes would create firm value.”
To assess the effect of corruption, I use an event study approach around the law approval. The dependent variable is the firms’ cumulative abnormal stock returns ranging two days before and after the event date. The connections between the corporate and political worlds are highlighted by variables such as public contracts and political campaign contributions. In this regard, I examine whether firms that hold significant relationships with the Brazilian Government are more or less affected. Furthermore, the study focuses, through a cross-sectional analysis, on firms’ governance and institutional practices, as well as on further legal codes they have to comply with. Concerning this matter, I examine if companies that are cross-listed, part of BM&FBovespa Corporate Social Responsibility Index, Special Corporate Governance Stock Index, and with higher levels of institutional ownership are more or less affected.
The structure of this Work Project is as follows. Section 2 presents previous literature on the subject. Section 3 offers a review of anti-corruption legislation, as well as a presentation of the new Brazilian law. Section 4 describes data sample and selection criteria. Section 5 goes through all the results and their interpretation. Section 6 concludes. References and appendices may be found at the end.
2 See:
5
2. Literature Review
The relation between corruption and financial factors, along with its consequences, has motivated a significant amount of research. Ayadin and Baltaci (2013) argue that “there is a negative relation between the levels of corruption and financial system improvement”. The authors add that an increase in a country’s corruption level is an obstacle to a country's own development. Lee and Ng (2006) show that firms from more corrupt countries trade at significantly lower market multiples. Actually, corruption is associated to several social and economic problems, such as lower growth rates (Mo, (2000), reduction of foreign direct investment (Wei, 1997), inferior government revenues, expenditures on operations and maintenance, as well as a decrease of public infrastructures quality (Tanzi and Davoodi, 1997).
To assess the impact of corruption is a challenge. Many cases are never discovered, and revealing the effects of the ones that are is difficult. Cheung et al. (2012), by looking at 166 bribery cases of government officials in 52 countries from 1971 to 2007, verified that a $1 bribe payment creates an $11 value.
It is worth to highlight that “the incentive for corporations to become politically connected has been recognized among economists for many years and has probably been recognized by citizens of affected countries for many more.” (Faccio, 2014). The author identifies several incentives for firms to promote political connections. Preferential treatment by government-owned enterprises, lower taxation, advantage in competitions for public contracts, relaxed regulatory oversight, or tougher regulatory control over its competitors are some examples. As a matter of fact, Carvalho (2014) explores the idea that political considerations influence the lending decisions of government banks. The paper investigates lending by Brazilian government banks and
6 firms’ employment decisions. It shows that politicians use lending by banks to influence the real behavior of companies. In reality, “firms eligible for government bank lending expand employment in politically attractive regions near elections” and “these persistent expansions take place just before competitive elections.” In Brazil, the connection between companies and political forces is a subject of concern. Claessens et al. (2006) show that “Brazilian firms that provided contributions to (elected) federal deputies experienced higher stock returns around the 1998 and 2002 elections.”
In line with the challenge this Work Project seeks to address, is the paper written by Zeume (2014). The author studies the passage of the UK Bribery Act 2010 in order to assess if the use of bribes creates firm value. This piece of legislation is extremely harsh and imposes severe penalties on firms. The research looks at corruption from the supply side. Therefore, “if firms use bribes as an investment to create firm value, the passage of costly anti-bribery regulation should destroy firms’ value”. While the economic literature concludes, in general, that corruption slows down growth and destroys welfare, the author shows “that firms benefit from the ability to use bribes.” He adds that “in a setting where some firms continue to use bribes, unilateral anti-bribery regulation destroys firm value of regulated firms and hence hurts shareholders.” UK firms operating in high corruption regions of the world display negative abnormal returns upon the passage of the Act. A firm operating exclusively in the most corrupt regions suffers a 6.2% drop in value compared to a firm operating in the least corrupt regions. The effect is stronger for firms not already subject to US anti-bribery regulation, not part of corporate social responsibility indices, operate in concentrated industries, and with better governance. This lays down the basis to the next sections.
7
3. Projecto de Lei 6826/2010
The approval of Projecto de Lei 6826/2010 defines a turning point in the Brazilian legal landscape. After years of ignoring its international obligations, Brazil saw, for the first time in its history, the enactment of a strong anticorruption legislation.
The international community has, for a long a period, highlighted the urgency of this issue. As a matter of fact, the OECD Anti-Bribery Convention came into force on the 15th of February 1999. Signed on the 17th of December 1997, by 34 member countries and 7 non-member countries, including Brazil, the OECD aims at reducing corruption. “The Parties shall co-operate in carrying out a programme of systematic follow-up to monitor and promote the full implementation of this Convention.”3
Nevertheless, until 1997 the United States of America was the only country with a strong anticorruption law. The Foreign Corrupt Practices Act (FCPA), enacted in 1977, established as unlawful, for certain classes of persons and entities, the payments to foreign government officials to assist in obtaining or retaining business.4 As a result of lengthy investigations conducted by the Securities and Exchange Commission (SEC) in the mid-1970’s, over 400 American companies admitted to be making questionable or illegal payments in excess of $300 million to a wide range of foreign governmental employees, officials and political parties.5 Companies argued that such behaviors were essential for its competitiveness. The Act targets any U.S. company or foreign company that registers or issues securities subject to the SEC Act of 1934, as well as any individual, whether a U.S. citizen or not, and any company or business entity, organized under U.S. laws or using the U.S. as its main place of business.
3
Convention on Combating Bribery of Foreign Public Officials in International Business Transactions – Article 12.
4 The United States Department of Justice (see http://www.justice.gov/criminal/fraud/fcpa/).
5 See:
8 More recently the UK passed the UK Bribery Act 2010. It creates offences of offering or receiving bribes, bribery of foreign public officials and of failure to prevent a bribe being paid on an organization’s behalf.6
Harsher than the FCPA, it makes it both passive and active bribery7 a criminal offence, while the FCPA only targets the latter.
The Brazilian new legislation, approved on the 24th of April 2013,8 came into force on January 2014.9 It is a response to international pressure, internal conflicts and protests by the people. The previous legislation, composed by the 1992 Administrative Improbity Law and the 1993 Bidding Law was extended by the PL 6826/2010. A major step forward has been given in a country where anticorruption legislation would only go after physical persons even though these may have acted on a company’s behalf. The entity would only have its name registered on a criminal record and be forbidden to participate in public bidding processes for a certain period of time. One of its main contributions is the introduction of strict liability. According to such legal principle, if a company is found to have benefited of any illegal acts committed by its employees, it will be held responsible.10 It applies to both national and international juridical persons with Brazilian operations.11 This addresses the argument that national companies would be at a competitive disadvantage in relation to international firms.
At the administrative sphere, contrary to the civil’s, there is no need to prove in court whether there was or not intention to commit the crime. Regardless of guilt the company will be punished. The penalties are quite severe. A company may have to pay
6 The Bribery Act 2010 Guide by the Ministry of Justice. 7
Zeume (2014): Active bribery is defined by the Act as offering, giving, or promising to give a financial or other advantage to a person in exchange for that person to improperly perform a relevant function. This includes bribery of foreign public officials and other firms. Passive bribery is defined as receiving or agreeing to receive a financial or other advantage in exchange for improperly performing a relevant function.
8 See Comissão vota projeto anticorrupção. Econômico Valor April 24th, 2013.
9 See:http://www3.ethos.org.br/cedoc/lei-anticorrupcao-beneficia-empresas-responsaveis/#.U-tdNvldVqU 10 Projecto de Lei 6826/2010 – Article 2.
9 fines that vary from 0.1% to 20% of the annual revenue. In case it is not possible to accurately determine the entity’s revenue, this will have to pay values ranging from R$ 6 thousand to R$ 60 million. However, the law goes beyond pecuniary penalties. Prohibition to borrow funds from public financial institutions, loss of assets, contract termination with the Government and partial or total activity suspension are some examples.12
4. Data
In order to assess whether corruption affects firm valuation, I study cumulative abnormal stock returns by using several variables. An event study approach around the approval date of the anticorruption law is used.
This part of the Work Project presents the data, as well as the sample selection and criteria used. The results are based on the daily returns of Brazilian publicly listed companies. Firms without returns on April 24th, 2013 are not included. The sample includes 316 companies registered in BM&FBOVESPA.
The dependent variable, CAR [-2;2], is the firms’ cumulative abnormal stock returns on the day, two days before and two days after the passage of the PL 6826/2010. The CAR is calculated by the sum of differences between each company’s daily returns and the market’s. The analysis focuses on the period between the 22nd
to the 26th of April, 2013. Furthermore, two additional event windows are presented. First, the CAR [-17;-3] for the period ranging from the 1st to the 19th of April. Second, the CAR [3; 17] for the period from the 29th of April until the 17th of May. Consequently, the number of companies, due to a mismatch of available returns included on the different event
12
10 windows, slightly differs. The match of the three event windows leaves us with a final sample of 312 firms.
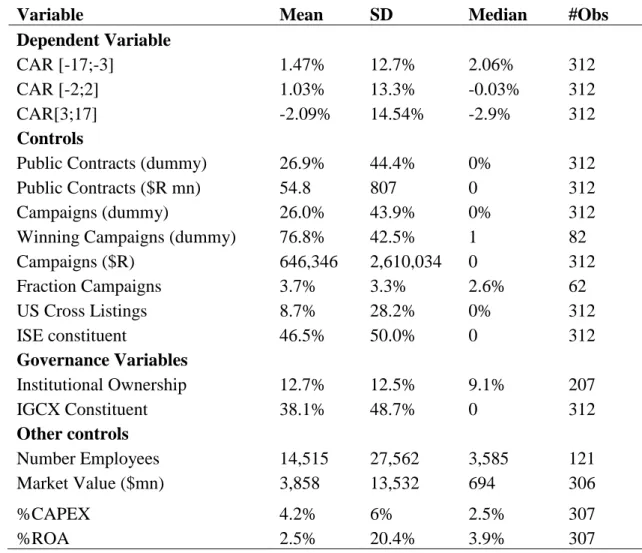
Table 1 presents the descriptive statistics for all variables. The mean of the cumulative abnormal returns around the event date is 1.03%. Before and after the event, the cumulative abnormal returns are, on average, 1.47% and -2.09%, respectively. These results may already suggest the effect of the legislation.
Regarding explanatory variables one of the first considered is the companies’ corruption record.13 Created by the Controladoria Geral da União, an entity of the Brazilian Federal Government, this list has all the companies that failed to comply with anti-corruption legislation. In our sample only two companies have a criminal record. Therefore, the variable is left out of the analysis.14
With the intent to define Corruption Exposure and emphasize the connection between politics and the corporate world, public contracts awarded in 2012,15 as well as donation for the 2010 general election campaigns,16 are analyzed. Six different variables are created. The first, and most important, is a dummy that equals 1 if a company gained a public contract in 2012 and zero otherwise. It assumes special relevance as this will define Corruption Exposure in this Work Project. The second is the contracts’ value. They average 26.9% and $R 54,800,000, respectively. Concerning the 2010 campaigns, based on data from Tribunal Superior Eleitoral, two dummy variables are included. The first is equal to 1 if a company contributed to a campaign, while the second is more restrictive and only differs from zero if the firm sponsored a winning candidate. On
13 Cadastro de Empresas Inidóneas (see: www.portaltransparencia.gov.br/ceis/Consulta.seam)
14 This reference is made to highlight how limited the previous legislation and the criminal system were.
In a country permeated by corrupt practices is quite difficult to understand how only two firms show up in this list. This is probably related with the fact that the previous laws would only punish physical persons even though these may have acted on a company’s behalf.
15 See: http://www.politicaaberta.org/ranking/1 16 See: http://www.asclaras.org.br/@index.php
11 average, 26% of the companies contributed to candidates’ campaigns, while targeting 76.8% of the winners. Moreover, it is given attention to the absolute amounts of a firm’s sponsorship to candidates. Its mean is $R 646,346. The last sub-measure is based on a firm’s contribution as a fraction of total contributions received by a winning candidate. It points out that establishing a connection with a candidate may be more challenging if he or she already receives large amounts of money from other companies. It averages 3.7%.
Some firms are more likely to be affected by the anti-corruption law. For instance, some have to comply with further regulation. Therefore, Cross-Listings serve as an indicator that companies are subject to the FCPA. 8.7% of the firms have an American Depositary Receipt (ADR).
Furthermore, several companies have joined BM&FBOVESPA Corporate Social Responsibility Index – ISE (Índice de Sustentabilidade Empresarial).17 Its constituents are recognized to be responsible from the standpoint of corporate sustainability, based on economic efficiency, environmental equilibrium, social justice and corporate governance. “It enhances public understanding of companies and groups committed to sustainability, differentiating them in terms of quality, level of commitment to sustainable development, equity, transparency and accountability, and the nature of their products, as well as business performance in the economic, financial, social, environmental and climate change dimensions.”18 The present Work Project looks at the ISE portfolio from 2nd of January to the 31st of December, 2012. It is created a dummy equal to 1 if the firm was ISE constituent and zero otherwise. 46.5% of the companies were, in the mentioned time range, part of the index.
17 See:
http://www.bmfbovespa.com.br/indices/ResumoIndice.aspx?Indice=ISE&Opcao=0&idioma=en-us
12 To analyze firm governance, two variables are created. First, following the same procedure as Zeume (2014), based on Ferreira and Matos (2008), institutional ownership is included. This is the percentage of firm’s market capitalization held by foreign institutional investors. The authors find that “firms with higher ownership by foreign and independent institutions have higher firm valuations, better operating performance” indicating that “foreign and independent institutions, with potentially fewer business ties to firms, are involved in monitoring corporations worldwide. Hence, given its rapid growth in emerging markets (Khorana, Servaes and Tufano, 2005), it is interesting to understand if these institutions, through their control and monitoring activities, have any influence on the companies’ abnormal stock returns around the event date. It averages 12.7% for the sample firms.
Additionally, I analyze another dummy variable. It is equal to 1 if a firm was, on the 24th April, 2013, part of the Special Corporate Governance Stock Index – IGCX and 0 if it was not.19 The Index members were collected from Bloomberg. Companies in BM&FBOVESPA are divided in different levels of Governance: Novo Mercado; Nível 1; Nível 2; Tradicional; Bovespa Mais.20 The index mentioned above measures the return of a theoretical portfolio composed by companies’ with a superior level of corporate governance (Novo Mercado, Nível 1 or Nível 2). The variable mean is 38.1%.
Other controls include the log of the number of employees, to take firms’ complexity into account and CAPEX scaled by total assets. Log of total assets and ROA, which is EBIT scaled by total assets, control for firm size and operating profitability, respectively (Rajan and Zingales, 1995). The mean of a firm capitalization is $mn 3858, CAPEX of 4.2%, and ROA of 2.5%.
19 See: http://www.bmfbovespa.com.br/indices/ResumoIndice.aspx?Indice=IGC&Idioma=en-us 20 See:
13
5. Results
In this chapter, the implications of the Brazilian anti-corruption law are examined using event study methods. Cumulative abnormal returns, around the event date, are explained with awarded public contracts in 2012. This is the key explanatory variable.
5.1: Public Contract Values and the 2010 General Elections
Given the relevant connections between companies and politics, it is worth to give attention to this subject. Tables 2, 3, 4 and 5 present, according to distinct criteria, abnormal stock returns for sample splits.
First of all, table 2 splits the sample by the median value of the public contracts (which corresponds to splitting between companies with and without public contracts). High for companies with deals above the median. Low for firms with contracts below such threshold. It can be concluded that companies awarded, in 2012, with contracts which values are above the median have 2.9% lower returns than the remaining firms. Additionally the difference is significant.
Table 3 differentiates between firms that did and did not contribute to the 2010 general election campaigns. First, it is possible to see that on average, the cumulative abnormal stock returns are much lower for firms that made contributions to political campaigns than for the ones that did not. The difference is 1.7%, though not significant.
Moreover, it is worth to differentiate between companies which happened to sponsor losing candidates from the ones that sponsored winners. After all, the former group ends up with none, or at least very reduced influence. Consequently, table 4 explores this subject. As a matter of fact, firms which contributed to winning campaigns have a lower performance than the ones that did not. Once again, the 0.33% difference between the
14 two groups is not significant. Unreported results have showed that the difference between winning sponsors and companies that did not contribute to election campaigns is still not significant.
To achieve a complete understanding of this subject, table 5 reports sample splits by above/below median firms’ contribution as a percentage of total money received by a winning candidate. The greater the importance of a firm to a candidate (high fraction), the lower its returns around the event date.
The results show that firms with a greater connection to the Government or political forces perform worst. Given the public debate around the suspicious links between the corporate and the political worlds, or some well-known criminal cases,21 the results are not surprising.
5.2. Main Results
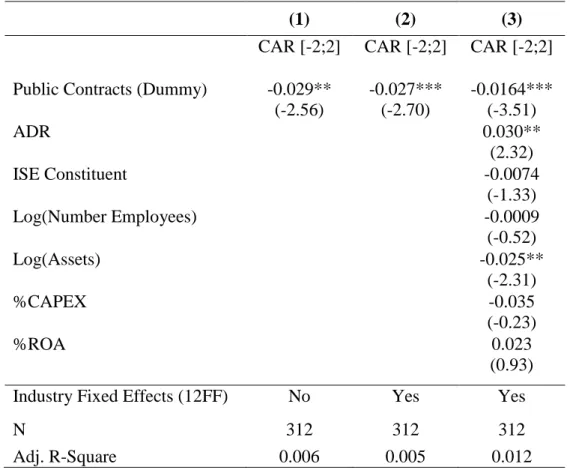
Table 6 examines the relation between the dependent variable, firms’ cumulative abnormal stock returns from the 22nd to the 26th of April, 2013 and the explanatory variables.
In Column 1, CAR [-2;2] is explained by the dummy of Public Contracts in 2012. It is significantly negative with a coefficient of -0.029. Firms that have a business relationship with the Government are more negatively affected by the approval of PL 6826/2010. However, in order to account for the correlation between companies’ returns within the same industry, industry fixed effects are included (column 2). It is likely that firms in the same industry are, to some extent, similarly affected by the anticorruption law approval. Ignoring such fact could lead to biased estimates which would raise
15 concerns on the validity of the significance tests. For such purpose, the companies are classified according to Fama and French 12 Industries classification. The result is robust to the inclusion of industry fixed effects (column 2).
When including all controls in the regression, Public Contracts still holds as a significant variable with a -0.0164 coefficient (column 3). To evaluate the economic significance of the results, consider that a company with public contracts registers a valuation decrease of $62.3mn ($3858mn*0.0164) for the mean firm, and $11.4mn ($694mn*0.0164) for the median firm.
Moreover, firms that are subject to the FCPA, via an ADR, are less affected. On the other hand, companies which are ISE constituents suffer more. Both variables coefficients are 0.030 and -0.0074, respectively. Further attention to these variables will be devoted in later sub-sections.
The number of employees and assets load negatively, suggesting that bigger and more complex firms have a harder time when it comes to comply with the new legislation. This may be related with the fact that anti-bribery controls are harder and costlier to implement. Due to the strict liability principle, which makes a company liable for any unlawful act committed by its employees, such an outcome is likely. To sustain such interpretation, it is worth to mention the KPMG Report – “A Governança Corporativa e o Mercado de Capitais 2013/2014.” According to it, from 2012 to 2013, the number of companies contracting D&O – Directors and Officers Liability Insurance has increased. Of the 232 firms considered, 81% had, in 2013, this type of insurance with a total value R$ 11 bn (R$ 8 bn in 2012). Besides, the increasing trend was also registered in terms of audit, compensation, finance and investments, human resources and risk committees. Brazilian firms are investing more in this kind of mechanisms.
16 Doing so is more expensive for bigger firms. However, it is fair to say that this matter goes beyond anti-bribery controls. In some cases it may actually involve a new approach to business, a new culture, an understanding that the firm has now to behave differently. KPMG also states that in 2013, 100 % of the companies part of the governance levels, Novo Mercado, Nível 2 and Nível 1 present a Code of Conduct and Ethic. In 2012 the percentages were 88%, 100% and 94%, respectively. This suggests a greater entrepreneurial awareness to the importance of a clean and serious image.
For the sake of completeness and robustness, it is worth mentioning that when removing outliers at the 1st and 99th, 2nd and 98th, and 5th and 95th percentile, respectively, results are not affected (Table 7). Additionally, when using a different method to calculate the cumulative abnormal returns, results hold.22
5.3: Cross – sectional characteristics
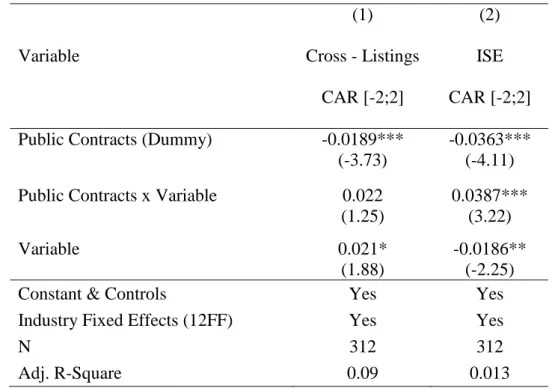
In this subsection, I study how cross sectional characteristics explain abnormal returns. Table 8 assesses the role of cross-listings, column 1, and BM&FBovespa Corporate Social Responsibility Index – ISE, column 2. For this purpose, additional variables are included to the original regression. To the former column, Public Contracts are multiplied by cross-listings, to the latter Public Contracts multiply with ISE. This procedure allows, according to the variable under scrutiny, differentiating between different groups of firms. All regressions include controls (constant, cross-listings, ISE, log (employees), log(assets), %CAPEX, %ROA), as well as industry fixed effects (Fama-French 12 industries).
22 In unreported results, instead of only taking the difference between the firms’ and the market’s returns,
17 From the variables interaction, I find that firms without American Depositary Receipt perform worse around the event date. The coefficient for non cross-listed companies is -0.0189 while for cross-listed it is 0.0021 (-0.0189+0.021). Economically, these results translate in a valuation drop, for non cross-listed companies, of $72mn for the mean firm and $13mn for the median. Likewise, table 8 evidences that Public Contracts explain abnormal stock returns more strongly for Brazilian firms present in the ISE. Actually, for ISE members (non-members), the coefficient is -0.0549 (-0.0363), which results in a mean valuation drop of $211mn ($140mn) and median of $38mn ($25mn).
Besides, attention is devoted to firm governance. Concerning this topic, table 9 highlights both Special Corporate Governance Stock Index – IGCX, columns 1 and 2, and Institutional Ownership, columns 3 and 4. Concerning the second variable, it is a dummy which equals one if a firm has above median foreign institutional ownership. Once again the dependent variable and the regressions’ specifications are just like before. Industry fixed effects are once again included. Nevertheless, since governance controls were not considered in table 6, this appendix slightly differs from the previous one. In columns 1 and 3, governance controls are simply added to the original regression (reported in table 6, column 3). Columns 2 and 4 are used, by resorting to variable interaction, to distinguish between members and non-members of IGCX, and firms with above and below median foreign institutional ownership.
To begin with, it is possible to see that, by including the IGCX in the regression (column 1), Public Contracts still holds as a significant variable. Column 2 evidences that better governance is associated with a larger drop in firm value. IGCX members perform worst from the 22nd to the 26th of April, 2013. In other words, companies
18 which, on the 24th of April 2013, were perceived as practitioners of higher forms of Governance are more negatively affected. IGCX members (non-members) register a variable coefficient of -0.0372 (-0.023) resulting in a mean valuation drop of $143mn ($88mn) and median of $25mn ($15mn).
Regarding cross-listings, the outcome reported in table 8 is as expected. Firms not already complying with the FCPA score lower performances around the event date. However, concerning ISE and IGCX the results reported may come as a surprise. First, ISE members, seen as responsible from the standpoint of corporate sustainability, based on economic efficiency, environmental equilibrium and social justice suffer more than non-members. Also, weakly governed firms are less negatively affected by the approval of the anti-corruption legislation. IGCX constituents provide timely information to markets, while allowing auditing by independent agents and displaying management decisions and procedures controls. They are also obliged to organize, at least once a year, a public meeting with financial analysts to promote a closer relationship with investors. Certainly it would be fair to expect that such procedures would, when it comes to investment decisions, reduce risk and conveying trust. But results prove differently. There are several plausible points of view to interpret these results.
Let us consider two scenarios. First, the Brazilian legal system, by approving the new legislation, may be perceived as improving its effectiveness in fighting corruption. If, as discussed by Zeume (2014), managers use corrupt practices for their own personal benefit, anti-bribery regulation would create firm value. Companies with lower governance levels are more predisposed to suffer from this type of behavior from their own personnel. If that is the case, the approval of this legislation forced companies with less regulatory procedures to improve their internal controls. Following the
19 intensification of law enforcement, firms may have realized that, due to the potential severe penalties, it paid off to develop their own internal monitoring. That would be in line with the previously mentioned KPMG report, which states that Brazilian firms are investing more in D&O insurance, audit, compensation, finance and investments, human resources and risk committees. Hence, lower governance firms, by solving their employees’ deviant behaviors, have higher stock returns around the event date.
The second and opposite hypotheses is that, regardless of the law approval, the market believes that it will have no effect. In fact, although it has developed during the past few years, and in light of recent corruption scandals,23 the Brazilian juridical system has still a long way to go.24 In this scenario, lower governance firms will have no incentive to improve themselves. Not only do they not invest in internal monitoring, saving therefore resources, as they can keep on resorting to illegal practices when running their businesses. This way, they have an advantage in relation to its peers scoring higher performances in the market. On the other hand, once again in line with Zeume (2014), strongly governed firms face higher detection costs (due to higher reputational costs). Complying firms from the standpoint of social responsibility are the ones who lose the most with improper prosecution. A company perceived in the marketplace as responsible and user of good practices has more to lose if connected to any bribery case. Such a loss would not only be related with heavy fines but also with factors such as brand value. Finally, Institutional Ownership results are not significant. They are only presented to make a parallelism with Zeume (2014).
23 See:
http://www.bloomberg.com/news/2014-12-03/petrobras-100-million-man-tops-graft-haul-in-scandal.html
20
6. Conclusion
I establish a connection between the corporate and political worlds. Corruption is a wide-spread problem, challenging to detect and study. The research shows, through the use of Public Contracts in 2012, that from the 22nd to the 26th of April 2013, the greater the link between a firm and the Government the greater the drop in firm valuation. Empirical evidence sustains that companies awarded with above median contract values have 2.9% lower returns than its peers. However, the results are not as strong when analyzing contributions to the 2010 General Election Campaigns. Despite suggesting that contributing firms have lower performances, the variables are not significant.
The effect of the legislation is stronger for firms not subject to the FCPA. Furthermore, better governance is associated with greater drops in firm valuation. That is the case for ISE and IGCX members. Two possible scenarios are presented. First, the market perceives that the Brazilian legal system is now committed to fight corruption. Hence, firms with lower governance standards are forced to improve their internal monitoring, thereby addressing employees’ deviant behaviors who use corrupt practices for their own personal benefit. Second, regardless of the law approval and given the recent corruption scandals, firms believe that the new law will have no actual effect. In that case, lower governance firms will not invest in internal monitoring and will keep on resorting to illegal practices guaranteeing its competitive edge.
This Work Project shows that the new legislation destroys firm value. It corroborates other evidence that operating in Brazil depends on the relations with politicians. But do corruption and business success walk together? “The fact that firms benefit from the ability to use bribes does not exclude that they would benefit even more from a global ban of bribes” (Zeume, 2014).
21
References
Ayadin, Hasan and Nuri Baltaci. 2013. “Corruption, banking sector, and stock market
development: A panel data analysis.” European Journal of Research on Education.
Bardhan, Pranab. 1997. “Corruption and Development: A Review of Issues.” Journal
of Economic Literature, 35(3): 1320 - 1346
Carvalho, Daniel. 2014. “The Real Effects of Government-Owned Banks: Evidence
from an Emerging Market.” The Journal of Finance, 69(2): 577 – 609.
Cheung, Yan-Leung, P. Raghavendra Rau and Aris Stouraitis. 2012. “How much
do firms pay as bribes and how much do they get? Evidence from corruption cases worldwide.”
Claessens, Stijn, Erik Feijen and Luc Laeven. 2006. “Political connections an
preferential access to finance: The role of campaign contributions.”
Faccio, Mara. 2014. “Politically connected firms.”
Ferreira, Miguel A. and Pedro Matos. 2008. “The colors of investors’ money: The
role of institutional investors around the world.” Journal of Financial Economics, 88: 499 – 533.
Jain, Arvind K. 2002. “Corruption: A Review.” Journal of Economic Surveys, 15(1):
71 – 121.
Khorana, Ajay, Henri Servaes and Peter Tufano. 2005. “Explaining the size of the
mutual fund industry around the world.” Journal of Financial Economics, 78: 145–185.
Lee, Charles M. C. and David Ng. 2006. “Corruption and International Valuation:
Does Virtue Pay?”
Mo, Park Hung. 2000. “Corruption and Economic Growth.” Journal of Economic
22
Rajan, Raghuran G. and Luigi Zingales. 1995. “What Do We Know about Capital
Structure? Some Evidence from International Data.” The Journal of Finance, 50(5) – 1421 – 1460.
Tanzi, Vito and Hamid Davoodi. 1997. “Corruption, Public Investment and Growth.” Wei, S.J. 1997. “How taxing is corruption on international investors?”
Zeume, Stefan. 2014. “Bribes and Firm Value.”
Appendices
Table 1: Descriptive Statistics
Variable Mean SD Median #Obs
Dependent Variable
CAR [-17;-3] 1.47% 12.7% 2.06% 312
CAR [-2;2] 1.03% 13.3% -0.03% 312
CAR[3;17] -2.09% 14.54% -2.9% 312
Controls
Public Contracts (dummy) 26.9% 44.4% 0% 312
Public Contracts ($R mn) 54.8 807 0 312
Campaigns (dummy) 26.0% 43.9% 0% 312
Winning Campaigns (dummy) 76.8% 42.5% 1 82
Campaigns ($R) 646,346 2,610,034 0 312 Fraction Campaigns 3.7% 3.3% 2.6% 62 US Cross Listings 8.7% 28.2% 0% 312 ISE constituent 46.5% 50.0% 0 312 Governance Variables Institutional Ownership 12.7% 12.5% 9.1% 207 IGCX Constituent 38.1% 48.7% 0 312 Other controls Number Employees 14,515 27,562 3,585 121 Market Value ($mn) 3,858 13,532 694 306 %CAPEX 4.2% 6% 2.5% 307 %ROA 2.5% 20.4% 3.9% 307
23
Table 2: Contract Value25
(1) All Firms 1.03%
(2) Low Value 1.81%
(3)High Value -1.09%
(3)-(2) Difference
(High Value – Low Value)
-2.9%*
Table 3: Contribution vs No Contribution
(1) All Firms 1.03% (2) No contribution 1.47% (3) Contribution -0.23% (3)-(2) Difference (Contribution - No contribution) -1.7%
Table 4: Winner vs Loser
(1) All Firms 1.03% (2) Loser 0.0036% (3) Winner -0.33% (3)-(2) Difference (Winner - Loser) -0.3336%
Table 5: Firms’ contribution as a fraction of total contributions
(1) All Firms 1.03%
(2) Low Fraction 0.33%
(3) High Fraction -0.39%
(3)-(2) Difference
(High Fraction – Low Fraction)
-0.72%
25 T-statistics of robust regressions are in parentheses. *, **, and *** indicate significance at the 10%,
24
Table 6: Corruption Exposure and Abnormal Returns
(1) (2) (3)
CAR [-2;2] CAR [-2;2] CAR [-2;2] Public Contracts (Dummy) -0.029**
(-2.56) -0.027*** (-2.70) -0.0164*** (-3.51) ADR 0.030** (2.32) ISE Constituent -0.0074 (-1.33) Log(Number Employees) -0.0009 (-0.52) Log(Assets) -0.025** (-2.31) %CAPEX -0.035 (-0.23) %ROA 0.023 (0.93)
Industry Fixed Effects (12FF) No Yes Yes
N 312 312 312
Adj. R-Square 0.006 0.005 0.012
Table 7: Percentiles Analysis
(1) (2) (3)
CAR [-2;2] CAR [-2;2] CAR [-2;2] Public Contracts (Dummy) -0.0124***
(-3.08)
-0.0115*** (-3.11)
-0.0087*** (-2.70)
Industry Fixed Effects (12FF) Yes Yes Yes
Percentiles Removed 1st – 99th 2nd – 98th 5th – 95th
25
Table 8: Cross Sectional Characteristics and Abnormal Returns
(1) (2)
Variable Cross - Listings ISE
CAR [-2;2] CAR [-2;2] Public Contracts (Dummy) -0.0189***
(-3.73)
-0.0363*** (-4.11) Public Contracts x Variable 0.022
(1.25) 0.0387*** (3.22) Variable 0.021* (1.88) -0.0186** (-2.25)
Constant & Controls Yes Yes
Industry Fixed Effects (12FF) Yes Yes
N 312 312
Adj. R-Square 0.09 0.013
Table 9: Firm Governance
(1) (2) (3) (4)
Governance Variable IGCX Institutional Ownership
CAR [-2;2] CAR [-2;2] CAR [-2;2] CAR [-2;2] Public Contracts (Dummy) -0.018***
(-3.13) -0.023** (-2.46) -0.002 (-0.63) 0.006 (0.89) Public Contracts x Governance
Variable 0.0145 (0.91) -0.015 (-1.09) Governance Variable -0.0105 (-1.38) -0.0142* (-1.68) 0.007 (1.24) 0.011* (1.54)
Constant & Controls Yes Yes Yes Yes
Industry Fixed Effects (12FF) Yes Yes Yes Yes
N 312 312 206 206