i
Equity Valuation Dissertation
Walt Disney Company
João de Oliveira Vasconcelos Luís
# 152413019
Advisor: José Carlos Tudela Martins
30
thDecember 2014
Dissertation submitted in partial fulfilment of requirements for the degree of MSc in
Católica Lisbon School of Business and Economics Walt Disney Company – Equity Valuation
ii
Research Note
Walt Disney Company
1
stAugust 2014
Recommendation:
BUY
Price Target:
$ 88,52
Company Financial Information: Enterprise Value: $172.500 million Equity Value: $153.294 million Debt Value: $19.206 million Shares Outstanding: 1.732 million Market Price: $85,38
Credit Rating (S&P): A Price Performance:
52 Week Price Range: $60,83 – $86,89
Daily VaR - 95% confidence -3,07% 60,00 65,00 70,00 75,00 80,00 85,00 90,00 -6,00% -4,00% -2,00% 0,00% 2,00% 4,00% 6,00% 8,00% 10,00% DIS US Equity S&P 500 Index
Walt Disney Company is a diversified multinational mass media company, being one of the most known worldwide. Although it is the world second largest broadcasting company, it is primarily known by the production of animated films through its studio entertainment segment.
After a deceleration on its growth, as consequence of the economic financial crisis of 2008, the company has retaken the growth trend over the later years, due to the improvement of the economic environment worldwide and the company’s investment and development on its operational segments.
Its revenues have been increasing in the later years, being this trend expected to maintain. This is supported by the plans that Walt Disney has already disclosed, as the release of new animated films and the opening and expansion of new theme parks, but also by the possibility of expanding its activity to new geographic markets, as it did in China and India. The developments of the company’s mature segments through acquisitions and new projects, jointly with the progress of the recent interactive media segment, are factors that can dictate the fastness of the company’s growth.
Moreover, the expected increase in Walt Disney capital expenditures and working capital represent its ambition to be one of the market leaders in its different business fields.
This way, Walt Disney presents itself as a growing company, with dynamic and adventurous upcoming years which, considering its easiness to finance itself turns it into a low risk investment opportunity in financial markets. Price Variance Performance
iii
Abstract
This dissertation aims to evaluate Walt Disney Company (ticker: DIS US Equity). The evaluation process is done through three different mechanisms in order to achieve a more accurate and complete valuation exercise.
The first valuation method is the Discounted Cash Flows model, in which each company’s segment is valued separately, therefore obtaining the company’s overall valuation by combining them all. This model provides a Walt Disney share price estimation of $88,52 which, compared to its market price of $85,38, represents a buying opportunity.
The second valuation method is the Economic Value Added model. Through this valuation technique, the Walt Disney share price is estimated as of $77,89 which, compared to its market price, represents a selling opportunity.
The third and last valuation method presented is the relative valuation. By applying the Enterprise Value to EBITDA multiple, it is achieved a company share price of $83,96 which also represents a selling opportunity.
Lastly, it is compared the valuation obtained through this dissertation to the one accomplished by J.P.Morgan, in which the Walt Disney share price is estimated as $90,00. By doing so, one can conclude that the valuation in this dissertation is more conservative, being the different assumptions made examined further in this report.
iv
Acknowledgements
This dissertation is the result of a hard working long process, which allowed me to enrich my knowledge in the equity valuation field.
I want to express my gratitude to the ones that were around me during this period and gave me continuous support, because without them this would be much more difficult. In the first point, I want to thank to professor José Carlos Tudela Martins for the patience, support and guidance through the fulfilment of this dissertation.
I want also to thank to João Castro and Inês Mira for their help and exchange of hints and advices for this valuation exercise during this period.
Per last, as this dissertation represents the culmination of my academic journey, I want to truly thank to my parents and sisters, André Bernardino, Ana Queiroga, Nuno Madeira, João Vieira, Roula Kalavrytinou and Valia Dimitriadi for their help and for everything they taught me, making of me who I am today.
v
Table of Contents
Cover………..i Executive Summary………...……….….………...……….…..ii Abstract……….………iii Acknowledgements……….………...iv 1. Introduction ... 8 2. Literature Review ... 8 2.1. Introduction ... 8 2.2. Relative Valuation ... 9 2.3. Peer Group ... 112.4. Discounted Cash Flows Model ... 11
2.5. Terminal Value ... 13
2.6. Discount Rate ... 14
2.7. Adjusted Present Value ... 16
2.8. Present Value of Interest Tax Shields ... 17
2.9. Dividend Discount Model ... 18
2.10. Economic Value Added ... 19
2.11. Conclusion ... 20
3. Industry Overview ... 21
3.1. TV Broadcasting Sector ... 21
3.2. Filmed Entertainment Sector ... 22
3.3. Video Game Sector ... 24
3.4. The Tourism and Hotel Sector ... 26
3.5. The Consumer Products sector ... 27
4. Walt Disney Company ... 28
4.1. Company History ... 28
4.2. Company Segments ... 31
4.2.1. Media Networks ... 31
4.2.2. Parks & Resorts ... 31
4.2.3. Studio Entertainment ... 32
4.2.4. Consumer Products ... 33
4.2.5. Interactive Media... 33
5. Valuation Overview ... 34
5.1. Estimation of Revenues ... 34
vi
5.1.2. Estimation of Parks & Resorts Revenues ... 36
5.1.3. Estimation of Studio Entertainment Revenues ... 36
5.1.4. Estimation of Consumer Products Revenues ... 37
5.1.5. Estimation of Interactive Media Revenues ... 37
5.2. Estimation of Cost of Sales ... 38
5.3. Estimation of Depreciation and Amortization... 40
5.4. Estimation of Other Non-Cash Adjustments ... 41
5.5. Estimation of Capital Expenditure ... 42
5.6. Estimation of Working Capital ... 43
6. The Weighted Average Cost of Capital ... 44
6.1. Risk-Free Rate & Market Risk Premium ... 44
6.2. Cost of Equity ... 45
6.3. Cost of Debt ... 46
6.4. Capital Structure ... 47
6.6. Weighted Average Cost of Capital Estimation ... 48
7. Discounted Cash Flows Model ... 48
7.1. Free Cash Flows to the Firm (FCFF) ... 49
7.2. Terminal Value ... 49
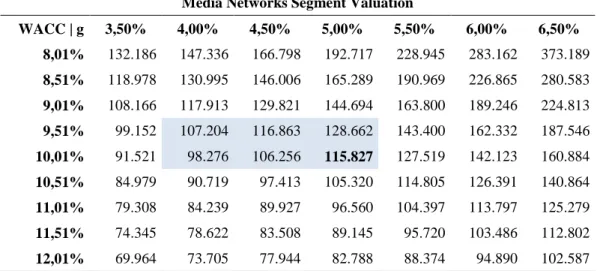
7.3. Media Networks ... 50
7.3.1. Media Networks – Sensitivity Analysis ... 51
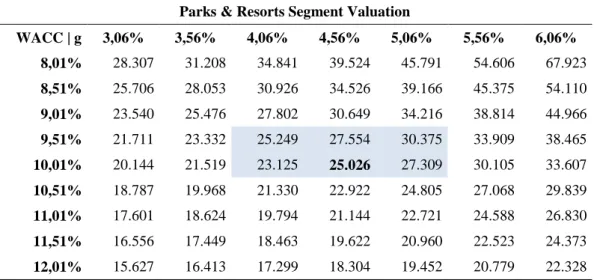
7.4. Parks & Resorts ... 51
7.4.1. Parks & Resorts – Sensitivity Analysis ... 52
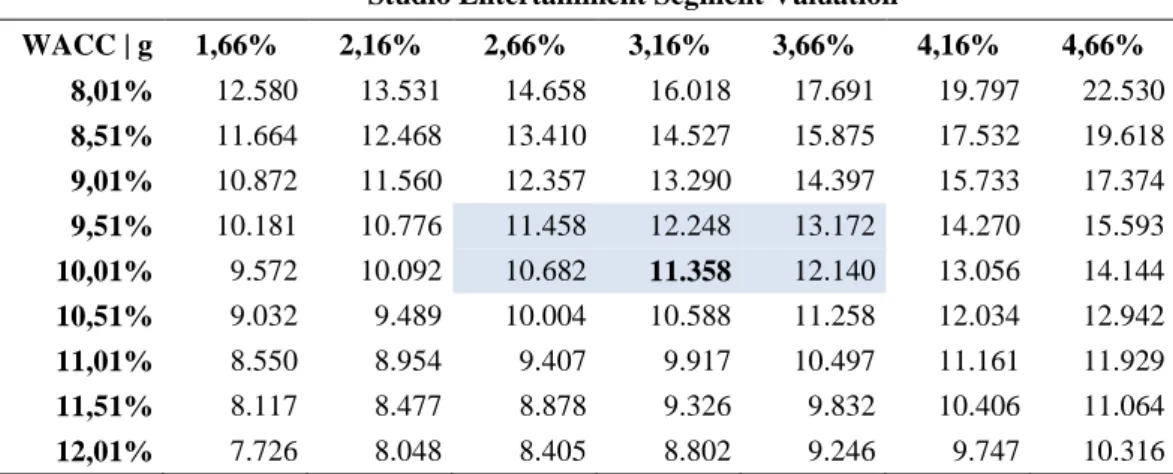
7.5. Studio Entertainment ... 53
7.5.1. Studio Entertainment – Sensitivity Analysis ... 54
7.6. Consumer Products ... 55
7.6.1. Consumer Products – Sensitivity Analysis ... 56
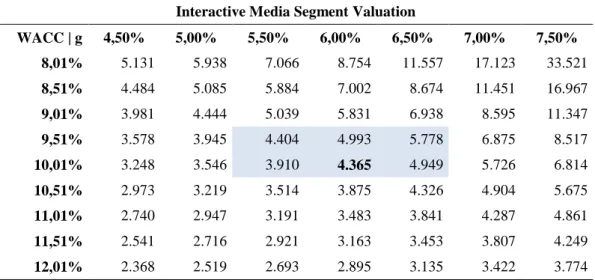
7.7. Interactive Media... 56
7.7.1. Interactive Media – Sensitivity Analysis... 57
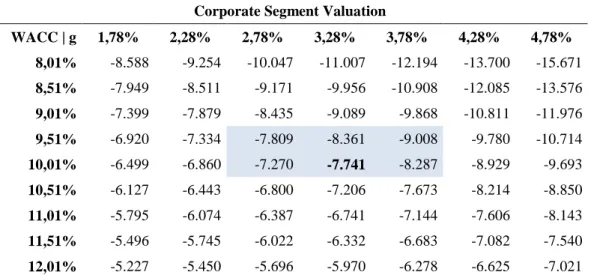
7.8. Corporate ... 58
7.8.1. Corporate – Sensitivity Analysis ... 59
7.9. Walt Disney Valuation ... 59
8. Economic Value Added ... 60
8.1. Explicit Period ... 60
8.2. Terminal Value ... 61
8.3. EVA Valuation ... 62
vii
10. The Value-at-Risk Analysis ... 66
10.1. Historical Simulation... 66
10.2. Monte Carlo Simulation ... 67
11. Valuation Conclusion ... 68
12. Valuation Comparison - Analyst ... 69
12.1. Financial key data comparison ... 70
12.2. Relative valuation comparison ... 70
13. Conclusion ... 71
14. Annex ... 72
14.1. Annex 1 – Walt Disney Income Statement ... 72
14.2. Annex 2 – Walt Disney Balance Sheet ... 73
14.3. Annex 3 – Walt Disney Cash Flow Statement ... 74
14.4. Annex 4 – Walt Disney Effective Tax Rate ... 75
14.5. Annex 5 – Walt Disney Depreciation and Amortization ... 76
14.6. Annex 6 – Walt Disney Other Non-Cash Adjustments ... 77
14.7. Annex 7 – Walt Disney Capital Expenditures ... 78
14.8. Annex 8 – Walt Disney Working Capital ... 79
14.9. Annex 9 – Walt Disney Media Networks Segment: DCF Valuation ... 81
14.10. Annex 10 – Walt Disney Parks & Resorts Segment: DCF Valuation ... 82
14.11. Annex 11 – Walt Disney Studio Entertainment Segment: DCF Valuation ... 83
14.12. Annex 12 – Walt Disney Consumer Products Segment: DCF Valuation ... 84
14.13. Annex 13 – Walt Disney Interactive Media Segment: DCF Valuation ... 85
14.14. Annex 14 – Walt Disney Corporate & Other Adjustments Segment: DCF Valuation 86 14.15. Annex 15 – Walt Disney DCF Valuation ... 87
14.16. Annex 16 – Walt Disney Debt Composition ... 88
14.17. Annex 17 – Walt Disney Peer Group Composition ... 89
15. Bibliography ... 89
15.1. Articles ... 90
15.2. Books... 91
15.3. Websites ... 91
8
1. Introduction
The present dissertation targets to evaluate Walt Disney Company (ticker: DIS US Equity), a public listed company. The company, one of the most known companies worldwide, is nowadays a complex and expanded one, and so detailed and deep analysis should be paid under its valuation.
Therefore, firstly are introduced several methods to perform a valuation exercise, and their respective advantages and disadvantages. The objective of this is to, according toWalt Disney characteristics and particularities, determine the methods that best suit for this company. This is followed by a description of the company and the industries in which it operates, with intention to contextualize the valuation exercise.
Then, Walt Disney is evaluated through the Discounted Cash Flows model, the Economic Value Added model, and the relative valuation method. After reaching a dissertation’s share price for the company, it is compared to the one yielded by the market (S&P 500 Index) at 1st August, 2014.
The dissertation finishes with the comparison between the valuation obtained within this study and the one performed by J.P.Morgan. This comparison aims to identify the main assumptions and variables that lead to different estimated valuations.
2. Literature Review
This section is dedicated to the presentation of the different methods that may be used to perform a valuation exercise. The models are defined and explained, accompanied by the identification of their respective advantages and disadvantages.
In the end of this section are identified the methods to be applied in this valuation exercise, as well as the reasoning behind these choices.
2.1. Introduction
In this section are explained the different methods that can be applied on a valuation exercise. Fernandez (2007) highlights the importance of understanding the mechanisms of a valuation exercise not only due to its significance for valuation in mergers and acquisitions “but also because the process of valuing the company and its business units
9 helps identify sources of economic value creation and destruction within the
company”1
, providing therefore useful information for the company’s management. Damodaran (2005) states that analysts use a wide spectrum of models to perform valuation exercises, ranging from the simplistic to the most sophisticate ones. Nevertheless, according to Luehrman (1997), a valuation exercise is always a function of three essential factors: cash, risk and timing. As one concludes later in this section, these factors are managed differently according to the different methods applied, which in part justify the different valuations they lead to.
Even though one may believe that different models yield different valuations, Young et al (1999)state that it is indifferent which model is used, since they all should lead to comparable values if the assumptions made are consistent transversely on the different models.
2.2. Relative Valuation
Damodaran (2006) states that the relative valuation purpose is to value assets based on the price of similar ones in the market. Even though relative valuation is not considered the best valuation method, it is very used and useful in financial studies. It is a perceptive tool, easy to perform and gives investors a general estimative of the asset considered compared to the overall market.
Nevertheless relative valuation has some limitations that may be critical, and can turn the valuation misleading. According to Fernandez (2001), multiples are useful when used as a second stage of a valuation, complementing the valuation performed by any other method. Further, the author states that “a comparison with the multiples of comparable firms enables us to gage the valuation performed and identify differences
between the firm valued and the firms it is compared with”2
. Moreover, Goedhart et al (2005) emphasize that, if executed properly, a relative valuation can be useful for companies to stress-test its forecasted cash flows and to hold useful deliberations about its strategic position to create value, compared to its competitors.
The attractiveness of the multiples approach is that it is not a hard practical process. The first step is to find comparable companies that are priced in the market, which are defined by Damodaran (2006) as the ones that exhibit similar risk, cash flows and
1
Fernández, Pablo. "Company valuation methods. The most common errors in valuations." Research Paper no 449 (2007).
2
Fernandez, Pablo. "Valuation using multiples. How do analysts reach their conclusions?." IESE Business School (2001).
10 potential growth as the company analyzed. Nonetheless this definition is not coherent, as Foushee et al (2012) point out that for relative valuation purposes, the only relevant comparable companies “are those that compete in the same markets, are subject to the same set of macroeconomic forces, and have similar growth and returns on capital”3. The second step consists in scaling the market prices to a common variable to generate comparable standardize prices. It is at this point that most of the controversial principles of relative valuation arise. According to Damodaran (2012), the multiples composition has to be consistent, i.e. if the numerator of a multiple is a market value, then it is expected that the denominator is a market value as well. The same logic applies if either the numerator or denominator is a book value. Nevertheless, this condition is discredited by several analysts, which argue that multiples just have to be consistent across companies, therefore being computed in the same way.
The third and last step consists solely on applying the multiple obtained on the value driver in order to determine the company’s valuation.
It is important to realize that certain multiples may fit better in some situations, being therefore imperative to understand their fundamentals. According to Goedhard et al (2005), even though price-to-earnings multiple is the most used one in financial analysis, it is powerfully affected by capital structures. Consequently, it can be misleading when applied to companies with negative earnings – this way the P/E ratio is not meaningful, as well as when applied to companies with increasing debt levels, since P/E ratio increases with leverage. A plausible alternative is the usage of enterprise value to EBITDA multiple, since it is less susceptible to changes in the capital structure. However, this may also be misleading if a change on capital structure lowers the cost of capital, which consequently increases the multiple.
Moreover, some multiples display a trend. On their empirical study, Liu et al (2002) concluded that forward earnings measures are the ones that perform better, as opposite to book value of equity and sales that perform worst according to their rank. This way authors concluded that forward looking multiples perform greater in relative terms than others which, according to them, is explained by the stronger predictability power of future cash flows they have compared to historical ones.
3
Foushee, S., Koller, T. and Mehta, A. (2012), ‘’Why bad multiples happen to good companies?’’, corporate finance practice.
11 Lastly, it is important to notify that multiples may ignore risk factors and companies’ potential growth. Also, it is possible that the market is “wrong”, and so analysts have to be critical, reasonable and sensible to arrive at an accurate valuation.
2.3. Peer Group
A peer group of a company can be defined as a group of companies that share some characteristics with the company analyzed, being therefore acceptable to use them as comparative companies for valuation purposes.
Even though there are several approaches to estimate the peer group, in this study is adopted the clusters analysis. This approach was developed by MacQueen (1967), being thenceforward been applied in researches of several fields of study. It is a useful tool to create a more accurate peer group, consisting in minimizing the Euclidean distance of the observations considered to the centroids.
In order to do so, one starts by defining the number of clusters desired. Then, after establishing the variables to be used as criteria to define the peer group, they are standardized with the purpose of minimize the distance to the centroids. This results in new centroids with the average values for the observations of each cluster. New clusters are then pointed to the observations, being this step repeated until observations get constantly associated to the same cluster, getting therefore stable.
2.4. Discounted Cash Flows Model
As mentioned above, the valuation process of a company can be based on several methods which are considered or not according to the companies’ characteristics, information required and demanded results. However, the Discounted Cash Flows (DCF) model appears as the most popular method, described as “the most accurate and
flexible method for valuing projects, divisions, and companies”4
.
The model consists in forecasting future cash flows to the company, discounted at an appropriate rate that reflects its risk. Moreover, this method can be applied based both on the Free Cash Flows to the Firm (FCFF), which displays all sources of capital to the company, or on the Free Cash Flows for the Equity (FCFE), which displays solely the cash flows available for the company’s shareholders.
4
Goedhart, Marc, Timothy Koller, and David Wessels. "The right role for multiples in valuation." McKinsey on Finance 15 (2005): 7-11.
12 In order to obtain the FCFF, one has to forecast the future cash flows of the company. A problematic approach may appear when establishing the time period to be used on this forecasting exercise. Usually, analysts use a period ranging from 5 to 10 years. However, if a company is already performing on its steady state, it should not be required such a long period. So, by adding to the after tax income of each period the depreciations and amortizations, and subtracting the capital expenditures and increments on working capital, the FCFF of each period is obtained, which are then discounted at an interest rate that represents both the company’s cost of debt and equity – weighted average cost of capital (WACC). The firm value is then obtained by:
Enterprise Value = ∑ FCFFt
(1+WACC)t
N
t=1
On the other hand, to achieve the FCFE, one should forecast the cash flows from operations, add the company’s new debt, and subtract capital expenditures and principal repayments to debtholders. In this case, the cash flows obtained should be discounted at the cost of equity (Re) since, as it is considered the cash flows that derive for
shareholders, the discount rate should represent their opportunity cost. Therefore, the company’s equity value is calculated as:
Equity Value =∑ FCFEt
(1+Re)t N
t=1
Despite being calculated on different ways, if the assumptions made are coherent and consistent over the two methods, the same valuation should be achieved independently the one used, since they are related as follows:
FCFE = FCFF - Interest Payments∗ (1-T) - Principal Repayments + New Debt
The choice of the cash flow used is strongly related to the capital structure of the company. According to Pinto et al (2010), the FCFF is often choose if the company is levered, either having a negative FCFE or a changing capital structure. The authors argue this based on the fact that the cost of equity may be more sensible in changes on capital structure, and so the WACC approach should be adopted.
One of the risks associated to the DCF model is the incorrect cash flows forecast. Since it is tried to “predict the future”, one should always be conscious that the values achieved may be unreliable. Consequently, as the forecasting time period increases, the risk of failing increases as well, diminishing the accuracy of the valuation. Therefore,
13 after perform the estimations for the explicit period, one calculates the terminal value – value of the firm after the explicit period. This notion is going to be developed below, but one may already consider it in the DCF formula as follows:
DCF Valuation =∑Cash Flowt
(1+R)t N
t=1
+ Terminal ValueN (1+R)N
Despite being the preferred method to evaluate a company, DCF does not provide the same information as other models. For instance, it does not discriminate the tax shields advantages nor the distress costs of a company. A solution to these issues is introduced later in this section with the Adjusted Present Value model.
2.5. Terminal Value
The terminal value of a company is its anticipated value on a certain date in the future. In fact, it is a quite powerful tool to project cash flows for a several-year period, since it allows one to deduce the value of a company over that time period without doing all the detailed computations required, as happens in the explicit period. It appears this way as
a solution for the forecasting problem, since “cash flows cannot be projected forever”5.
It is one of the most important instruments when performing a valuation exercise through the DCF model, since it is “responsible” for a large proportion on the company’s valuation, as it represents its value on perpetuity. Its usage is only reasonable if, from the time period considered on, the company is not going to be very different from the last years of the explicit period – the company is performing on its steady state. The steady state is translated into the stability of the company financial ratios (i.e. EBITDA margin), revenue and cost of sales’ growth, etcetera.
According to Damodaran (2013) there are three different methods to estimate the terminal value: liquidation method, market multiples and stable growth model.
The liquidation method assumes that the company will be liquidated at a certain point in time, selling all its assets and paying its debts. This way, the value that the company will come up after this is the liquidation value, estimated based on the company assets book value. Even though it “always represents the company’s minimum value as a
5
Damodaran, Aswath.2013.”Chapter 10 – Value Enhancement and Cash-Driven Valuation Models”. In CFA Institute Investment Books, 223-226.
14
company’s value”6
, Damodaran states that it does not represent the potential earning power of the assets.
The second method is the market multiples, in which the value of a company is estimated by applying the multiples approach to the firm’s earnings or sales revenues in that year. Damodaran notifies that if the multiples are projected from comparable firms, it may result in a dangerous mix between relative and Discounted Cash Flow valuations. The last method is the stable growth model. In opposition to the liquidation approach, this method presupposes that the company will reinvest some of its cash flows into new assets, continuing to operate. As said previously, it is assumed that a company is in its steady state when the terminal value is computed. If one considers the perpetual reinvestment of its cash flows, then the company is assumed to grow at a constant rate (g) in perpetuity. Therefore, the terminal value is computed as:
Terminal Valuet = Cash Flowt+1 R - g
As any method, stable growth model has some limitations. Damodaran states that “since no firm can grow forever at a rate higher than the growth rate of the economy in which it operates, the constant growth rate cannot be greater than the overall growth rate of the
economy”7
. Still, the author refers that if the company considered is a multi-national, then the growth rate in the global economy will be its limiting value.
2.6. Discount Rate
The discount rate is the interest rate at which cash flows should be discounted in order to reflect the opportunity cost and risk of a company, therefore being used to determine their present value. As mentioned, the cost of capital will depend on the risk associated to the company, but also on its capital structure. The Weighted Average Cost of Capital (WACC) has been considered the preferred rate to discount cash flows on valuation exercises, due to its calculation easiness but also, according to Luehrman (1997), because of its ability to consider the tax advantage from the company’s borrowings. Its formula is given as follows:
WACC = D D + E + P∗ Rd ∗ (1-T) + E D + E + P∗ Re + P D + E + P∗ Rp 6
Fernández, Pablo. "Company valuation methods. The most common errors in valuations." Research Paper no 449 (2007).
7
Damodaran, Aswath. Valuation approaches and metrics: A survey of the theory and evidence. Now Publishers Inc, 2005.
15 Plus, Luerhman states that WACC is the appropriate rate to use only in case the considered company has a simple capital structure. Otherwise, one has to adjust WACC for tax shields, issue costs or exotic debt securities in cases of a more complex capital structure.
Nevertheless one should be aware that there are several foundations to compute the WACC, being the first the known as free rate. In order to compute a correct risk-free rate, it is important to be sure that the rate used is the long-term government bond instead of the short-term one, since the riskless of short-term government bond may be due to its short time period. Besides that, as Fernandez (2004) states, the risk-free rate that should be used is the government bond verified at the time the company is evaluated, and therefore the usage of any historical average of it is a serious mistake. The risk-free rate is a required component to compute the cost of equity, but also to obtain both the levered beta of the company and the market risk premium.
Beta is a tool used to measure the market risk of an asset, that is, the correlation of the asset’s value with the market.
There are several ways to obtain or calculate the beta of a company. In this study the methodology adopted is the one suggested by Damodaran. Such method consists in regressing the company’s stock returns on the returns of the benchmark considered. By performing the following relationship, it is possible to deduce the beta demanded.
Ri = α + β ∗ Rm
However, Damodaran points two issues that should be dealt carefully in this approach. The first concern is related to the time period in which the beta is regressed. Even though that a larger time frame allows obtaining more observations, one should pay attention to the fact that it can capture periods in which the company’s characteristics were different, which can bias the beta estimation. The other concern is connected to the return intervals used. Again, a smaller return intervals lead to more observations, but may lead to biased results.
Still, one should realize that the beta used to compute the cost of equity is the known as levered beta. It arises in case the company has debt, and therefore the incremental risk from the leverage has to be considered. It is computed as:
βL = βU∗ [1 + (1-T) ∗ D/E ]
Lastly, to compute the cost of equity one also needs the market risk premium, which is defined as the difference between the returns of a market index and the returns of the
16 risk-free rate. In order to obtain it, it is computed the market returns, and then the market risk premium is calculated as the difference between the obtained market returns and the risk-free rate. Finally, the market risk premium is computed as the average of its historical values. Damodaran states that this method to obtain the market risk premium may not be the most accurate for markets with short and volatile industries, as well as for European markets.
Having all the required variables to compute the cost of equity, it is estimated based on Capital Asset Pricing Model approach as:
Re = RF + βL∗ [E(RM) - RF]
Thereafter one is able to compute the Weighted Average Cost of Capital, by including also the cost of debt and the tax rate.
2.7. Adjusted Present Value
The Adjusted Present Value model consists in valuing a company as if it was financed solely by equity, taking into account its interest tax shields (ITS) and bankruptcy costs. The model can be described as the “application of the basic DCF relationship to each of
a business’s various kinds of cash flow and then add up the present values”8
.
According to Luehrman (1997), the APV model is less sensible to mistakes than the WACC approach, and is able to unbundle the value of the different components that constitute it.
The methodology of this model is reasonably easy in theory, but in can be delicate in practical terms. It shares the first step with the DCF model, consisting in forecast the cash flows across the time. Then, while in the DCF model the cash flows are discounted at the WACC, in the APV they are discounted at the cost of equity, since it is assumed that the company is all financed by equity. Then attentions are turned to the “real” debt of the company, whereas one has to forecast the debt repayments to the debtholders of the company across the time, as well as its interest expenses. Consequently, it is in this step that the interest tax shields are estimated, being then discounted to the present value. Since there are different approaches to compute the present value of the interest tax shields, the methodology of each of them is presented later in this section.
In addition to the interest tax shields, the bankruptcy costs of the company are the other foundation in the APV model. Bankruptcy costs can be defined as all costs associated to
8
Luehrman, Timothy A.1997. “What’s it worth? - A General Manager’s Guide to Valuation”. Harvard Business Review, pp.132-142.
17 a company when it is unable to repay its outstanding debts. Their estimation is considered the most intricate step in this valuation model since there is not an explicit method to do it and, as they are accounted for the company valuation, its incorrect estimation may lead to a misleading valuation. Still, the general formula of the expected bankruptcy costs (EBC) is provided as follows:
EBC = Probability of Default∗ Bankruptcy Costs
The problem related with this formula is that, while there is a too vague proxy to determine the probability of default, to estimate a company bankruptcy costs there is no proxy at all.
The approach to be used to estimate the probability of default is based on the traded bond rating of a company. Damodaran provides a table with interest coverage ratios, and then attributes to each of them a rating and its associated spread. Therefore, one needs to determine the company’s interest coverage ratio, and then verify to which spread it is associated. The spread obtained for a company will be representative of the company probability of default.
The estimation process of expected bankruptcy costs turns more difficult when one tries to predict the bankruptcy costs. While direct bankruptcy costs may be simpler to estimate, the indirect ones are quite more difficult. Yet, Altman (1984) states that indirect bankruptcy costs should not be measured, as they represent unexpected losses. After all this variables have been identified and the expected bankruptcy costs calculated, the value of a company through the APV is given by:
VL = VU + PV(ITS) - EBC
As one can conclude from the formula, the value of a company calculated through the APV model is a function of the value of the company “unlevered”, its interest tax shield and expected bankruptcy costs.
2.8. Present Value of Interest Tax Shields
It is a very common mistake people think that an all equity financed company worth more than the same company but with debt. Indeed a company with debt has obligations and scheduled repayments, but also has interest tax shields (ITS) – reduction in income taxes that results from taking an allowable deduction from taxable income. This effect happens because debt is a tax-deductible expense, and so it is a way for the company to save cash flows, therefore increasing its value. However, debt only increases the value
18 of a company until a certain level – optimal debt-to-equity ratio. This is because the increase of the debt level also increases the distress costs the company is subject to, and so if the debt-to-equity ratio is higher than the optimal one, the company has more expenses with distress costs than advantages from the tax shields.
The interest tax shields are one of the biggest differences between the DCF and the APV models, as the last one discriminates their value, while DCF model accounts it directly on the WACC approach. However there is not a single and coherent way to compute the present value of the interest tax shields. Fernandez (2006) states that in case a company does not have a constant debt level, anticipating its increase, the formula that should be applied is:
PV(ITS) = D∗ RD ∗ T (1 + RD )t
In the other hand, Cooper and Nyborg (2006) suggest the formula as follows: PV(ITS) = D∗ RD ∗ T
(1 + Re)t
This approach differs from the one of Fernandez (2006) in the rate used to discount the tax shields. Fernandez affirmed that the formula could be accepted if the company maintains its debt levels, otherwise its risk would change, as the discount rate.
2.9. Dividend Discount Model
The Dividend Discount Model is a valuation model that requires different inputs than the other mentioned models. In fact, it is based on the theory that a company’s stock is worth the sum of all its future dividend payments, discounted to their present value. The DDM can be split into two separate models: the Gordon Model and the two-stage Dividend Discount Model.
According to Damodaran (2006), the Gordon Model assumes that the value of a company results from its expected dividends in the next period, its cost of equity and its expected growth rate in dividends in perpetuity. This relationship is given as follows:
Value of Stock = E(Divt+1) Re - g
The model is simple to perform, but may be misleading if not used properly. Actually, the Gordon Model is hyper-sensitive to changes in the expected growth rate, since it represents the growth in perpetuity. Consequently, if the correct rate is not applied, the value of stock achieved may be hugely incorrect. Moreover, assuming that a company
19 does not pay dividends periodically, neither at a constant growth rate, the application of this model may be difficult and unadvised.
The second model is the two-stage Dividend Discount Model, which aims to fill the gap of a constant growth rate indicated in the Gordon Model. In this model there is an initial phase in which the dividend growth rate is not stable, and then at the steady state it turns stable and constant in perpetuity. However, Damodaran criticizes this model in the sense that it is difficult to determine the duration of the time period in which dividends grow at non-stable rates. Further, the author states that the move from the initial phase to the second is done suddenly – from one time period to the other, which is not likely to happen.
This model is reasonable if applied on companies that fill certain characteristics and perform on determined sectors. Otherwise, its application can be non-sense.
2.10. Economic Value Added
The Economic Value Added is a valuation method focused on measuring the surplus value created by an investment. Its formula is given as:
EVA = (Return on Invested Capital - Cost of Capital)∗ Capital Invested
Damodaran defines the return on capital as the “true” cash flow return on capital gained on an investment, while the cost of capital results from the weighted average cost of capital of the different financing instruments used in an investment. The author alerts that both should be on market values, as is a common mistake from practitioners to use book values. Moreover, the author identifies the capital invested as the capital invested both in assets-in-place and on future growth.
The EVA model is not one of the most famous models used on valuation exercises, but it is strongly related with the DCF model. According to Damodaran, the value of a firm can be written in terms of the economic value added of projects in place and the present value of economic value added of future projects, which can be seen as a decomposition of the DCF model.
The model is seen as a Net Present Value (NPV) since it cares about the value added of companies. However, unlike NPV theory, not always the companies with the superior EVA are the best, since in this model the focus point is changes on EVA and not its absolute value. Consequently, when choosing between a “below-expectation” EVA company and one with no EVA at all, the one without EVA should be chosen as expectations are the driver of stock price.
20 Finally, Damodaran suggests that all investment strategies based on EVA should be cautiously defined, highlighting the ones done on firms where expectations are built over prices of “high” surplus returns, since those expectations can be misleading.
2.11. Conclusion
After study all the methods explained in this section, it was decided to perform Walt Disney valuation through relative valuation, the Economic Value Added and Discounted Cash Flows models.
The relative valuation is coherent across practitioners as a good second-stage valuation due to its simplicity and easy interpretation. Also, it allows evaluate the company based on its comparable companies, therefore turning possible to understand the position that Walt Disney has in the market. The multiples approach is done based on the Enterprise Value-to-EBITDA, Enterprise Value-to-EBIT, Enterprise Value-to-Sales and Price-to-EBITDA ratios. The criterion for this selection was the complementarity. Three of the mentioned ratios provide as output the enterprise value of a company. So, it was chosen to compute it on several different ways in order to have a notion of the sensibility and variation the output can have according to the value driver used.
The price based multiple is also considered due to its acceptability and easiness to understand. Plus, the Price-to-EBITDA mixes a metric that is capital structure neutral (EBITDA) with another which is not, and therefore a different approach to the company valuation can be obtained through this ratio. It is believed that this whole group of ratios can give a more accurate valuation of Walt Disney, as jointly they solve some limitations of relative valuation.
Another valuation method that was chosen to be used in this valuation exercise is the Economic Value Added. Even though this one is not one of the most appreciated models, it is believed that it provides interesting hints about the company’s profitability, which is understood as an important add-in to a valuation exercise.
The last valuation method selected was the Discounted Cash Flows model, based on the WACC approach. Walt Disney has been exhibiting a stable capital structure in relative terms, being therefore reasonably acceptable that this capital structure will keep on the following years. Therefore, as the capital structure is expected to keep stable, the WACC and the levered beta are also expected to maintain their levels when forecasting the cash flows, which support a more accurate valuation through DCF model based on the WACC approach.
21 When comparing the APV model with the DCF one, the last was chosen because the company has a stable capital structure as referred above. Also, the uncertainty derived from mainly the estimation of bankruptcy costs which, in the absence of an accurate model, may lead to a misleading valuation, was strongly taken into consideration in this choice.
Lastly, it was not considered the Dividend Discount Model. Despite its simplicity, the model is not believed to be the most accurate method to evaluate Walt Disney, as the company has not a clearly defined dividend policy.
3. Industry Overview
Walt Disney, as a diversified multinational company, is inserted in several market sectors all over the world. In this section is given an outlook about the sectors in which it operates: TV broadcasting, filmed entertainment, video game, tourism and hotel, and consumer products sectors.
3.1. TV Broadcasting Sector
Over the last years it has been verified a tremendous change over media content and, most important, its distribution. This resulted in the emerging of several opportunities for companies, especially to those linked to the distribution and consumption of digital content.
The easiness of access to all kind of content, especially through mobile devices, turned the sector more competitive, as consumers can choose what they want to see and when. Therefore companies have to adjust their strategies in order to satisfy their target customers. In fact, this adaptation process already displayed results, as nowadays companies’ products supply consists in multi-platform ones, in order to answer to the demand that new selective customers make.
The emergence of opportunities for distribution of digital companies supported the sector’s growth, as can be seen in graph 1.
22
Graph 1 - U.S. broadcasting industry revenues from 2005 to 2012. Values are expressed in USD billion. Data source: Statista.
The revolution in the sector displays several opportunities for companies, as they can expand and compete for target customers that previously were out of their sight, but can also raise risks for the ambitious ones. The most important risk is the one related to the investment required to make part of this new trend, as delivering content for a variety of platforms imply huge costs with manufacturing and operating systems, digital content distributors, telecom service providers and intellectual property managers.
Nevertheless, as one can see, there has been a big increase in the revenues generated by the industry since 2009. This is due to the distribution revolution already mentioned, but also to the range of options that customers demand nowadays, therefore giving opportunities to specialized companies to arise and compete for their target customers.
3.2. Filmed Entertainment Sector
Associated to the filmed entertainment sector since it appeared, U.S. has one of the oldest film industries, highlighted by Hollywood, which supported the spread of the industry worldwide.
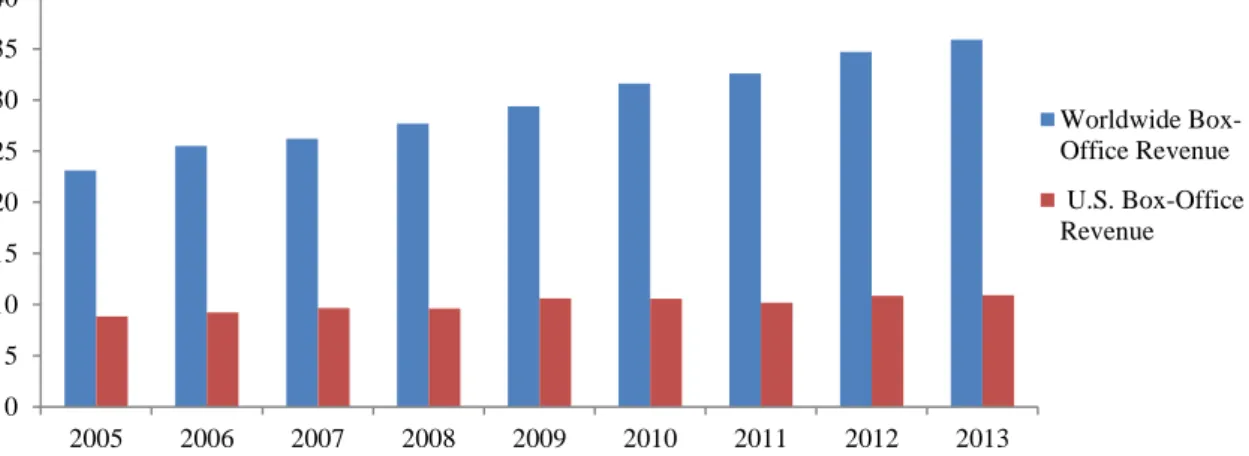
In graph 2 can be seen the evolution of revenues generated from the box-office both in the U.S. and worldwide. As one can realize, the industry increased considerably over the last years, growing worldwide approximately 55% from 2005 to 2013. This growth is due to the growing demand in emerging markets, namely China, but also to the constant growth of mature markets, as of U.S. and Japan.
0 20 40 60 80 100 120 140 2005 2006 2007 2008 2009 2010 2011 2012 U.S. Broadcasting Industry Revenues
23
Graph 2 – Worldwide and U.S. box-office revenue generated from 2005 to 2013. Values are expressed in USD billion. Data source: Bloomberg.
Moreover, in the table below can be seen the domain that U.S., jointly with Canada, have over this industry, whereas its box-office revenue represents approximately 30% of the worldwide revenues. Plus, it can be verify the presence of emerging markets in the top-10, as of India and South Korea.
Country Box-Office Revenue Worldwide %
U.S. & Canada 10.900 30,36
China 3.600 10,03 Japan 2.400 6,69 United Kingdom 1.700 4,74 France 1.600 4,46 India 1.500 4,18 South Korea 1.400 3,90 Russia 1.400 3,90 Germany 1.300 3,62 Australia 1.100 3,06 Worldwide Industry 35.900 -
Table 1 - Top 10 box-office revenue generating countries worldwide in 2013. Values are expressed in USD million. Data source: Bloomberg.
Besides the increase of the industry’s demand and supply, the entertainment industry has been growing over the last years also due to the innovation that has affected it, leading to changes of traditional processes. In fact, the delivery mechanisms typically used for movies’ distribution – i.e. physical home video, as DVD and Blu-ray, are changing. Nowadays, consumers tend to use more streaming and broadcasting services and, according to PwC Global entertainment and media outlook report, the revenues generated by this modern delivery system will overtake the ones generated by the traditional one. 0 5 10 15 20 25 30 35 40 2005 2006 2007 2008 2009 2010 2011 2012 2013 Worldwide Box-Office Revenue U.S. Box-Office Revenue
24 The growth that the industry has been displaying and the changes caused by innovative processes, as the delivery mechanisms, support the potential that the industry has. In figure 1 can be seen the growth potential of the industry geographically. As was perceptible by the analysis of the sector, emerging markets as Argentina, Brazil, Russia, Mexico and India, jointly with China and United States, are some that are expected to keep increasing over the next years, supporting the growth of the industry. The expectations about China should be highlighted, as its forecasted revenues are expected to go from $3,6 billion in 2013 to $7,0 billion in 2018. Lastly, United States’ revenues generated by this sector are still expected to domain at a worldwide level, even though they are estimated to increase at a lower rate, forecasted to reach $13,7 billion in 2018.
Figure 1 - Filmed entertainment sector forecasted rate of growth and scale, from 2013 to 2018, for each country. Source: Global entertainment and media outlook 2014–2018, PwC, Informa Telecoms & Media.
3.3. Video Game Sector
Focused in the production of video games, the sector has been increasing over the last years, due to the global mobile games and online console game stores. Graph 3 illustrates the evolution of the revenues generated by the sector worldwide. The biggest contribution for the revenues generated in the last years comes from Japan, which generated $22,29 billion in 2013.
Higher-growth, larger-scale markets
Higher-growth, smaller-scale markets Lower-growth, larger-scale markets Lower-growth, smaller-scale markets
25
Graph 3 – Worldwide and U.S. video game sector generated revenue from 2005 to 2013. Values are expressed in USD billion. Data source: Video Game Sales Wiki.
The industry has been developing itself, with the introduction of social and casual gaming and the regularization of online games which were considered lost to “piracy”. Plus, there has been an expansion of console gaming companies on emerging markets, mainly in India and Brazil, whereas in the later one the opening of a manufacturing plant by Sony represents a clear shot to drive growth.
In figure 2 one can see the growth potential of each market by geographical area, from which can be conclude that Brazil, Mexico, Russia and India are the countries where the sector is expected to boost. In the U.S. the growth is expected to be slow, besides being a large-scale market, while in the African countries the expectations are very low, as it is a continent with difficult access to this technology.
Figure 2 - Global video games market forecasted rate of growth and scale, from 2014 to 2018, for each country. Source: Global entertainment and media outlook 2014–2018, PwC, Informa Telecoms & Media.
0 10 20 30 40 50 60 70 80 2005 2006 2007 2008 2009 2010 2011 2012 2013 Worldwide Video Game Sector Revenue U.S. Video Game Sector Revenue
Higher-growth, larger-scale markets Higher-growth, smaller-scale markets
Lower-growth, smaller-scale markets Lower-growth, larger-scale markets
26
3.4. The Tourism and Hotel Sector
Being one of the biggest sectors worldwide, the tourism and hotel sector is actually the fifth largest employer in the U.S., and one of the most important economy drivers. The promotion of travel and tourism as a top creating priority for the U.S. government supported the generation of several strategies that led the industry to grow considerably. The most important one is the destruction of barriers to trade in travel services in order to increase travel flows, by engaging with international partners and by keeping the aviation liberalization. The streamline of the visa application process is also being performed in several countries, namely China and Brazil. Plus, the White House established an overarching goal of increasing American jobs by attracting 100 million international visitors, which are estimated to spend $250 billion per year, by the end of 2021. Moreover, it has been intended to encourage Americans to travel within the American territory. Promoting the U.S., enabling travel and tourism to and within itself, providing world-class customer service and visitor experience, and coordinating federal agencies with public and private partners are some strategies adopted to maximize the potential of the sector.
By analyzing graph 4, one can realize that there has been a constant increase in the arrivals since 2009, being registered in 2013 a historical record in U.S.
Graph 4 – Total arrivals to U.S. from non-residents. Values are expressed in thousands. Data source: ITA – Office of travel & tourism industries.
The performance of the sector is reinforced by the analysis of the value generated by exportations of travel and tourism related services, as can be seen in the graph below.
0 10.000 20.000 30.000 40.000 50.000 60.000 70.000 80.000 2006 2007 2008 2009 2010 2011 2012 2013 Arrivals of non-residents to the U.S.
27
Graph 5 – Amount generated by exportations of travel and tourism related services in U.S. All values are expressed in USD million. Data source: Bloomberg.
Revenues generated by exportations of the sector have been increasing considerably, displaying a growth rate of 7% over the last two years, registering $215 billion in 2013.
3.5. The Consumer Products sector
After the fall this sector had during the financial crisis of 2008, it has been recovering and reaching the growth levels it displayed before the crisis. This idea is reinforced by Pat Conroy, U.S. Consumer Products leader at Deloitte LLP, which states that the embracement of technology to shop can boost the sector, even though several companies already have that facility.
As the economic environment worldwide has been improving, the purchasing power of consumer for this sector is increasing as well. Furthermore, the incorporation of technology on consumer shopping facilitates the interaction of consumers within the sector and can support the growth of companies’ sales. Still, Pat Conroy states that the digital influence can be a disadvantage for several companies, as it allows consumers to compare the different prices charged by them, and choose the ones that best suits to them.
An important factor for the development of this sector is the growth it will have in emerging markets. Despite the fact that these ones are seen as a source of opportunities to drive growth by several consumer product companies, since emerging market economies are growing faster than developed ones, the pace of their growth has reduced substantially in the later years. Therefore, a weaker demand for consumer product than what is expected may be verified in the short-term, which may lead to a slower
0 50.000 100.000 150.000 200.000 250.000 2005 2006 2007 2008 2009 2010 2011 2012 2013 Exportations of travel and tourism related services
28 expansion of those companies over new markets. Nevertheless, the trend that has been verified over the last years give insights that the sector will keep increasing.
By analyzing graph 6, one can verify the behavior of the U.S. consumer price index (CPI). Even though it can be observed that the price level changes have been always positive, its scale has been decreasing over the last years, and therefore consumers have a higher purchasing power compared to past years, whereas the increase of price levels was higher, ceteris paribus.
Graph 6 – Consumer Price Index of U.S. Data source: Bloomberg.
The decrease of the consumer price index over the last years, compared to previous ones, can be due to the stronger competition in the sector, but also to the introduction of digital technologies. In fact, as consumers nowadays can consult the product’s prices through apps or companies’ websites, companies have to adjust their selling strategy in order to do not lose their target customers to their competitors.
4. Walt Disney Company
4.1. Company History
“If you can dream it, you can do it. Remember that this whole thing started with a dream and a mouse”
Founded in October 16, 1923, by Walt Disney and Roy Disney, the Walt Disney Company was created to give life to dreams. The company started producing some short films and cartoon series which did not provide wealthy financial results. So, in order to change the situation of the company emerged the idea of creating cartoons of a mouse character, Mickey Mouse, which ended to turn to be Walt Disney image. Its first cartoon release was an immediate smash hit, and allowed the company to push the boundaries of
0,00% 0,50% 1,00% 1,50% 2,00% 2,50% 3,00% 3,50% 4,00% 4,50% 2006 2007 2008 2009 2010 2011 2012 2013 2014 U.S. CPI
29 animation further. As a results of that goal, it was produced the first feature-length animated film, Snow White and the Seven Dwarfs, which became the highest-grossing film of that time by 1939. With the profits generated by this animated film, Walt Disney was able to construct a studio complex in California, the Walt Disney Studios, in which the company is headquartered to this day. In order to be able to keep growing and take advantage of the unexplored market at the time, the company had its initial public offering in April 2, 1940. Popular animated films were produced, as Pinocchio (1940),
Dumbo (1941), and Bambi (1942), but the World War II forced the company to discover
other ways to grow.
In fact, the World War II obliged several Disney’s animators to go to the armed forces, which limited the company’s staff and consequently decreased its operating capital. So in October 1954, the ABC network launched Disney’s first regular television series, which ended to become one of the longest-running primetime series of all time. It allowed Walt Disney to introduce new projects and broadcast older ones, representing the company’s first entry in the broadcast television market. Later, ABC became partner of the company in the financing of its next venture located in the middle of California. The Disneyland series would lead the company to another expansion. On July 18, 1955, in Anaheim, California, Walt Disney opened Disneyland Park to the general public. This represented the beginning of the company’s expansion through a new market, with the goal of provide to families a place where they could fun all together. Meanwhile, plans were being made in order to build a second Disney theme park, being announced in November 1965 as Disney World, which later ended to be known as Walt Disney
World. This announcement included plans for theme parks, hotels, and even a model
city outside Orlando, Florida.
Years later, in 1979, in order to achieve a higher film production level, Walt Disney entered a joint venture with Paramount Pictures, marked as the first time Disney collaborated with another studio. At the same time, it was being prepared the launch of the Disney Channel, a subscription-level channel on cable systems, which ended to happen in April 18, 1983.
The next years were highlighted by the Walt Disney World. In 1978, the plans for a second Walt Disney World were announced, which would open in October 1982 by the name of EPCOT Center. Plus, jointly with the Oriental Land Company, Walt Disney built its first theme park outside United States in April 1983, in Japan, called Tokyo
30 Despite the success of the company’s theme parks, the financial position of Walt Disney was vulnerable. Therefore, a new CEO and president were announced for the company, in order to turn it more profitable and sustainable. While the first were brought from Paramount Pictures, the second one was from Warner Bros. with the main goal of boosting the company’s animation studio. The results ended to be a huge success, with the productions of The Little Mermaid (1989), Beauty and the Beast (1991), and The
Lion King (1994). Disney moved to the first place in box office receipts, and had its
revenues increasing by 20% every year.
By the time, Walt Disney started expanding by acquiring and investing in several entities in order to enlarge its brand, as for Anaheim Angels (a baseball team), media sources (including a merger with Capital Cities/ABC, which brought broadcast network ABC and ESPN networks), and Starwave. This last one represented the company’s first move into the internet field, which was reinforced by the acquisition of Infoseek in 1999. This year was also important due to the launch of Walt Disney cruise line, with the production of Disney Magic and Disney Wonder, the company’s first ships.
The year of 2005, marked by the appointment of a new director and a new CEO, was a memorable one for the company, with the opening of Hong Kong Disneyland and the production of the first film using 3-D animation, Chicken Little.
The studio entertainment segment of Walt Disney had a huge increase with the purchase of Pixar Animation Studios for $7,4 billion in 2006, the addition of The Muppets Studio in 2007, and later the purchase of Marvel Entertainment, Inc for $4,2 billion in 2009. In 2007, Walt Disney renamed Buena Vista Games to Disney Interactive Studios, creating this way a new segment of activity for the company. Buena Vista Games was initially spun out of Walt Disney for strategic reasons, but then it was believed that it should return to be part of the company, representing a growing new segment for it. The last years have been grateful for the company. In 2011 the company inaugurated the
Shanghai Disney Resort; in 2012 it acquired UTV Software Communications, aiming to
expand their market to India and Asia, and in December 12 it acquired Lucasfilm for $4,06 billion.
The current year has been associated to more acquisitions, namely Marker Studios, a YouTube company, but also involved the announcement of 11 startups that would being in the company’s accelerator program, which aims to develop technology for new media and entertainment.
31
4.2. Company Segments
Walt Disney, a company that started with the purpose of producing entertainment films, is nowadays one of the most diversified worldwide entertainment companies. Together with its subsidiaries, the company has operations in five different business segments: Media Networks, Parks & Resorts, Studio Entertainment, Consumer Products, and Interactive Media.
4.2.1. Media Networks
The media networks segment, the most profitable one from Walt Disney, includes broadcasting services and all kind of television services, as cable television networks, television distribution, radio networks and domestic television stations.
The segment main revenues are provided from the fees charged to satellite, cable and telecommunications service providers, from the sale of advertising time in programs for commercial announcements, and from television stations affiliated to its broadcast television network. Consequently, its highest expenses include production and programming costs, technical support and operating labor.
The segment can be split into two service lines. The first one, cable networks, produces programs and acquires rights from third-parties to air programs on Walt Disney networks. It includes ESPN, ABC family, SOAPnet, A&E Television Networks, and Disney Channels Worldwide. Its revenues are derived mainly from fees charged for the right to deliver programming, and regarding ESPN and ABC family, revenues are also obtained from the sale of time in network programs to advertisers, for commercial announcements. The second service line, the broadcasting services, includes a domestic broadcast network, the television production and distribution operations, and 8 owned domestic television stations. Besides, Walt Disney has interest in a joint venture, Hulu LLC, which distributes film and television content on the internet. The biggest resource the segment has is the ABC Television Networks, which accounts for more than 240 affiliation agreements with local television stations.
4.2.2. Parks & Resorts
Walt Disney owns and operates several amusement structures all over the world, while owns ownership interests in many others. The company owns the Walt Disney World Resort in Florida, Disneyland Resort in California, Aulani Resort and Spa in Hawaii, some Disney Vacations clubs, and the Disney Cruise Line and Adventures. In the other
32 hand, it manages and has effective ownership interest in Disneyland Paris, Hong Kong Disneyland Resort and Shanghai Disney Resort, while licenses the operations of the Tokyo Disney Resort in Japan.
Revenues associated to this segment are mainly generated from the sale of admissions to theme parks, the sales of cruise vacation packages, the room nights at hotels, and the rental of vacation club properties. Consequentially, its main costs include labor expenses, depreciations, marketing, and maintenance of the infrastructures.
Walt Disney World Resort has to be highlighted, as it is the company’s biggest resort, which includes several theme parks, hotels, dining, entertainment and sport complexes, and golf courses. The Resort possesses the “home” of Cirque du Soleil, and has several attractions and restaurants sponsored by other corporations.
Moreover, by having 51% effective ownership interest in Disneyland Paris, 48% interest in Hong Kong Disneyland Resort, 70% interest in Shanghai Disney Resort (the resort will only open in 2015, but proposals and contract details are already agreed), and by managing the Tokyo Disney Resort, in which it owns royalties on its generated revenues, Walt Disney can strategically position itself worldwide among the best entertainment companies in the most notorious countries.
4.2.3. Studio Entertainment
The studio entertainment segment is the most popular one from Walt Disney. This segment produces and acquires live-action and animated motion pictures, direct-to-video content, musical recordings and live stage plays. It generates revenues mainly from the distribution of films in all markets, including theatrical, home entertainment and television ones, under the Walt Disney Pictures, Pixar, Marvel, Touchstone and Lucasfilm banners.
Walt Disney has been trying to expand its scope for the films distribution, which is supported by the acquisition of 99% interest of India’s UTV, one of the leading film production studios and film distributors in India. This movement represents the strategic approach the company aims to perform, in order to reach not overcrowded markets. Regarding the theatrical market, the company produces and distributes both live-action films and full-length animated films, accounting for 991 and 98 releases as of August 2014, respectively. The company usually distributes and markets its own filmed products directly in both domestic and most international markets, while in some they are distributed by independent distribution companies
33 The television market consists in home entertainment distribution through several mechanisms, as through pay-per-view, pay television, or cable network. This is a way the company has to explore its theatrical films releases and, at the same time, reclaim the older ones.
Per last, the segment is also exploring the music and theatrical production, through the Disney Music Group and Disney Theatrical Productions. While the first consists in producing concerts, distribute recorded music and license its music properties throughout the world, the second one is based in producing live entertainment events, as Broadway musicals.
4.2.4. Consumer Products
This segment engrosses mainly retailers, but also licensees and publishers, throughout the world to develop, publish, and sell the wide diversity of products based on Walt Disney’s intellectual property, as its successful movies and live-action television programming, through merchandise licensing and retail business.
The segment generates royalty revenues by licensing the characters from its studio productions to third parties to use on consumer merchandise. The royalties established are typically based on a fixed percentage of the retail selling price of the products. The merchandising covers a varied range of products, as toys, furnishings, food, footwear, and consumer electronics.
The most significant costs associated to this segment are related to the costs of goods sold, distribution expenses and the retail occupancy costs. Regarding the last one, the costs are supported by the several stores that Walt Disney possesses to spread its brand, whereas 214 are in North America, 88 in Europe and 46 in Japan.
4.2.5. Interactive Media
As the “youngest” segment, the interactive media segment consists in creating and delivering branded entertainment across interactive media platforms. Its main output are the interactive games and the interactive media, whereas the first consists in producing multi-platform games for distribution, and the second in developing branded online services.
The revenues from this segment are generated from the sale of multi-platform console games, subscriptions for online and mobile games, online advertising and sponsorships. It also generates fees from the licensing to third-party game publishers.
34 The segment aims to reach all the possible markets for interactive games, and so nowadays the company develops console, mobile, social, and virtual games on a worldwide basis. Plus, the interactive media segment also focus in developing, publishing and distributing interactive content through several platforms (i.e. Disney on YouTube), and develop applications for families.
5. Valuation Overview
In order to achieve Walt Disney valuation accurately, several assumptions have to be made in order to forecast the performance of the company over the explicit period, from 2015 to 2017. Therefore in this section is introduced the estimation process of the most important inputs for the valuation model that ends to be considered the main one for this valuation exercise – the Discounted Cash Flows model.
5.1. Estimation of Revenues
After the decrease of Walt Disney revenues in 2009, due mainly to the worldwide financial crisis, the company revenues have been growing yearly at an average of 5,66%, reaching the highest growth rate of 7,44% in 2011.
Graph 7 – Walt Disney revenues by segment, in 2013. Values are expressed in USD million. Data source: Walt Disney Company annual financial report 2013.
Based on the industry overview section, one can be optimistic about the company’s future, as all sectors in which it operates are expected to grow. Moreover, according to Robert A. Iger, Chairman and C.E.O. of Walt Disney Company, “Fiscal 2013 was yet another exciting year for Disney, as the company delivered our third consecutive year of
20.356 14.087 5.979 3.555 1.064 Media Networks
Parks & Resorts
Studio Entertainment
Consumer Products