Tackling the Metals and Mining Industry Crisis: Anglo American’s
Successful Restructuring Plan
Juan Tolosa Olazabal
152417081
Dissertation written under the supervision of Ricardo F. Reis
Dissertation submitted in partial fulfilment of requirements for the MSc in Finance at Católica-Lisbon School of Business & Economics
Abstract
This paper studies the metals and mining industry during the last commodity super-cycle, which triggered by explosive growth of emerging economies helps understand the empire building behavior engaged in by leading mining companies and the financially distressed industry at the end of the cycle in early 2016. The study documents the costly asset acquisition plans and the excessive leverage levels pursued by various firms, hence finding additional evidence of managerial overconfidence and excessive corporate investment theories during boom cycles. With further aim of understanding successful company restructuring processes, we present the case of Anglo-American, a diversified metals and mining company that faced the wrath of plunging commodity prices on top of an enormous debt pile and major operational inefficiencies. The analysis of the company’s trajectory during the boom cycle and the radical restructuring plan implemented to enhance long-term prosperity serves as a proxy for future commodity super-cycles and helps flag certain actions taken by managers at times of favorable economic conditions. Keywords: Commodity super-cycle, Empire building, Restructuring
Resumo
Esta tese estuda a indústria mineira durante o último super-ciclo das commodities o que, desencadeado por um enorme crescimento das economias emergentes, ajuda a perceber o comportamento de empire building adoptado por empresas que lideram a indústria, bem como as dificuldades financeiras sofridas no fim do ciclo, no início de 2016. Este estudo documenta o dispendioso plano de aquisição de ativos e os excessivos níveis de endividamento adoptados pelas empresas e, por esta razão, vai de encontro às teoria de excesso de confiança por parte dos gestores da empresa e de excesso de investimento empresarial. Com o objetivo adicional de perceber processos de restruturação bem sucedidos, apresentamos o caso da Anglo-American, uma empresa diversificada da indústria mineira que sofreu o impacto da descida do preço das commodities, num momento em que estava sobre-alavancada e com elevadas ineficiências operacionais. A análise da trajetória da empresa durante o ciclo de expansão, aliado ao seu plano de restruturação radical implementado para melhorar a perspetiva de longo prazo, serve como um indicador para o futuro super-ciclo das commodities e ajuda a sinalizar ações levadas a cabo pelos gestores aquando de condições económicas favoráveis.
Table of Contents
1. Introduction ... 1
2. Literature Review ... 2
2.1 Commodity Super-Cycles ... 3
2.2 Risk Management ... 4
2.3 Bankruptcy and Distress Prediction Models ... 6
3. Case Study ... 7
3.1 Overview of Anglo American ... 8
3.2 The Industry ... 12
3.3 Anglo-American’s Master Plan ... 18
3.3.1 Barriers to Execution ... 19
3.3.2 Debt and Operational Restructuring ... 21
4. Conclusion ... 27
5. References ... 29
List of Tables
Table 1 – Anglo American Total Revenues and EBITDA ... 8
Table 2 – Anglo American Total Revenues by Geography ... 12
Table 3 – Industry Capital Expenditure Figures ... 13
Table 4 – Change in Major Commodity Prices ... 15
Table 5 – Industry Leading Companies Stock Price Variations ... 17
Table 6 – Anglo American Total Corporate Bonds Outstanding Amount ... 21
Table 7 – Anglo American Weighted Average Maturity and Cost of Bonds Outstanding ... 22
Table 8 – Company Debt Ratios ... 24
Table 9 – Accounting Based Credit Scoring Model Results ... 25
Table 10 – Company Capital Expenditures ... 25
Table 11 – Working Capital Schedule ... 26
List of Graphs Graph 1 – Anglo American EBITDA by Commodity ... 10
Graph 2 – Dow Jones, FTSE 100 and MSCI Index Fluctuations ... 14
List of Appendices Appendix 1 – Altman, Ohlson and Zmijewski Credit Scoring Models ... 32
Appendix 2 – Dow Jones, FTSE 100 and MSCI Index Fluctuations ... 33
Appendix 3 – Bond Outstanding Structure FY15-FY17 ... 34
Appendix 3.1 – Bond Outstanding FY15 ... 34
Appendix 3.2 – Bond Outstanding FY16 ... 35
List of Abbreviations
Anglo Anglo American
BRICS Brazil, Russia, India, China and South Africa Capex Capital expenditures
CBS Corporate Bond Spread
CDS Credit Default Swap
CEO Chief Executive Officer
CF Cash Flow
DCM Debt Capital Markets
EBIT Earnings Before Interest and Taxes
EBITDA Earnings Before Interest, Taxes, Depreciation and Amortization
ERM Enterprise Risk Management
FCF Free Cash Flow
GDP Gross Domestic Product
MDA Multivariate Discriminant Analysis MSCI World’s Metal and Mining Index
NAV Net Asset Value
NPV Net Present Value
PwC Price Waterhouse Cooper
RCF Revolving Credit Facility ROCE Return on Capital Employed
SIB Stay-in-Business
USD United States Dollar
WABC Weighted Average Bond Cost
WAM Weighted Average Maturity
1. Introduction
Given the devastating effects of the low commodity prices on the metals and mining industry during the last commodity super-cycle, it is important for finance experts to understand the causes that led the industry to a financially distressed position. The case helps identify red-flagging actions taken by executives in the future and properly manage risk to enhance financial performance and long-term sustainability.
As such, we start by examining the pioneering work of Kondratiev (1925) and Schumpeter (1927), who set a strong foundation to be able to analyze common economic trends throughout commodity super-cycles. However, we emphasize the third and last to date commodity super-cycle identified by Radetzki (2006), which, driven by extreme growth in BRICS economies and their massive urbanization and industrialization plans, led firms to ramp-up production and acquire costly assets to cope with the booming demand of resources.
Firms in the industry engaged into overinvestment activities, increased capital expenditures, burnt through cash reserves and over-levered their balance sheets, hence jeopardizing long-term sustainability and only realizing short-term gains while commodity prices were high. Consistent with literature from Jaimovich and Rebelo (2006), which finds a positive correlation between investment in negative NPV projects and increasing levels of debt in firms during boom cycles, we find executives being overconfident about the returns of new investment opportunities and underestimating probabilities of failure, hence building empires that were bound to tumble when difficult economic conditions came around.
Although many companies were affected by the commodity price drops in 2015, Glencore, Anglo and Vale were three of the companies that suffered the most from the crisis. Struck by plummeting commodity prices and credit downgrades from Moody’s and S&P (to junk status in the case of Anglo), the mentioned companies had to drastically change strategies to re-shape their operational and financial status and bring them back to a long-term profitability position. Given the empire building strategy pursued by Anglo during the boom and its successful turnaround strategy during the bust, we decide to deep dive into its case to draw significant conclusions that can be used for future reference.
In the case study presented, we analyze the overall situation of the industry and find common strategies adopted by firms during the time of economic expansion and recession, to then
emphasize the financial and operational position of Anglo during the entire cycle, as well as its restructuring strategy that was announced at the end of 2015.
Thus, we present a detailed explanation of Anglo CEO’s master plan, which in summary consisted of cutting capital expenditures, improving the working capital position of the firm, selling inefficient assets, improving operational efficiency and reducing debt. We put special emphasis on the financial side of the restructuring and explain why Anglo was thought to be in trouble to repay debt obligations if the situation continued. In order to do so, we analyze the debt structure of Anglo before and after the restructuring and look at its liquidity position and the levels of debt sitting on its balance sheet.
We use financial debt ratios such as “Gearing”, “Interest Coverage” or Net Debt to EBITDA to assess the financial position of the company, as well as accounting-based credit scoring methods in order to see if the credit downgrades received by credit ratings agencies were justified. Special focus is geared towards the debt issued in the DCM and the amount of bonds outstanding from 2015 to 2017. This piece is key to understand the financial restructuring plan, as it clearly shows how debt was refinanced and how the WAM of bonds was increased to mitigate the high short-term refinancing risk Anglo was facing at the time. Overall, the analysis allows us to determine the effectiveness of the plan and notice the compromising position the company found itself in at the end of 2015.
The following sections include a literature review (2) on commodity super-cycles, risk management and bankruptcy predictions, which set the foundations to understand the case study of Anglo presented in Section 3. We continue with an overview of the company (3.1), an industry analysis (3.2), the restructuring plan (3.3) and a conclusion (4) that addresses the main findings of the study.
2. Literature Review
The following section reviews empirical work carried on topics relevant to the case study of Anglo and its operational and financial restructuring that followed the widespread commodity price crash of 2015. The presented literature addresses the existence of commodity super-cycles across history, traditional risk management versus all-round ERM practices, empire building that
often leads to unsustainable long-term growth, and classic bankruptcy prediction models that are used by institutions to assess the credit health of companies.
2.1 Commodity Super-Cycles
Major swings in commodity prices have been the focus of many academic articles since the mid 20th century, starting with the work of Kondratiev (1925), who identified the presence of
extensive commodity waves lasting from 40 to 60 years. Not long after, Schumpeter (1927) discovered three types of overlapping commodity cycles, divided into: long-term 50-year waves (Kondratieffs), medium-term nine to ten-year waves (Juglars) and short-term three-year waves (Kitchins). Their pioneering groundwork has been further researched since then, and academics have developed more sophisticated analytical models to deeply understand the behavior of commodities and their impact on the global economy.
A notable piece of literature that builds upon previous work comes from Radetzki (2006), who shows that there have been three major commodity waves since the second world war. Although the three booms were triggered by slightly different reasons, they all had a few characteristics in common, among others: high levels of GDP, positive inflation and accelerated growth in the industrial sector. These all led to major demand shocks that resulted in widespread economic growth and an upward outburst in commodity prices. Similarly, the end of the booms coincided with exactly the opposite pattern than the beginning of them, namely declines in commodity prices, shrinking GDP growth and a slowdown of industrial production (Radetzki 2006).
The first commodity super-cycle (1949-1953), known to be as the weakest out of the three, was caused by the Korean war and the status of South and East Asia as key agricultural and mineral commodity suppliers. Insecurity around the political situation in the region and the fear of it expanding overseas led to a strategic build-up of inventory, which globally increased the demand for commodities and, consequently, their prices. The build-up slowly faded once the population understood that the war was niche to the area, thus omitting the possibility of it spreading globally and bringing the first commodity wave to an end (Radetzki 2006).
The second boom (1972-74) coincided with many factors that did not only make it more pronounced than the first, but also arguably the strongest if looking at the overall growth of the
global economy. The outrageous burst in crude oil prices, strong economic performance in 1972 and the first half of 1973, scarce agricultural and food inventories due to crop failures (Radetzki 1974), and speculation for commodities as a safe haven brought many commodities to reach historical price records (Cooper and Lawrence 1975). Not long after, the stock market crash and the oil crisis that commenced at the end of 1973 pulled prices back to 1972 levels, hence giving an end to the cycle (Radetzki 2006).
Finally, Radetzki (2006) argued that the third wave (2003), which was strongest among metals and minerals commodities, was triggered by extreme growth in BRICS economies. In fact, while growth in developed economies was strong at 2.5% p.a. on average since the early 2000s, emerging markets were expanding at 6.4% p.a. on average, with China and India being frontrunners of the expansion (Farooki 2009). Erten and Ocampo (2013) later solidified Radetzki’s (2006) findings and also attributed the last super-cycle to the explosive growth of BRICS countries. Thus, and no different than the previous booms, the economy experienced fast macroeconomic expansion, which caught producers bare-handed with limited inventories and production capacity (Radetzki 2006). The end of this commodity super-cycle was highly related to the cooldown in BRICS, along with other factors that led the metals and mining industry to a concerning situation in 2015.
2.2 Risk Management
Traditional risk management techniques such as commodity hedging and corporate insurance have been proven to reduce the probability of financial distress, companies’ taxes and conflicts of interest between all stakeholders, as well as creating positive value investment opportunities (Stulz and Smith 1985; Ashby and Diacon 1998). However, since the financial crisis of 2008, firms have adopted an all-round enterprise risk management (ERM) approach to cope with black swans and other costly lower-tail occurences (Meulbroek 2002).
ERM, defined as the process of helping an entity get what it wants to achieve and avoid troublesome events along the way (COSO 2004), controls for all risks associated with running a business, both quantitative and qualitative, and identifies profitable investment opportunities that maximize shareholder wealth, thus reducing the risk of financial distress. While there is still limited empirical evidence about the positive effects of ERM, Hoyt and Liebenberg (2011)
documented in their study that ERM practices have delivered positive results and have been well regarded by the market when executed. In their study, they found a statistically significant positive relation of 16.5% between firm value and the implementation of ERM.
While it is undeniable that companies who engage in traditional risk management practices hedge against risks that would hinder their growth and hurt their performance, they find that the individualization of tasks often leads to management inefficiencies, namely communication and capital allocation issues. However, ERM allows companies to look at the bigger picture and understand risk as a collective measure, thus allowing for better risk assesment and identification of investment opportunities. Moreover, the high level of disclosure provided by ERM practices signals commitment to long-term growth of operations, avoids regulatory issues, and reduces costs. Given the positive effect of the approach on companies, ratings agencies such as Moody’s and S&P have devoted part of their rating analyses to company risk management assesments and have put special emphasis on ERM, thus incentivizing firms to engage in these processes (Meulbroek 2002). Different than traditional risk management practices, ERM also evaluates important qualitative factors such as management experience, ESG scores, relationship with suppliers, and loyalty of customers among others, which have a direct impact on the long-term health of companies.
A key risk to mitigate to ensure long-term prosperity of companies is manager overconfidence and excessive corporate investment, also often referred to as empire building. As Jensen’s (1986) agency cost of FCF theory suggests, managers often use available FCF to pursue strategies that are detrimental to the long-term benefit of firms and are instead focused on short-term gains. Classic corporate finance literature addresses this issue and argues that this problem can be avoided by taking on optimal levels of debt that force managers to pay the firms obligations, hence reducing project overinvestment (Stulz 1990).
Contrary to the classical view of Stulz (1990), Jaimovich and Rebelo (2006) suggest that there is a positive correlation between investment in negative NPV projects and increasing levels of debt in firms during boom cycles. A few explanations for poor project capital allocation are: (i) CEOs are often overoptimistic about their past record and the booming outlook of the markets, overstate the returns of new investment opportunities, and understate probabilities of failure; (ii) managers want to build large empires, especially while the markets grow; and (iii) engage in managerial entrenchment to enhance personal gains against the interest of shareholders and
increase power within the firm (Malmendier and Tate 2005). Thus, it can be argued that decision makers tend to be increasingly oblivious to risks and end up engaging into excessive risk taking behavior by investing in negative NPV projects during times of economic expansion (Jaimovich and Rebelo 2006).
2.3 Bankruptcy and Distress Prediction Models
Credit risk and bankruptcy prediction models have received special attention for many years due to their capability of identifying early signs of financial distress and bankruptcy. Since the first steps of Woodlock (1939) towards reliable bankruptcy models, many accounting and market based bankruptcy prediction models have been developed by a handful of academic researchers. On the accounting-based models side, Altman (1968) arguably developed the most known accounting-based model ever, but Ohlson (1980) and Zmijewski (1984) accounting scores are also well-regarded and often seen as improvements of the Altman Z-score. The three methods include a mix of profitability, liquidity and leverage ratios to assess bankruptcy probabilities, with the exception of Ohlson (1980), which also includes size into the equation.
Although the mentioned models are still widely used by firms and are helpful to flag situations where companies are likely to enter distress situations, some researchers argue that the distribution of accounting ratios fluctuates over time, hence needing to recalibrate the original equations (Mensah 1984). Thus, many firms also use market-based models such as CDS, CBS, KMV or the Merton Model as support to the accounting models. Given that the main purpose of the report is not a credit analysis of Anglo but rather the build-up of events that led to the restructuring of the company in 2015 and the actions taken by the management team, we use the three mentioned accounting models to determine if these methods were red-flagging the situation from an early stage.
Altman (1968) was the first academic to criticize basic ratio analysis by developing a MDA approach that used 22 key ratios of a company as an input to determine the company’s probability of default. As seen in the formula found in Appendix A, only the most significant 5 ratios were used in the final equation. The method had 95% accuracy one year before failure and 83% two years before, and classified the Z-scores as: Z>2.99 - no risk of bankruptcy, 1.81<Z<2.99 - grey zone or moderate chance of default and Z<1.81 – high chance of default (Altman 1968). While the
Z-score model is still widely used by banks and other firms to assess the overall credit health of companies, it has a few limitations worth noting. The biggest critics to the model arise from Grice and Ingram (2001), who argued that the model is both outdated and excludes all industries outside of manufacturing and Wu, Gaunt and Gray (2010), who argued that the cut-off points described by Altman (1968) are arbitrary.
A few years down the road, James Ohlson (1980) developed another widely used bankruptcy model that used a conditional logit approach instead of Altman’s (1968) MDA approach, which he claimed to eliminate the problems of the MDA model. The model (Appendix A) is easy to interpret, since the result yields a probability between 0 and 1. In this case, 9 variables are used, and it includes four liquidity ratios, two leverage ratios and two profitability ratios. Although the model, with a 0.5 cut-off point, initially predicted 95.15% of bankruptcies, further empirical work reduced the accuracy levels to 87.6% for bankrupt firms and 82.6% for non-bankrupt firms (Ohlson 1980). A major critic to the model arose from Hensher and Jones (2007), who said that all the variables are fixed, and the error term is standard logistically distributed.
The Zmijewski (1984) score is usually the model of choice by accounting researchers (Grice and Dugan 2003), which is not surprising given its 95% out of sample accuracy for the estimation sample (Zmijewski 1984). Similar to Ohlson (1980), the model’s probit function (Appendix A) allows to come up with a bankruptcy probability between 0 and 1 and separates firms between bankrupt (>0.5) and non-bankrupt (<0.5). Although the model yielded strong results, Shumway (2001) argued that Zmijewski’s (1984) model does not have a strong bankruptcy predictive power. This is due to the fact that the variables “Total Liabilities/Total Assets” and “Net Income/Total Assets” have a strong 0.40 correlation, thus reducing the number of variables to one.
3. Case Study
This section starts out by examining some of the leading companies and key trends in the metals and mining industry from 2002 to 2017, and covers the different stages of the cycle, including the boom from 2002 to 2014, the commodity price crash of 2015, and the recovery of the industry from 2015 to 2017. The initial brief overview presented sets the base for understanding the main part of the section, which is Anglo’s financial distress situation at the end of the last commodity super-cycle and the different measures the management team had to take to get the
firm back to a healthy financial position. Thus, to end the section, a deep analysis on the operational and financial restructuring plan is presented, along with key financial ratios and other pointers that demonstrate both the lead-up to the troubled state Anglo found itself in and the following successful plan that was carried by its executives.
It is important to say that all the information below is taken from Anglo’s financial reports, investor presentations, conference reports and other official company reports that can be found on the firm’s website, as well as yearly mine reports from PwC and Thomson Reuters Eikon.
3.1 Overview of Anglo American
Anglo American PLC is a globally diversified mining company founded in South Africa in 1917. Its headquarters is located in London, UK and the company is listed in the FTSE 100 index as well as the Johannesburg Stock Exchange. Anglo specializes in exploring, mining and processing of precious metals and minerals (diamonds and platinum), base metals (copper and nickel), and bulk commodities (iron ore, manganese ore, and thermal and metallurgical coal), and operates in Southern Africa, North and South America, Australia, Europe, and Asia.
Table 1. Anglo American Total Revenues and EBITDA
Anglo American Total Revenue, EBITDA and EBITDA Margin (%) figures by mineral/metal in USD Billion from FY09 to FY17. Data retrieved from Anglo-American investor presentations.
FY09 FY10 FY11 FY12 FY13 FY14 FY15 FY16 FY17
Coal 4.7 19.2% 6.2 19.0% 8.1 22.1% 7.3 22.4% 6.4 19.4% 5.8 18.7% 4.9 21.2% 5.3 22.7% 7.2 25.2%
Iron Ore &
Manganese 13.9% 3.4 6.6 20.1% 7.6 20.9% 6.4 19.5% 6.5 19.7% 5.2 16.7% 3.4 14.7% 3.4 14.8% 5.8 20.5% Diamonds 1.7 7.0% 2.6 8.0% 3.3 9.1% 4.0 12.3% 6.4 19.4% 7.1 23.0% 4.7 20.3% 6.1 26.2% 5.8 20.4% Platinum 4.5 18.4% 6.6 20.0% 7.4 20.1% 5.5 16.7% 5.7 17.2% 5.4 17.4% 4.9 21.3% 4.4 19.0% 5.1 17.7% Copper 16.1% 4.0 14.8% 4.9 14.1% 5.1 15.6% 5.1 16.3% 5.4 15.6% 4.8 15.4% 3.5 13.2% 3.1 14.8% 4.2 Nickel 0.3 1.4% 0.4 1.3% 0.5 1.3% 0.3 1.0% 0.1 0.4% 0.1 0.5% 0.1 0.6% 0.4 1.8% 0.5 1.6% Corporate - - - 1.9 6.0% 0.9 4.0% 0.5 2.2%
-Niobium & Phosphates - - -0.8 2.3% 0.7 2.2% 0.7 2.1% 0.5 2.4% - -Other Mining 5.9 24.0% 5.5 16.8% 4.5 12.4% 3.3 10.1% 1.8 5.4% - - - -Total Revenue 24.6 33.0 36.5 32.8 33.1 31.0 23.0 23.1 28.7 EBITDA Margin % 6.9 28.1% 12.0 36.4% 13.3 36.5% 8.9 24.0% 9.5 26.6% 7.8 22.9% 4.9 19.2% 6.1 23.6% 8.8 26.6%
Despite the slump in revenues from FY12 to FY15 in bulk commodities due to the slowdown of Emerging economies, it is undeniable that demand for iron ore and manganese have gained traction across the years. These commodities, as seen in Table 1, have been the biggest source of revenues for Anglo since 2009, and have had combined growth of 12.6% in total revenue share until 2017. The highest revenue growth for the division was realized from FY09 to FY11, when revenues more than doubled ($3.4bn to $7.6bn). This explosive growth was driven by a long-lasting demand shock in BRICS economies, but especially in China and India, where their fast industrialization and urbanization plans needed high amounts of steel and other alloys, products that are directly derived from iron ore and manganese.
On the precious metals side, revenues in diamonds more than doubled to $7.1bn in FY14, and the segment has now become the third largest revenue source of Anglo, generating $5.8bn (20.4%) of total revenue in FY17. Improvement in the US economy, which accounts for approximately 45% of the global demand, and the growing middle class in China, which has now more disposable income than ever, were key to the development of the segment’s revenues. While the outlook for diamonds remains positive, platinum does not seem to follow the same track. Although the commodity has remained relatively stable as a revenue source for Anglo across time, challenges that arose in FY15 due to lower sales of stock from South Africa, Russia, and China have had a negative impact in prices, which are expected to continue and thus suggest lower future revenue generation from the commodity.
Total revenue realized from base metals also remained relatively stable over time, and the increases in revenue were less steep than those of bulk commodities and precious metals. However, this pattern is expected to turnaround due to the recent push for renewable energies globally, and especially in China, where the government is concerned about pollution levels, the health of its citizens, and the cleanliness of its environment. As other emerging and developed economies
follow the same “green” route as China and step up their environmentally friendly plans, base metals are expected to steadily grow in the short to medium term.
It is important to note that “other mining” activities, Niobium, and Phosphates exploration were ceased due to the strategy change and company restructuring implemented by Anglo’s CEO, Mark Cutifani, after the commodity price-crash in 2015. The decline of commodity prices were steady from the end of FY11 to FY15, as illustrated by the MSCI Index price (Graph 2) and the clear market capitalization loss of metals and mining companies. Anglo was one of the companies most affected in the mentioned period, which is proven by decreasing EBITDA margins (-17.3%) and extreme negative EBITDA growth (-63.1%). However, the efforts of the executives to save the company and the well thought-out restructuring plan they implemented turned out to be successful, as suggested by the increasing revenues and EBITDA in the years following the event.
Graph 1. Anglo American EBITDA by Commodity
Total EBITDA (in USD billion) and % of Total EBITDA by mineral/metal in important periods of the commodity super-cycle, namely FY09, FY11, FY15 and FY17. Data retrieved from Anglo-American investor presentations. FY09 FY11 FY15 FY17 Other 0.5 4.0% Coal 3.0 22.3% Iron Ore/Manganese 4.6 34.2% Copper 2.8 20.5% Diamonds 0.8 5.9% Platinum 1.7 12.5% Nickel 0.1 0.6% Other 0.9 12.2% Coal 1.6 21.9%
Iron Ore and Manganese 1.6 22.0% Copper 2.3 31.2% Diamonds 0.2 3.0% Platinum 0.7 9.4% Nickel 0.0 0.4%
Graph 1 shows the evolution of Anglo’s EBITDA by commodity produced during key years for the metals and mining industry. The period from FY09 to FY11 captures the quick expansion of the industry, while FY15 clearly represents the end of the commodity super-cycle and the massive drop in EBITDA in all categories. Finally, improvements from the restructuring plan implemented in FY15 can be noticed in FY17.
From FY09 to FY11, overall EBITDA almost doubled, increasing from $6.9bn to $13.3bn. Major contributions came from the iron ore and manganese division, which almost tripled with a $3.0bn increase in EBITDA in the mentioned period, and made up 34.2% of the group’s in EBITDA in FY11, an increase of 12.2% since FY09. Other commodities such as diamonds and platinum also had significant increases in EBITDA, but they were not as significant as the iron ore and manganese division.
With the exception of diamonds, FY15 was a rough year across the board due to the end of the commodity super-cycle, and EBITDA dropped from $7.8bn to $4.9bn from FY14 to FY15, with EBITDA Margins also dropping over 3% in the same year. While copper and coal suffered from negative price shocks, iron ore took the worst hit. With prices going from $170/t levels in 2011 to $47/t at the end of FY15, EBITDA of Anglo’s Diamond division decreased from $4.6bn in FY11 to $1.0bn in FY15. However, since FY15, Anglo has implemented various cost saving strategies and disposed costly assets, hence almost doubling EBITDA in two years. Iron ore and manganese remain as strong EBITDA generators for Anglo, but coal has taken the lead as both the biggest generator of revenues and EBITDA.
Niobium/Phosphates 0.1 3.0% Coal 1.0 21.5% Iron Ore/Manganese 1.0 21.1% Copper 0.9 19.4% Diamonds 1.0 20.4% Platinum 0.7 14.6% Coal 2.9 32.5% Iron Ore/Manganese 2.4 26.7% Copper 1.5 17.1% Diamonds 1.4 16.3% Platinum 0.9 9.8% Nickel 0.1 0.9%
Table 2. Anglo American Total Revenues by Geography
Anglo American Total Revenue figures by geography in USD Billion from FY09 to FY17. Figures in parenthesis represent the total revenue percentage (%) share of each region for the mentioned period. Data retrieved from Anglo-American investor reports.
FY09 FY10 FY11 FY12 FY13 FY14 FY15 FY16 FY17
Asia 9.3 37.6% 14.1 42.9% 17.2 47.1% 16.1 49.2% 16.0 48.4% 15.3 49.3% 12.6 54.8% 13.5 58.3% 18.2 63.6% Europe 8.9 36.0% 9.4 28.7% 9.7 26.6% 8.8 27.0% 9.3 28.1% 8.1 26.2% 5.3 23.1% 4.5 19.5% 5.1 17.7% Africa 2.7 11.0% 3.8 11.6% 4.2 11.5% 3.8 11.7% 3.7 11.1% 4.1 13.3% 2.7 11.9% 3.2 14.0% 3.6 12.5% South America 2.1 8.4% 3.3 10.0% 3.3 8.9% 2.4 7.3% 2.7 8.3% 2.0 6.4% 1.3 5.5% 1.2 5.1% 0.9 3.0% North America 1.3 5.3% 1.8 5.5% 1.9 5.1% 1.3 3.9% 1.1 3.3% 1.2 3.9% 0.9 3.7% 0.6 2.5% 0.9 3.1% Australia 0.4 1.7% 0.5 1.4% 0.3 0.9% 0.3 1.0% 0.3 0.8% 0.3 0.9% 0.2 0.9% 0.2 0.7% 0.0 0.1% Total Revenue 24.6 33.0 36.5 32.8 33.1 31.0 23.0 23.1 28.7 While on average over 75% of the revenues are originated from the extraction of minerals in South Africa, Australia and South America, the distribution of revenues across geographies is more dispersed. As seen in table 2, Anglo has shifted its focus towards Asian customers since 2009, reflected by the increase of revenue share in the region (63.9% of total revenues in FY17) and the decrease of revenue share in the European (18.3% total revenue decrease from FY09 to FY17), South American, North American and Australian regions, with this last one almost being non-existent as of the end of 2017. This pattern is in line with the demand increase for metals and minerals experienced in Asia and the findings from Radetzki (2006), as the total revenue share of the area increased by 9.5% from FY09 to FY11. Moreover, the trend is expected to continue as Emerging economies finalize their industrialization plans and demand for base metals increases due to the push for renewable energies.
3.2 The Industry
The metals and mining industry had extraordinary growth from the beginning of 2002 until the end of 2011, driven by fast expansion of BRICS economies, but especially by China and India’s
booming demand for consumer goods and manufacturing products. Moreover, and contrary to developed countries that focused on maintenance projects, the Chinese government invested into an enormous urbanization plan and new industrial projects such as a 30,000km new railway line that required high amounts of construction resources (Kabwe and Yiming 2015). Due to this, China accounted for almost the entirety of the increase in demand for copper and more than half the increase for aluminum, nickel and steel from 2000 to 2007 (Farooki 2009), and by 2010, it captured 62% of the metallurgical coal, 54% of the iron ore, 41% of the steel and 38% of the copper global consumption.
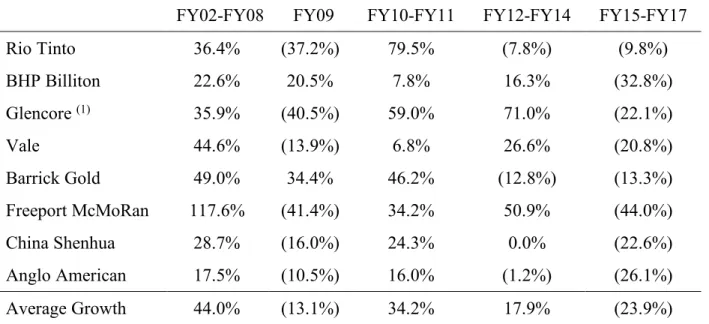
Table 3. Industry Capital Expenditure Figures
Average capex percentage growth of metal and mining companies from FY02 to FY17, fragmented into the main 5 sub-periods that capture the growth and decline of the mining industry. Data retrieved from PwC metals and mining reports and Anglo-American investor presentations.
FY02-FY08 FY09 FY10-FY11 FY12-FY14 FY15-FY17
Rio Tinto 36.4% (37.2%) 79.5% (7.8%) (9.8%) BHP Billiton 22.6% 20.5% 7.8% 16.3% (32.8%) Glencore (1) 35.9% (40.5%) 59.0% 71.0% (22.1%) Vale 44.6% (13.9%) 6.8% 26.6% (20.8%) Barrick Gold 49.0% 34.4% 46.2% (12.8%) (13.3%) Freeport McMoRan 117.6% (41.4%) 34.2% 50.9% (44.0%) China Shenhua 28.7% (16.0%) 24.3% 0.0% (22.6%) Anglo American 17.5% (10.5%) 16.0% (1.2%) (26.1%) Average Growth 44.0% (13.1%) 34.2% 17.9% (23.9%)
Given the positive outlook of the sector, leading mining companies started using the cash sitting on their balance sheets to invest in new projects and acquire more mines in order to cope with the booming demand and the insufficient global supply of metals and minerals. To put it in perspective, the top companies in the world, listed on table 3, increased capex by 44.0% on average each year from 2002 to 2008. Which is more, Rio Tinto, Vale and Barrick Gold spent 503.8%, 491.3% and 667.1%, respectively, more in capital in 2008 than in 2002.
The global economic recession of 2008 that followed the years of growth had a noticeable negative effect in the sector, with the exception of gold miners, who beneficiated from the safe
haven status of gold in periods of distress and took advantage of the increased demand for the resource to boost their profits at the time. Setting this fact aside, the industry saw an overall reduction in capex, shown by the 13.1% decrease in capex in the companies analyzed, and sharp drops in market capitalization across the industry, shown by the MSCI Metals and Mining Index prices in 2009 (Graph II).
Graph 2. Dow Jones, FTSE 100 and MSCI Index Fluctuations
Variation in Dow Jones Industrial, FTSE 100 and MSCI Index prices from January 1st, 2002 to December 31st, 2017.
The period chosen encompasses the entire commodity super-cycle, thus showing the behavior of the indexes and allowing to see the situation of the industry during the period. Data retrieved from Thomson Reuters Eikon.
While developed economies were slowly coming out of the 2008 turmoil in the years following the event, the metals and mining industry kept the fast paced growth that started in 2002 due to the enormous GDP growth of China (9.7% in 2008 and 9.4% in 2009) and India (2.9% in 2008 and 8.5% in 2009), as well as the internationalization and deregulation of their economies (The World Bank 2009). In fact, the MSCI outperformed the Dow Jones Industrial and the FTSE 100 indexes from 2009 until 2011, when the industry started seeing the first effects of the cooldown which led to the end of the commodity super-cycle in 2015.
With revenues across the sector picking the pace back up after the slump, companies continued building empires and increasing the size of their balance sheets again until 2011, when the industry had another performance peak and saw commodity prices not far below 2008 price
1 00 .0 2 00 .0 3 00 .0 4 00 .0 5 00 .0 6 00 .0 7 00 .0 8 00 .0 5 ,00 0. 0 1 0,0 00 .0 1 5,0 00 .0 2 0,0 00 .0 2 5,0 00 .0
Dow Jones Industrial MSCI INDEX
2 ,00 0. 0 3 ,00 0. 0 4 ,00 0. 0 5 ,00 0. 0 6 ,00 0. 0 7 ,00 0. 0 8 ,00 0. 0 9 ,00 0. 0 1 0,0 00 .0 1/1/02 1/1/03 1/1/04 1/1/05 1/1/06 1/1/07 1/1/08 1/1/09 1/1/10 1/1/11 1/1/12 1/1/13 1/1/14 1/1/15 1/1/16 1/1/17 FTSE 100 Index
levels. Research from PwC shows that the top 40 mining companies combined increased their capex by 48% from FY10 to FY11, bringing total assets to a historical high of $1.1 trillion and representing an overall increase of 500% in total assets since 2002, and demonstrating the empire building approach taken by metals and mining companies from the start of 2002 to 2011.
The industry started showing signs of trouble after the peak in mid-2011 as many purchased assets that were in the third and fourth quartile of the cost curve started becoming loss-making due to the plummeting commodity prices and the costly extraction of resources. Available mines became increasingly difficult to reach and lacked proper infrastructure to extract resources, and miners had to spend their time setting up the mines with infrastructure to support exploration instead of focusing on the actual production of resources. Given the situation, developing productive mines became expensive and time consuming, and the industry was unable to supply resources to the market in a timely manner. The bad trend continued in 2012, hit by decreasing commodity prices, increased production costs and record impairment charges (50% higher than any of the years in the last decade). These factors brought net profits and FCF down by 49% and 85%, respectively, from FY11 to FY12, as well as ROCE down to 8% for the top 40 mining companies, with the last two being the lowest since the start of the boom. The increased levels of impairments coincided with many changes in executive positions. From 2012 to 2013, half of the top 10 mining companies saw a change in CEO, with the aim of re-focusing on efficiency improvements, cost savings, and balance sheet optimization instead of costly acquisition of assets.
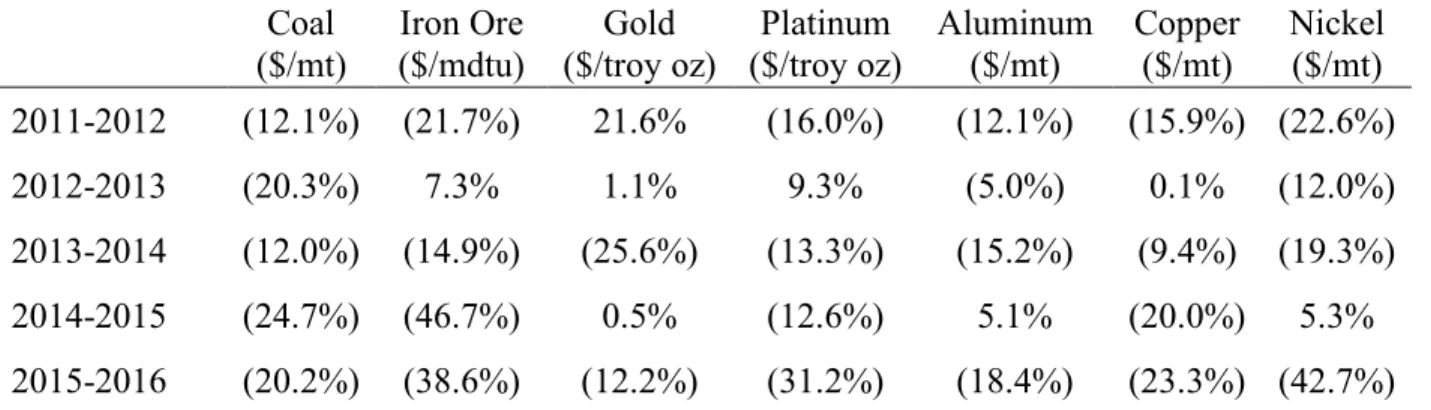
Table 4. Fluctuation in Major Commodity Prices
Change in coal, iron ore, gold, platinum, aluminum, copper, and nickel prices from FY11 to FY16, both year on year and between FY11 and FY16. The period chosen begins with the start of the cooldown and finishes with the end of the decline, thus showing the full devaluation of commodity prices during the period. Data retrieved from Thomson Reuters Eikon.
Coal ($/mt) Iron Ore ($/mdtu) Gold ($/troy oz) Platinum ($/troy oz) Aluminum ($/mt) Copper ($/mt) Nickel ($/mt) 2011-2012 (12.1%) (21.7%) 21.6% (16.0%) (12.1%) (15.9%) (22.6%) 2012-2013 (20.3%) 7.3% 1.1% 9.3% (5.0%) 0.1% (12.0%) 2013-2014 (12.0%) (14.9%) (25.6%) (13.3%) (15.2%) (9.4%) (19.3%) 2014-2015 (24.7%) (46.7%) 0.5% (12.6%) 5.1% (20.0%) 5.3% 2015-2016 (20.2%) (38.6%) (12.2%) (31.2%) (18.4%) (23.3%) (42.7%)
2011-2016 (63.0%) (76.6%) (19.3%) (52.1%) (39.3%) (53.2%) (66.8%) Unfortunately, this was only the beginning of the tough situation companies in the industry had to face until 2016. Prices continued falling with special strength in FY14 and FY16, and the gap between leading markets and mining markets continued expanding (Graph 2). As seen in Table 4, all commodities devalued between 2011 and 2016, and copper, iron ore and nickel were the most affected out of all commodities with value declines of 63%, 76.6% and 66.8%, respectively, in the time period. Thus, the industry experienced massive losses in market capitalization from 2012 to 2016, but especially starting in 2014 due to the high correlation and exposure of mining companies to commodity prices. Although some people thought that the bear market had touched rock-bottom in 2014, there was still more to come, and commodities kept devaluating at a fast pace.
Growth prospects for China, the demand driver of the mining industry in the past years, quickly deteriorated, volatility in the markets spiked, and imports fell due to the depreciation of the Yuan. Other emerging countries such as South Africa, South America, India and Brazil were also highly affected by the situation as consumer demand for commodities weakened and commodity prices declined. Local currencies sharply devalued and inflation was bolstered given the high dependency of these countries on exports of commodities such as copper, gold or oil. Thus, the market found itself in the extreme opposite situation than it did in 2002 when suppliers were incapable of keeping up with the booming demand. In this case, there was an oversupply of commodities as demand severely decreased and supply was high due to all the investments made by companies throughout the booming years.
On top of the worrying commodity market situation, even Australia and Canada, usually known for facilitating mining operations, started pushing for nationalistic policies and environment friendly operations, and placed barriers to the globalization of the industry. Hence, the mining environment was altered and uncertainty arose about future policies, which increased volatility and decreased consumer confidence in metal and mineral resources. In order to receive a bigger share of the revenue created from the mining industry to pay for fiscal debt, countries increased taxes and royalties, placed levies on exports and imports, and restricted non-domestic majority ownership of mines. Examples of challenges set by governments include increases in royalty rates on open-pit mining in Zambia from 6% to 20%, the prohibition to export unprocessed
mineral ore in Indonesia, the 49% non-domestic ownership cap placed in Mongolia, tax increases in China, or the harsh environmental legislation established by the Chilean government. All of these policies pushed away investment, hindered development of mines, pushed up production costs, and made it even more difficult to develop profitable operations. Thus, the political uncertainty created by the situation remained concerning when making investment decisions, and, coupled with the poor outlook of the industry, declining commodity prices, and increased nationalism, created a ticking-time bomb that did not take long to explode.
To top it all off, ratings agencies downgraded many companies, and the average rating for the top 40 firms dropped to Baa3 (Moody’s). The worst hit was taken by diversified commodities firms such as Anglo, who in conjunction with Vale received junk rating status due to liquidity issues and the dark outlook for iron ore and other bulk commodities. Therefore, loan covenants were breached in many cases, resulting in interest rate increases on their respective loans. Leverage ratios also spiked given the decreasing EBITDA figures and the inability to pay back debt due to negative earnings. From 2014 to 2015, the Net Debt to EBITDA ratio of the top 40 developed companies rose from 1.52 to 2.21 and 1.53 to 3.15 for emerging companies. Moreover, 12 companies in the top 40 had the ratio above 4, indicating the concerning situation of the industry and the survival mode entered by many firms. For example, leaders such as Freeport-McMoran and Glencore had 2.5x and 2x Net Debt to Market capitalization, respectively, illustrating serious trouble for both companies. To finalize, short-term borrowings increased as debt matured, and companies were unable to refinance their debt due to the increased interest rates.
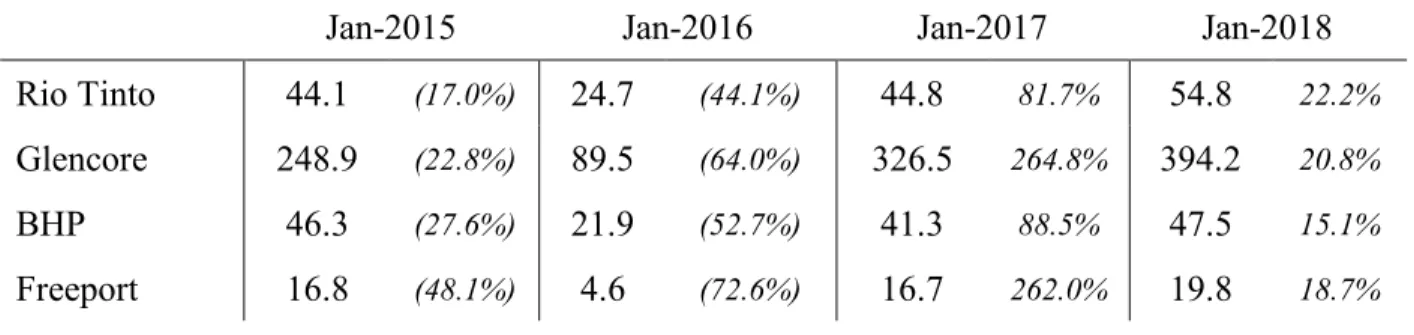
Table 5. Industry Leading Companies Stock Price Variations
Stock price of leading mining companies and percentage change in price YoY, from January 2014 to January 2018. The table presented is a clear representation of the devaluation of the companies stock prices in FY15 and FY16, as well as the following rebounce of their prices due to the restructuring plans implemented by the companies and the recovery of commodity prices. Data retrieved from Thomson Reuters Eikon.
Jan-2015 Jan-2016 Jan-2017 Jan-2018
Rio Tinto 44.1 (17.0%) 24.7 (44.1%) 44.8 81.7% 54.8 22.2%
Glencore 248.9 (22.8%) 89.5 (64.0%) 326.5 264.8% 394.2 20.8%
BHP 46.3 (27.6%) 21.9 (52.7%) 41.3 88.5% 47.5 15.1%
Anglo 11.1 (22.5%) 2.8 (75.1%) 13.6 389.5% 16.0 17.5%
Vale 7.0 (48.3%) 2.5 (65.1%) 10.2 315.5% 12.8 25.4%
Firm decision makers had to stop and re-think their strategies in order to stop financial distress or even bankruptcy. With the help of rising commodity prices, firms focused on cutting debt and reducing capex, exploration activities, and dividends to minimal levels. Payments of debt, increased cash flow from operations and assets sales, and refinancing of existing debt massively reduced leverage ratios, and the market reacted positively to these measures, as demonstrated in Table 5. While the decline in stock prices from January 2014 to January 2016 across the companies analyzed imply big loses in market capitalization, there was a clear recovery from January 2016 to January 2017, with Anglo recovering almost 400% or Vale recovering over 300% of their stock prices.
Clear examples of restructuring activities include: (i) Rio Tinto’s approximate $4bn sale of various assets and $3bn bond buyback between 2015 and 2016, (ii) Glencore’s $2.5bn rights issue in 2015 and $3.9bn disposal of assets and suspension of dividends in 2016, (iii) BHP Billiton’s refocus on core assets, reflected by spin-off of South 32 mine and Pinto Valley sale for $650m, (iv) Freeport’s $4bn sale of assets and $370m debt to equity swap in 2016, or (v) Anglo American’s plan, which is further explained in the upcoming section.
3.3 Anglo-American’s Master Plan
During an analyst presentation on December 9th, 2014, Anglo executives acknowledged
their concerns about the pressure commodity prices were imposing on the company, recognized expected further economic pressures, and declared that changes needed to be made in order to have the business prosper in the long term. As such, they committed to develop a strategy to not only push through the tough market conditions and deliver profits in the short-term but also to create long-term value for stakeholders of the company.
It was clear that the empire built by Anglo during the commodity super-cycle came back to the company in the form of trouble when commodity prices dropped, as exemplified by the $600 million negative FCF returned by 19 of the assets owned by the company in 2015. In order to solve the problem, the management team promised that these assets, along with a few others that were sitting on the higher end of the cost curve, would be closed, disposed, or placed on care and
maintenance, and defined a new category of assets to focus on: “Priority 1 Assets”. The criteria behind these “Priority 1 Assets” was to yield long-term growth and positive FCF through a low position in the cost-curve, a high position in the EBITDA margin curve, scalable resource size and endowment, and a low operating risk-profile.
A year after the commitment, Cutifani presented the specifics of the radical restructuring plan whose end goal was to reduce net debt below $10bn and recover a positive FCF position. In order to materialize the plan, an efficient and innovative operating model containing an optimal asset portfolio would be created, which would build a strong balance sheet that resembled the principles of an optimal capital structure and provided Anglo with a strong liquidity position. As such, it was essential for Anglo’s executives to focus on productive and efficient assets, cost-cutting and volume improvement practices, capex reduction and deleveraging of the balance sheet. The major actions announced by Anglo were to get rid of $3 to $4bn in assets and to focus on the De Beers, Platinum and Copper divisions, as their higher quality characteristics yielded a 30% higher EBITDA margin than the non-core assets and returned positive cash flow that would be used towards debt repayment.
On the operational side, Anglo planned to close offices and merge them into strategic regional offices to maximize space and headcount, with the end goal of reducing the latter from 128,000 to 50,000, of which 68,000 would come from asset disposals and 10,000 from internal restructuring. The drastic cut in headcount was possible due to the fact that many of the existing resources were enough to support most of the already existing operations, and some of the work carried was being duplicated or heavily overlapped. The identified operational inefficiencies supposed an opportunity to cut down $1.9bn in costs by delivering more efficient drilling practices, appropriate use of equipment and capex reduction, with this last one being expected to be reduced from $4bn in 2015 to $2.5bn in 2017.
3.3.1 Barriers to Execution
The market sentiment for the plan to come out as planned was low, and investors and analysts were concerned that the assets would not sell due to the tough industry outlook and the fact that many of the assets were located in South Africa, where political risk remained high. Moody’s and Fitch expressed their views on Anglo in February of 2016, as both rating agents
downgraded the company to junk status due to the uncertainty regarding further commodity price drops and the planned asset sales, which if unsuccessful, would have halted the balance sheet optimization and would have supposed big trouble for Anglo.
With approximately 33% of Anglo’s NAV coming from South Africa, smooth operations in the country were key to revenue generation if the assets did not sell, and the situation was far from calm. First of all, insufficient government investment into the national electricity grid and constant electricity outages disturbed existing operations, thus affecting revenues and reducing productivity and safety in mines. Second, which was an even bigger threat for Anglo, the country‘s political instability, labor strikes, corruption and policy uncertainty resulted in high interest rates, spiking inflation and a loss in consumer confidence. Although depreciation of the rand was positive for production purposes as it softened the impact of inflation, investor sentiment decreased, thus threatening Anglo’s asset spin-off plan and furthering analysts concerns about the materialization of Cutifani’s goals. To top it all off, free movement of the $641 million of cash generated in South Africa was limited due to an exchange control policy, and Anglo could only repatriate the accumulated cash by paying dividends through the English Corporate office. Thus, the best option was to sell some of its assets to South African investors, but the plan was threatened by the risky political panorama. Although it is well-known that the political environment in the country is anything but peaceful and ethical, Anglo poorly mitigated political risk in the area by, for example, not transferring operations to safer countries, and only announced a NAV reduction in the country to approximately 8% when trouble arose in 2015.
Liquidity and refinancing risk was a major concern if the asset disposal plan did not materialize. By the end of 2015, the company reported negative FCF of $982 million, and operating cash flow was down from $6.1bn to $4.0bn YoY. Capex had to be cut down by $1.9bn and the $1.1bn dividend plan was suspended. Thus, the only factor that saved the company from bleeding further in 2015 was the net proceeds received from the sale of Anglo-American Norte ($0.2bn) and the 50% ownership sale of Lafarge Tarmac ($1.5bn).
Under positive circumstances, Anglo had a stable liquidity position, with a total of $14.8bn split between $7.9bn in cash and $7bn in undrawn facilities. Moreover, the package included a $5bn RCF with no financial covenants maturing in April 2020, a $0.4bn bilateral facility and a $1.5bn club facility. Given that the existing bonds had no coupon step ups either, Anglo was not affected by interest rate increases when the credit downgrade happened in 2016. However, the
company had $19.8bn of gross debt and $10.4bn of it was due by the end of 2019. With the mining industry immersed in a major dip and Anglo returning two consecutive years of high negative FCF (-$1.20bn in 2014 and -$0.98bn in 2015), industry professionals predicted a tight balance sheet outlook if the situation continued, as all the cash could have potentially been quickly burnt in two to three years.
3.3.2 Debt and Operational Restructuring
The sale of assets in 2015 initiated an asset disposal spree, with major sales including the Niobium and Phosphates ($1.7bn) and Rustenburg ($0.1bn) in 2016, and the portfolio was quickly downsized to 37 assets by the end of 2017, a 45.6% reduction from 2013. The operation left Anglo with a world-class diversified portfolio containing high-quality assets, which benefited from strong partnerships with governments, low productions costs, long-term life span, and efficient resource production.
Net proceeds received from the disposals ($1.8bn) allowed Anglo to initiate the balance sheet restructuring and early redeem $1.8bn of bonds in March 2016. Given the better outlook of the asset disposal plan, the recovering commodity prices and the decrease in debt, Moody’s upgraded Anglo’s rating to Ba3 positive in May 2016, and awaited further improvements to place the company back into the investment grade group. Further disposals, operational improvements, and recovery of commodity prices throughout the year reduced risk to investors, and in September 2016, Anglo recovered a credit rating notch (Ba2). By the end of the year, a healthier outlook for the company was obvious, as the generation of $2.6bn in free cash flow, a $1.4bn increase in operating CF and reduced capex and working capital allowed Anglo to cut down debt by $5.3bn.
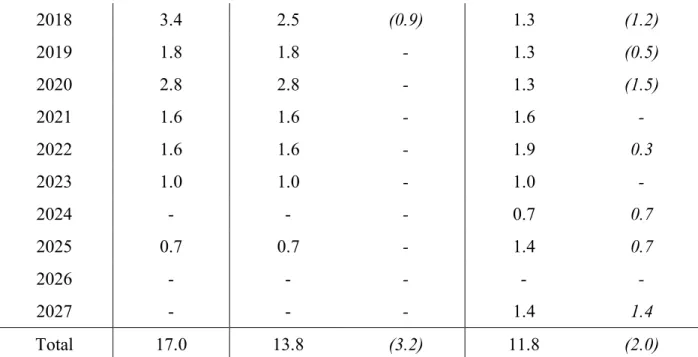
Table 6. Anglo American Total Corporate Bonds Outstanding Amount
Table 6 shows corporate bonds outstanding in FY15, FY16 and FY17 and change in the outstanding amount
YoY, in USD billions. The table demonstrates the successful balance sheet restructuring implemented by Cutifani and the improvement of the company’s debt position from FY15 to FY17. Data retrieved from Anglo-American investor reports.
Year/Mat 2015 2016 YoY Change 2017 YoY Change
2016 1.6 - (1.6) - -
2018 3.4 2.5 (0.9) 1.3 (1.2) 2019 1.8 1.8 - 1.3 (0.5) 2020 2.8 2.8 - 1.3 (1.5) 2021 1.6 1.6 - 1.6 - 2022 1.6 1.6 - 1.9 0.3 2023 1.0 1.0 - 1.0 - 2024 - - - 0.7 0.7 2025 0.7 0.7 - 1.4 0.7 2026 - - - - - 2027 - - - 1.4 1.4 Total 17.0 13.8 (3.2) 11.8 (2.0)
The 26.8% ($19.8bn to $14.5bn) reduction in debt from FY15 to FY16 resulted from $1.6bn in bond buyback transactions, the repayment of the 2016 $1.6bn bond, the $1.7bn payment completion of the Brazilian BNDES loans, and other $0.4bn loan payments. As seen in Table 6, in FY16, Anglo bought back $0.7bn of bonds maturing in 2017 and $0.9bn maturing in 2018. In combination with the full repayment of the 2016 loans ($1.6bn split between a $1.1bn Eurobond and a $0.5bn US bond), bonds outstanding decreased from $17.1bn to $13.8bn, which supposed a 19.2% that gave the company room to breathe and temporarily got it out trouble.
Although Anglo did not accomplish the goal of disposing more assets in 2017, the $4.9bn of FCF generated and an increase of $3.6bn ($8.0bn) in CF from operations were more than enough to further improve the liquidity position of the company. The recovery in top-line revenue figures and the positive impact of operational and financial changes in FY16 allowed the company not only to pay back the $1.9bn bond due in 2017 but also to ramp up debt refinancing even further and repurchase $3.2bn worth of short-term bonds - $1.2bn due in 2018, $0.5bn due in 2019, and $1.5bn due in 2020.
Table 7. Anglo American Weighted Average Maturity and Cost of Bonds Outstanding
Corporate bonds outstanding by currency, weighted average maturity and cost of the bonds before tax in FY15, FY16 and FY17 (in USD billions). Further information on individual outstanding amounts, currencies, and maturity dates are provided in Appendix 3. Data retrieved from Anglo-American investor reports.
FY15 FY16 YoY Change FY17 YoY Change Euro 10.6 8.2 (2.4) 5.7 (2.5) WAM 3.7 3.3 (0.3) 4.8 1.4 WABC 3.0% 2.8% (0.2%) 3.0% 0.2% US 5.7 4.9 (0.8) 5.4 0.5 WAM 4.3 3.7 (0.6) 6.6 2.9 WABC 4.3% 4.6% (0.2%) 5.4% 0.8% AUD 0.5 0.5 - 0.5 - WAM 2.8 1.9 (0.9) 0.9 (0.9) WABC 5.8% 5.8% - 5.8% - R 0.2 0.2 - 0.2 - WAM 3.3 2.6 (0.7) 3.1 0.6 WABC 9.0% 9.1% 0.1% 9.2% 0.1% Total 17.0 13.8 (3.2) 11.8 2.0 WAM 3.8 3.4 (0.4) 5.5 2.1 WABC 3.7% 3.1% (0.6%) 4.1% 1.0%
Under a detailed breakdown of the bonds outstanding by currency in the three years represented in Table 7, it is easy to see the restructuring process that increased the WAM of bonds, changed its WABC, and eliminated liquidity issues that were concerning investors.
The commodity price pressures and the declining revenue figures placed priority on cutting down debt. As such, Anglo did not issue any new debt and just focused on repaying loans and early redeeming bonds. Although the total WAM of bonds decreased by 0.4 years (3.8 to 3.4 years), it was an improved position since the WAM would have decreased by 1 year to 2.8 years if no bonds had been bought back. The total WABC also decreased by 0.6%, mainly due to the fact that the $1.1bn Euro Bond paid in 2016 had a 4.4% coupon and $0.3bn of a 6.9% coupon bond was bought back.
After improving the overall liquidity and WAM position of the company and reducing debt substantially in FY16, Anglo took further action to improve these metrics in FY17. Apart from repaying $3.2bn worth of short-term bonds, $3.0bn of long-term bonds were issued in total – four
US bonds with maturities in 2022 ($0.3bn), 2024 ($0.6bn), 2027 (2 bonds totaling $1.4bn) and a Eurobond with maturity in 2025 ($0.7bn). By the end of FY17, the total Eurobond outstanding amount outstanding decreased by $4.9bn from FY15, with increased WAM of 1.1 years and stable WABC. For US bonds, there was a net decrease of $0.3bn in the mentioned years, with the difference that WAM was increased significantly by 2.3 years to 6.6 years, and WABC increased by 1.1%, which is expected due to investors requiring higher returns for investing in bonds with longer maturities. Overall, the initiative taken had an excellent result for Anglo, as the total WAM of bonds increased by 2.1 years to 5.5 years, and the new bond structure was positively regarded by ratings agencies. In fact, Moody’s upgraded the company to Ba1 in March 2017, with a further upgrade to Baa3 (investment grade) in September 2017.
Table 8. Company Debt Ratios
Debt Ratios of Anglo-American from FY14 to FY17. Further detail of the formulas is provided in Appendix 2. Data retrieved from Anglo-American investor reports.
(In USDbn) FY14 FY15 FY16 FY17
Gearing 28.6% 74.7% 25.9% 13.5%
Debt / (Debt + Equity) 56.2% 74.2% 57.6% 52.8%
Equity / (Debt + Equity) 43.8% 25.8% 42.4% 47.2%
Total Debt / EBITDA 2.8x 4.5x 2.7x 1.6x
Net Debt / EBITDA 1.8x 2.9x 1.6x 0.6x
FCF / Total Debt (%) (6.1%) (5.0%) 17.9% 39.9%
EBIT Interest Coverage Ratio 0.2x (7.6x) 5.9x 7.7x
As a result of the loan repayment and bond buyback program, debt ratios that were concerning building up to FY15 had a quick turnaround in the following two years. The financial ratios presented in Table 8 justified the credit downgrade received in February 2016, as all the ratios from indicated junk status grading in FY15.
As seen in Table 8 Anglo’s 74.2% of the balance sheet was composed by debt in FY15, and its highly levered position yielded a gearing ratio of 74.7% and a Total Debt to EBITDA ratio of 4.5x. FCF to Total Debt was negative due to the negative FCF yielded in FY14 and FY15, and the EBIT interest coverage ratio was also negative due to the negative $4.4bn EBIT in the year. The debt repayment plan was successful, and debt ratios were quickly brought down to FY14
levels in FY16. A healthy financial position was reached in FY17, as indicated by a Total Debt to EBITDA ratio of 1.6x, a gearing ratio of 13.5%, and a FCF to Total debt ratio of 39.9%.
Table 9. Accounting Based Credit Scoring Model Results
Probability of default (PD) scores of Anglo-American from FY11 to FY17 from Altman Z (1964), Ohlson (1980) and Zmijewski (1984) Accounting based models. The results displayed in Table 9 were attained by using the formulas shown in Appendix 1. Data retrieved from Anglo-American investor reports.
Scores FY11 FY12 FY13 FY14 FY15 FY16 FY17
Altman Z 2.82 1.82 1.90 1.72 1.17 1.99 2.48
O-Score 6.2% 21.4% 10.2% 31.6% 46.4% 17.4% 11.3%
Zmijewski 7.4% 14.7% 16.0% 21.2% 38.4% 17.5% 12.8%
Average 6.8% 18.1% 13.1% 26.4% 42.4% 17.4% 12.1%
Table 9 is a clear representation of the deteriorating credit scores from FY11 to FY15, and the recovery of them from then until FY17. While the Altman Z-score was high in FY11 and placed Anglo near the “safe-zone”, the figure quickly declined and remained in the lower end “grey-zone” of the model until FY14. A $6.6bn decline in both retained earnings and revenue, negative -$4.4bn EBIT and a loss of $18.3bn in market capitalization drove the score to 1.17, indicating a high chance of default within the coming year. Both the O-score and the Z-score tell a similar story, as the chances of default consistently increased (except FY13’s O-score) until FY15. By the end of FY15, the average default probability of the Z-score and the O-score was 42.4% within one year, which placed Anglo close to the 50% cut-off point that predicted most bankruptcies. The reason behind the high chances of default at the time rely on the heavy weight put by the models on net-income and total liabilities, which, respectively, sharply dropped and remained stable.
A similar effect in the opposite direction was seen in FY16 and FY17 as Cutifani’s plan started yielding results. The increase in net income and the newly activated debt repayment program massively reduced the probability of default, which was mainly driven by the reduction of total liabilities. In fact, the Altman Z-score recovered back to near safe-zone levels, standing at 2.48, and the Zmijewski and O-scores had bankruptcy prediction rates below FY12 levels. It is important to note that, although the ratios provide a good proxy to assess the creditworthiness of Anglo, they are not specific to the mining industry, hence allowing the case to be further studied with ratios tailored to the industry.
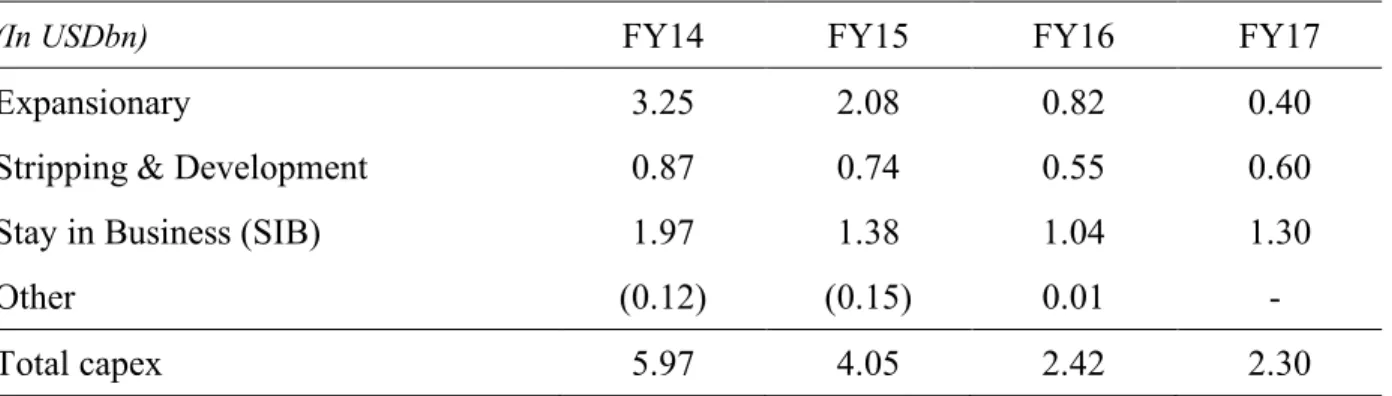
Table 10. Company Capital Expenditures
Anglo-American’s capital expenditures category breakdown from FY14 to FY17, which proves the cut capex expenses promised by the management team in 2015. Data retrieved from Anglo-American investor reports.
(In USDbn) FY14 FY15 FY16 FY17
Expansionary 3.25 2.08 0.82 0.40
Stripping & Development 0.87 0.74 0.55 0.60
Stay in Business (SIB) 1.97 1.38 1.04 1.30
Other (0.12) (0.15) 0.01 -
Total capex 5.97 4.05 2.42 2.30
A reduction in capex started in FY14, and even though Anglo had not detailed the restructuring plan yet, executives did announce and compromised to deliver a plan where high-margin generating assets were a priority to the business. In order to do so, no more unnecessary expenditures would be made, and as the plan became effective and targets were set, expansionary capex in FY16 was further reduced by $1.64bn to $1.26bn. Stripping & development and SIB capex were also reduced by $0.19bn and $0.24bn, respectively, as the disposal of assets reduced the required amount of capital to continue operations. Anglo continued reducing its capex in FY17 to focus on reducing the debt load of its balance sheet, but especially its expansionary capex. This last one declined by over 50% to $0.4bn, and, consistent with the plan, SIB increased by $0.26bn in order to develop and increase efficiency in the existing operations.
Table 11. Working Capital Schedule
Anglo-American working Capital schedule from FY14 to FY17. Data retrieved from Anglo-American investor reports.
(In USDbn) FY14 FY15 FY16 FY17
Raw Materials and consumables 1.09 0.95 0.88 0.82
Work in Progress 1.45 1.08 1.22 1.70
Finished Products 2.19 2.02 1.63 1.92
Total Inventories 4.72 4.05 3.73 4.44
Tax Receivables 0.64 0.51 0.61 0.76 Prepayments and Accrued Income 0.22 0.13 0.19 0.22
Other Receivables 0.49 0.40 0.52 0.54
Total Accounts Receivable 3.31 2.52 3.04 3.07
Trade Payables (1.93) (1.61) (1.70) (2.21)
Accruals (0.98) (0.74) (0.82) (1.37)
Deferred Income (0.06) (0.05) (0.17) (0.45)
Tax and Social Security (0.10) (0.07) (0.05) (0.07)
Other Payables (0.48) (0.31) (0.77) (0.49)
Total Accounts Payable (3.54) (2.78) (3.50) (4.59)
Total Working Capital 4.49 3.79 3.27 2.92
Although the working capital position of the company already improved from FY14 to FY15, further action was taken to improve the position until FY17 and help boost the free cash flow of the company. The reduction in working capital from $4.49bn in 2014 to $2.92bn was primarily driven by an increase of $1.05bn in accounts payable, indicating better negotiating terms with suppliers, and thus increasing the free cash flow inflow position of the company. Moreover, the cash outflow items were reduced as the inventory build-up from FY14 was effectively managed and was therefore reduced by $0.28bn from FY14 to FY17. To finalize, accounts receivable also decreased by $0.24bn in the mentioned years. Thus, the improved working capital position and the $3.67bn reduction in capex along with the implemented operational changes and recovering commodity prices were key to recover positive free cash flow figures and re-shape the financial position of the company.
4. Conclusion
Anglo’s case is a representation of the effects of the last commodity super-cycle on the mining industry and the importance of commodity prices on the industry’s companies top-line revenues and overall financial health. The study also validates previous literature by supporting research on the dangers of empire building, political risk, the positive correlation between
investment in negative NPV projects and increasing levels of debt and the excessive risk taken by managers during times of economic expansion. Although the analysis of “Accounting Based Model” scores are left for further research due to the fact that the three models used are not specifically tailored for the mining industry, we can confidently say that financial red-flags are often overlooked and preventive action was not taken, as suggested by the excessive leverage a poor debt financial metrics of mining businesses previous to the industry collapse. Moreover, the study will help detect similar events and prevent firms from engaging in restructuring activities. However, if reached the point, Anglo’s operational and financial restructuring is an example that can be followed to execute a successful restructuring plan. Finally, the findings can expand beyond the metals and mining industry, thus being a valuable tool for the future.