Predictive models for bacterial growth in sea bass (Dicentrarchus labrax)
1
stored on ice
2 3
Conrado Carrascosaa*, Rafael Millána, Pedro Saavedrab, José Raduán Jaberc, Tania Montenegroa, 4
António Raposod, Esteban Péreza, Esther Sanjuána 5
6 a
Department of Animal Pathology, Animal Production, Bromatology and Food Technology, Faculty of 7
Veterinary, Universidad de Las Palmas de Gran Canaria, 35413 Arucas, Las Palmas. Spain. 8
b
Department of Mathematics, Mathematics Building, Campus Universitario de Tafira, 35018 Las 9
Palmas de Gran Canaria. Spain. 10
c
Department of Morphology, Faculty of Veterinary, Universidad de Las Palmas de Gran 11
Canaria, 35413 Arucas, Las Palmas. Spain. 12
d
Centro de Investigação Interdisciplinar Egas Moniz, CiiEM. Instituto Superior de Ciências da Saúde 13
Egas Moniz, ISCSEM. Quinta da Granja. Monte de Caparica. 2829-511 Caparica. Portugal 14
15
* Corresponding author: Conrado Carrascosa Iruzubieta 16
E-mail address: [email protected] 17 Phone: 0034928457434 18 Fax: 0034928451142 19 20 21 22 23 24 25 26 27 28 29 30 31 32 33 34 35 36 37 38
Abstract
40 41
The purpose of this paper was to estimate microbial growth through predictive
42
modelling as a key element in determining the quantitative microbiological
43
contamination of sea bass stored on ice and cultivated in different seasons of the
44
year. In the present study, two different statistical models were used to analyse
45
changes in microbial growth in whole, ungutted sea bass (Dicentrarchus labrax)
46
stored on ice. The total counts of aerobic mesophilic and psychrotrophic bacteria,
47
Pseudomonas sp., Aeromonas sp., Shewanella putrefaciens, Enterobacteriaceae,
48
sulphide-reducing Clostridium and Photobacterium phosphoreum were determined in
49
muscle, skin and gills over an 18-day period using traditional methods and evaluating
50
the seasonal effect. The results showed that specific spoilage bacteria (SSB) were
51
dominant in all tissues analysed but were mainly found in the gills. Predictive
52
modelling showed a seasonal effect among the fish analysed. The application of
53
these models can contribute to the improvement of food safety control by improving
54
knowledge of the microorganisms responsible for the spoilage and deterioration of
55
sea bass.
56 57
Keywords: Sea bass; Microbiology; Statistics; Microorganisms; Predictive modelling. 58
59
INTRODUCTION 60
61
Sea bass is a high-quality, delicate and expensive fish. This fish has white flesh, a
62
mild flavour and low fat content and has become very popular in the European
63
aquaculture market (Cakli et al., 2006b). The demand for high-quality fresh fish stored on 64
ice in the European market has increased in recent years, but strong competition among
subsequent lowering of market prices have required the differentiation and
67
characterisation of fish produced in aquaculture (Cakli et al., 2007).
68
The Spanish aquaculture market produced 42.675 tons in 2011, a 2.8% (1.213
69
tons) reduction from 2010 (APROMAR, 2012). The main fish species produced through
70
aquaculture is the sea bream (Sparus aurata), at 16.930 tons, 16.8% less than in 2010,
71
followed by the sea bass (Dicentrarchus labrax), at 14.367 tons, 15.0% more than in
72
2010. The Canary Islands are the third most productive sea bass and sea bream
73
producer in Spain, responsible for 24.2% and 19.2% of the total production of these
74
species, respectively, in 2011 (APROMAR, 2012), primarily due to the ideal local marine
75
conditions, including the temperature, salinity, nutrients, currents and the morphology
76
and nature of the sea beds (Pérez-Sánchez & Moreno-Batet, 1991). It is widely known
77
that the physicochemical parameters of the water column are related to bacterial
78
population growth and, as a result, to the microbial load of fish, but no previous study has
79
examined this relationship or determined the exact parameters (oxygen, conductivity and
80
temperature) that affect bacterial populations, nor have such relations been effectively
81
modelled (Iliopoulou-Georgudaki, et al., 2009).
82
The climate of the Canary Islands is subtropical due to the cold Canary
83
Current that crosses the islands from north to south. The water surface temperature
84
in these islands ranges from 18 ºC in the winter to 22-23 ºC in the summer, an
85
important factor to consider when studying the microbiology of farmed fish. However,
86
thus far, no studies have evaluated the effects of the manipulation, distribution and
87
storage on the microbiology of sea bass harvested in the Canary Islands. 88
Microbial contamination and growth can result in undesirable changes in
89
appearance, texture, flavour and odour that reduce food quality (Sperber & Doyle,
2009). Ice storage has been widely used to prolong shelf life, particularly during
91
transportation both for domestic consumption and export to neighbouring countries
92
(Kostaki et al., 2009). Preservation on ice is one of the most efficient ways of
93
retarding spoilage (Özyurt et al., 2009). The shelf life of sea bass stored on ice is 6–
94
8 days (Paleologos et al., 2004). Thus, limited shelf life, primarily due to microbial
95
spoilage, is a limiting factor for the distribution and sale of such perishable foods
96
(Kostaki et al., 2009). The growing production of this species of fish has increased
97
the importance of maintaining its quality during storage. Fish quality declines due to a
98
complex process involving physical, chemical and microbiological forms of
99
deterioration. Enzymatic and chemical reactions are normally responsible for the
100
initial loss of freshness, whereas microbial activity accounts for obvious spoilage and
101
thereby establishes the product’s shelf life (Guillén-Velasco et al., 2004; de Koning et
102
al., 2004). Many factors can influence the rate of the microbial spoilage of fish, such
103
as the bacterial flora present, storage conditions, handling and temperature (Ward &
104
Baj, 1988), and specific spoilage organisms grow faster than other sea bass
105
microflora (Limbo et al., 2009). Some bacterial groups are particularly associated
106
with this spoilage. Fish caught in cold marine waters and stored on ice under aerobic
107
conditions generally spoil because of contamination by Shewanella putrefaciens,
108
Pseudomonas sp. (Gram & Huss, 1996) and representatives of the family
109
Vibrionaceae (Huss et al., 1995) as well as Enterobacteriaceae, lactic acid bacteria
110
and yeasts (Koutsoumanis & Nychas, 2000). Marine fish from temperate waters
111
stored in a modified atmosphere are spoiled by CO2-resistant Photobacterium 112
phosphoreum, whereas Gram-positive bacteria are likely responsible for the spoilage
113
of fish from fresh or tropical waters packed in CO2 (Gram & Huss, 1996). 114
However, the determination of microbial growth and fish shelf life with
115
traditional microbiological challenge tests is expensive and time-consuming
116
(Bruckner et al., 2013). One alternative is the concept of predictive microbiology,
117
which uses mathematical models to predict microbial growth and, thus, to estimate
118
shelf life (McMeekin et al., 1993; Whiting, 1995). Predictive microbiology involves the
119
development of mathematical models to describe the effect of the most important
120
environmental factors on the biology of microorganisms in foods (Ross et al., 2000).
121
The majority of these models are based on experimental data derived from laboratory
122
media, and there is limited information available regarding the assessment of
123
individual species variability in foods (François et al., 2006; Manios et al., 2011). The
124
models have immediate practical application to improve microbial food safety and
125
quality and can also provide quantitative data regarding the microbial ecology of
126
foods (Ross et al., 2000). The implementation of these predictive models contributes
127
to the improved control of food safety and spoilage by quantifying the effect of
128
storage and distribution on microbial proliferation via the Hazard Analysis and Critical
129
Control Points (HACCP) system (Van Impe et al., 2013).
130
Therefore, the objective of this study was to develop predictive shelf life models
131
that were adequate for use in farmed sea bass harvested in each season and stored on
132
ice based on the growth of eight microorganisms in different tissues.
133 134
MATERIALS AND METHODS
135 136
Sea bass with an initial average weight of 430 g (380 g – 590 g) were obtained
137
from an aquaculture farm located in Gran Canaria (Canary Islands, Spain; Atlantic
138
Ocean, 27° 57′ 31″ N, 15° 35′ 33″ W). The fish were cultivated in tanks, and four
samplings were carried out randomly, with the first in winter (January), when the average
140
water temperature for the month was 19.60 ºC (batch 1); the second in spring (April), at
141
19.30 ºC (batch 2); the third in summer (July), at 22.5 ºC (batch 3); and the fourth in
142
autumn (November), at 21.30 ºC (batch 4). Fourteen fish per batch were sacrificed by
143
immersion in ice water (hypothermia), delivered to the laboratory within 1 h of harvesting
144
and packed in polystyrene boxes with ice.
145
On the day of slaughter (day 0 of the study), one whole, ungutted fish was
146
analysed, and the other fish were kept in ice in polystyrene boxes with drainage holes.
147
The ice was produced under hygienic conditions in an ice machine (ITV model IQ 135)
148
and replenished when necessary. The fish were kept in a refrigerator with a controlled
149
temperature of 2 ± 1 ºC. Microbiological analyses were performed on days 2, 4, 7, 10, 14
150
and 18 using a new fish in each analysis. Each sample was analysed in duplicate, and
151
the results are the mean of the two determinations.
152
Seawater samples were collected over four months, with one sample per week
153
from the principal tank. In every unit, temperature, pH, salinity, total dissolved solids and
154
biological oxygen demand (BOD5)(APHA, 1992) were recorded using a Horiba U 22XD 155
(Kyoto, Japan).
156 157
Sample Preparation and Microbiological Analysis
158 159
Sea bass skin and flesh (25 g) were obtained from the dorsal anterior region of the
160
right side of each fish using the technique described by Slattery (1988). The samples
161
were transferred to a Stomacher bag (Seward Medical, London, UK) containing 225 ml of
162
0.1% peptone water (Cultimed 413795) with salt (0.85% NaCl w/v) (Drosinos & Nychas,
163
1996) and homogenised for 60 seconds using a Stomacher Lab Blender 400 at high
speed (Stomacher, IUL Instrument, Barcelona, Spain). From these microbiological
165
extracts, nine decimal dilutions were prepared.
166
In addition to the skin and flesh, the gills were also analysed and weighed (9.3
167
g/fish), and the resulting value was multiplied by nine to obtain the millilitres of the first
168
serial dilution (Pascual & Calderón, 2002). The total viable counts (TVC) of mesophilic
169
and psychrotrophic bacteria were determined using Plate Count Agar (PCA Cultimed,
170
413799) (technique proposed by ISO 17410, 2001, for psychrotrophic bacteria) incubated
171
at 31 ºC for 72 h (Pascual & Calderón, 2002; ISO 4833:2003; Álvarez, et al., 2008; Corbo
172
et al., 2008; Calanche et al., 2013; Genç et al., 2013) and 6.5 ºC for 7-10 days,
173
respectively (Broekaert, 2011). Pseudomonas sp. were counted on Pseudomonas F agar
174
(Cultimed, 413796) incubated at 31 ºC for 48 h; cream-coloured, fluorescent or greenish
175
colonies were counted. Aeromonas sp. were counted on BD Yersinia Aeromonas agar
176
(BD, PA-25405605) after incubation at 31 ºC for 48 h; pale colonies with a rose to red
177
centre that were oxidase positive were counted.
178
The amount of Shewanella putrefaciens (H2S-producing bacteria) was determined 179
on Iron Agar Lyngby (IAL, prepared following instructions and using ingredients provided
180
by OXOID CM964). Iron agar plates were incubated at 20 ºC for 48-72 h, and the black
181
colonies formed by the production of H2S were counted (Dalgaard, 1995). 182
Enterobacteriaceae were counted using Violet Red Bile Glucose Agar (VRBG)
183
(Cultimed, 413745). Plates were incubated at 37 °C for 24 h, and these bacteria
184
appeared as large colonies with purple haloes (Pascual & Calderón, 2002).
185
Photobacterium phosphoreum were counted on Iron Agar Lyngby. A subsample of
186
0.1 ml was spread on a dry surface and incubated at 5 ºC for 14 days. These colonies
187
appeared in the plates as transparent drops of dew (Dalgaard, 1995).
For the sulphide-reducing Clostridium (clostridia), spores and vegetative cells were
189
counted on S.P.S. (Cultimed, 414125) and incubated at 46 ºC for 24-48 h. The black
190
colonies observed in the tubes were multiplied by a dilution factor to obtain the number of
191
CFU/g (Pascual & Calderón, 2002).
192
Counts were performed in duplicate and examined visually for the typical colony
193
types and morphology characteristics associated with each growth medium. The data are
194
reported as colony forming units (log CFU/g). Conventional biochemical tests were
195
carried out to determine the final identification, and the strains were identified according
196
to Barrow and Feltham (1993) (Table 1) and Smith Svanevik and Tore Lunestad (2011).
197 198
Statistical Analysis
199 200
For each bacterial species,
Ni, j,k ,t indicates the count (CFU/g) corresponding to
201
the ith fish, jth tissue (muscle, gill, skin) and kth batch (seasons) on observation day t. To
202
determine a pattern of bacterial growth across the observation days, the
log10Ni, j,k ,t was
203
plotted against the day by tissue (Figure 1) and batch (Figure 2). The plots for mesophilic
204
and psychrotrophic microorganisms, Pseudomonas sp., S. putrefaciens, Aeromonas sp.,
205
and Enterobacteriaceae suggested that the following linear mixed-effects model should
206
be used (Laird & Ware, 1982):
207 208 (Model 1) log10Ni, j,k ,t fishij kPr
t ei, j,k ,t 209 210where fishi indicates the random effect of the fish (i 1....56), j is the fixed tissue effect
211
( jmuscle, gill,skin),k is the batch effect ( k1,2,3,4),Pr
t is a polynomial of degree r212
(trend) and
ei, j,k ,t is the random error. The following formula was used: muscle10
213
(muscle and batch 1 were the reference categories). It was assumed that the random
214
effects fishi were independent random variables distributed according to
N 0,
f and215
that the error
ei, j,k ,t were independent random variables distributed according to N 0,
e216
and independent from the random effects fishi. To determine the optimum degree for the
217
polynomial Pr
t (trend), we considered the degrees r = 1,2,3, and the degree that218
optimised the Akaike criterion (AIC) was selected. For all the bacteria, the optimum
219
degree obtained was r = 2, and thus,
P2
t 1t2t 2(the intercept is subsumed in ).
220
The goodness of fit of the model was evaluated by the coefficient R2, which measures the
221
proportion of the variability corresponding to the fixed effects of the model.
222
To account for excess zeros for the clostridia and P. phosphoreum (44.6% for
223
Clostridium and 46.4% for P. phosphoreum), the zero-inflated Poisson (ZIP) model was
224
employed as follows (Hall, 2000):
225
226 227
This model consists of a combination of two distributions to incorporate excess
zeros, where
lnj,k ,t jk t and t is the probability of a measurement being
229
an excess zero. The logistic model
logitt t (the zeros only depended on day t)
230
was considered. Here, the vector
xj ,k ,t summarises the covariate tissue (j), batch (k) and 231
day (t). Note that the effects of tissue, batch and day are expressed with the same
232
parameters for both models. All of these regression models were fit to our data using the
233
R packages nlme (LME procedure) and PSCL (Zeroinfl procedure).
234 235
RESULTS
236 237
Descriptive Microbiological Analysis
238 239
The data on the microbial flora (log CFU/g) of aquacultured, ungutted sea bass
240
stored aerobically on ice at 2 ± 1 ºC are shown by tissue in Tables 2, 3 and 4. The results
241
are expressed as the averages of the four batches sampled.
242
Total viable counts (TVCs) increased gradually throughout the storage period from
243
day 0, except in the case of Clostridium sp. and P. phosphoreum, which began to grow
244
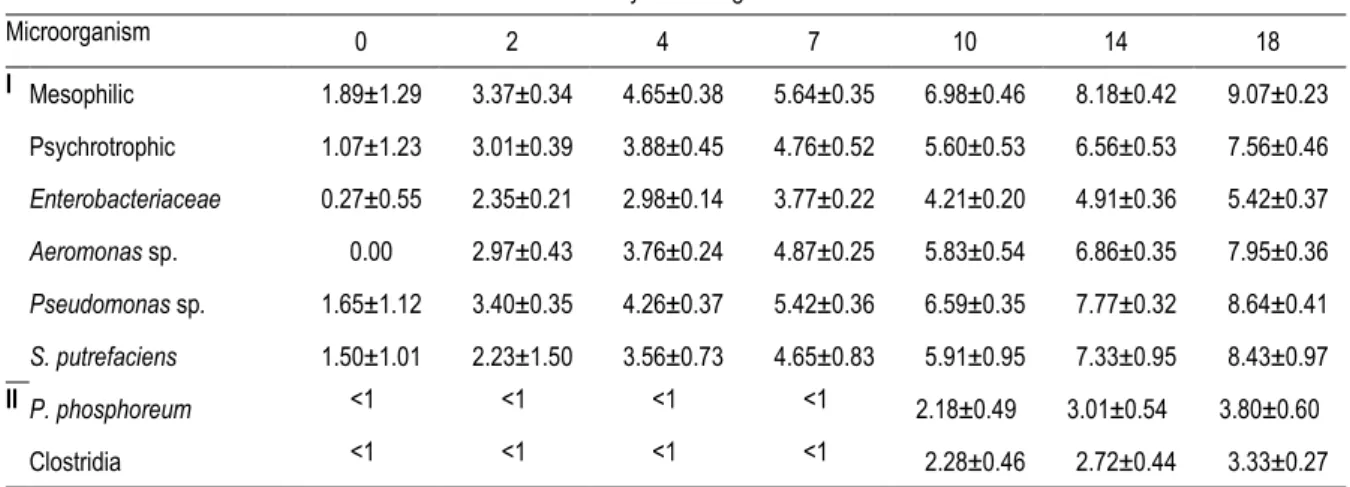
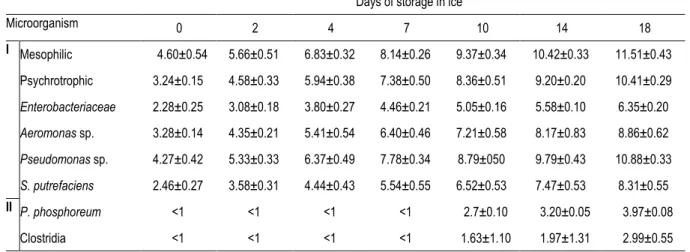
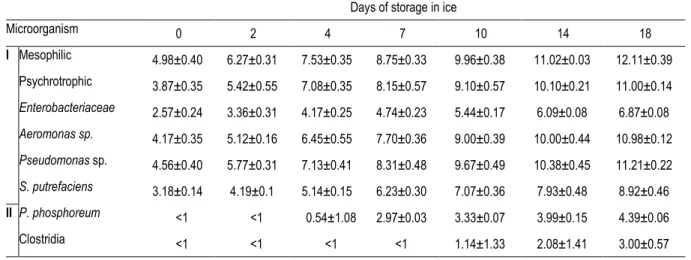
from day 7. The TVCs for mesophilic and psychrotrophic bacteria on the initial day (day
245
0) were 1.89 and 1.07 in muscle, 4.60 and 3.24 log CFU/g in skin and 4.98 and 3.87 log
246
CFU/g in gills, respectively.
247
Mesophilic and psychrotrophic bacterial counts reached 7 log CFU/g on days 10
248
and 14 in muscle, days 4 and 7 in skin and days 2 and 4 in gills, respectively. This value
249
is considered to be the maximum acceptable limit for freshwater and marine species as
250
defined by the ICMSF (1986).
Furthermore, the mesophilic counts observed in fish in this study after 18 days
252
were higher than the psychrotrophic counts (9.07 and 7.56 log CFU/g in muscle, 11.51
253
and 10.41 log CFU/g in skin and 12.11 and 11.00 log CFU/g in gills, respectively).
254
The initial counts of SSB (specific spoilage bacteria), including Pseudomonas sp.,
255
S. putrefaciens (H2S-producing bacteria) and Aeromonas sp., were 1.65, 1.50 and below 256
the detection threshold (<1 log CFU/g), in muscle; 4.27, 2.46 and 3.28 log CFU/g in skin;
257
and 4.56, 3.18 and 4.17 log CFU/g in gills, respectively.
258
In general, Pseudomonas sp. was the dominant population on day 18 of storage,
259
followed by Aeromonas sp. and S. putrefaciens, with values of 8.64, 7.95 and 8.43 log
260
CFU/g in muscle; 10.88, 8.86 and 8.31 log CFU/g in skin; and 11.21, 10.98 and 8.92 log
261
CFU/g in gills, respectively.
262
The initial Enterobacteriaceae counts were 0.27 log CFU/g in muscle, 2.28 log
263
CFU/g in skin and 2.57 log CFU/g in gills, increasing to 5.42, 6.35 and 6.87 log
264
CFU/g, respectively, after 18 days of ice storage. A low initial population was found in
265
muscle, indicating good hygiene (<102 CFU/g) in the marine environment where the
266
fish were caught as well as appropriate fishing practices and handling (Kostaki et al.,
267
2009).
268
No Clostridium sp. or P. phosphoreum were detected in all of the tissues analysed
269
at the first sampling. However, these counts increased over 18 days of iced storage to
270
3.33 and 3.80 log CFU/g in muscle, 2.99 and 3.97 log CFU/g in skin and 3.00 and 4.39
271
log CFU/g in gills, respectively. The counts and growth trend of these bacteria were
272
different from the others examined in the present study.
273
Table 7 shows the physicochemical water values, which were constant over the
274
four studied seasons.
276
Models for the Analysis of Microbiological Growth
277 278
Model 1
279 280
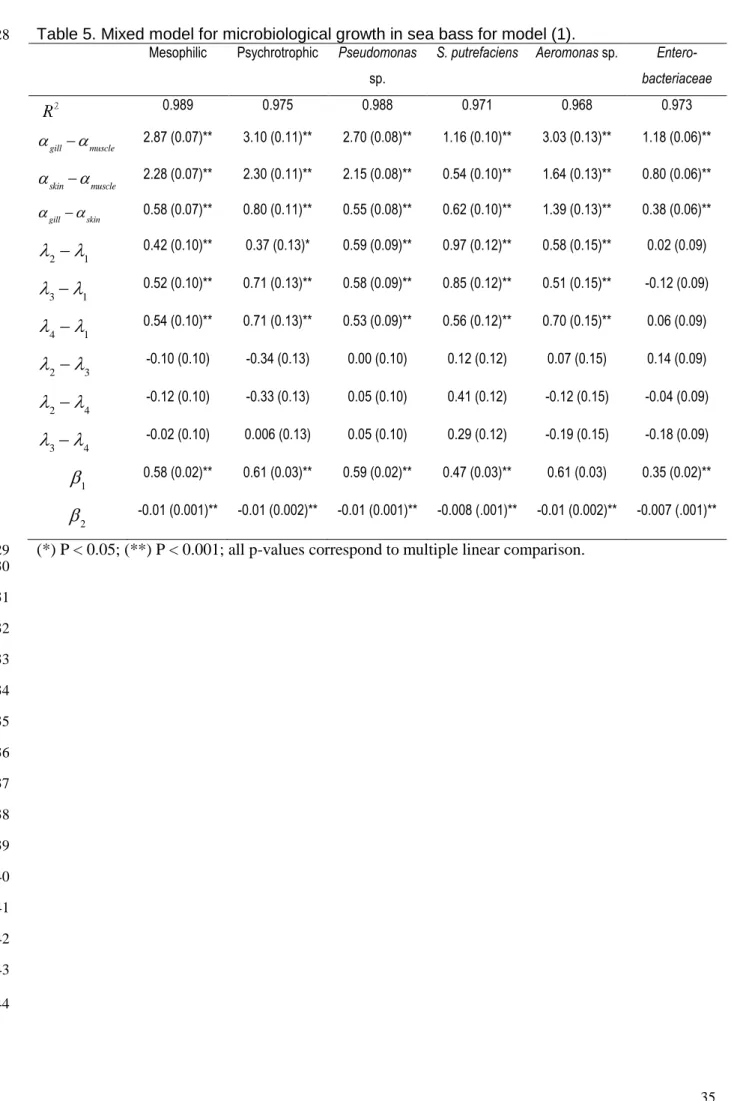
For all bacteria represented by model 1, the optimal polynomial trend obtained
281
was the quadratic with all the β2 coefficients negative, which means that the growth 282
exhibited a linear deceleration. Table 5 shows the R2 coefficients, all comparisons among
283
tissues and batches and the β1 and β2 coefficients corresponding to the quadratic trends. 284
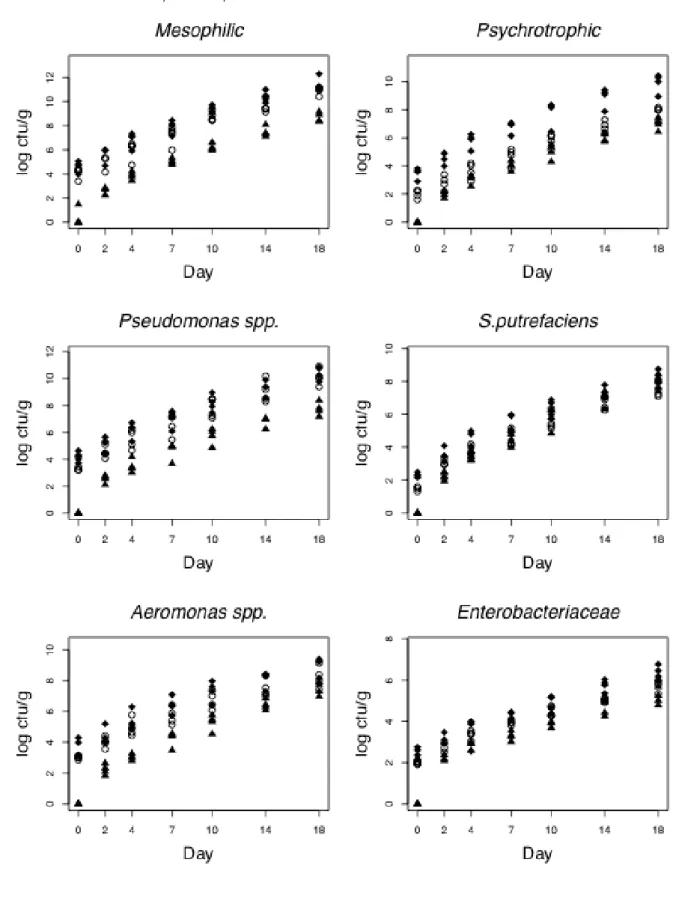
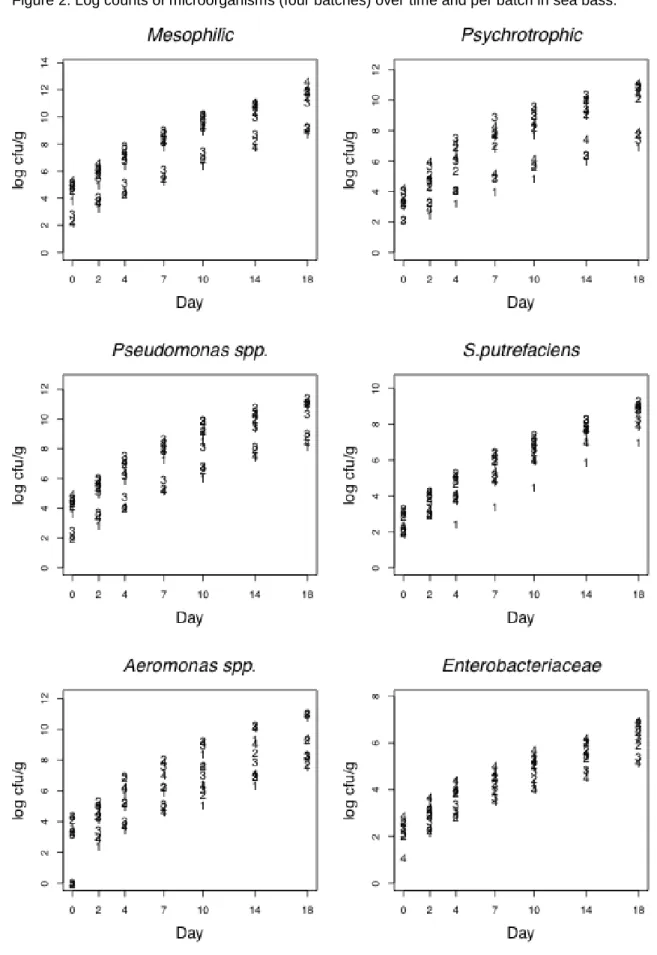
Figures 1 and 2 show the expected growth values of
log10Ni, j,k ,t mesophilic
285
aerobic bacteria, psychrotrophic bacteria, Aeromonas sp., Pseudomonas sp.,
286
Enterobacteriaceae and S. Putrefaciens plotted against each observation day according
287
to tissue and batch, respectively.
288
The linear trend for all log counts over time justified the use of this model (1). For
289
these microorganisms, the spoilage levels in gills were higher than in skin and muscle (P
290
< 0.001), with muscle the least contaminated tissue.
291
There was statistical significance between the bacterial counts (except in the case
292
of Enterobacteriaceae) in each of the batches analysed (2 1, 31 and 4 1), with
293
batch 1 (winter) the least contaminated in each case, with different results for each batch
294
depending on the microorganism studied.
295 296
Model 2
297 298
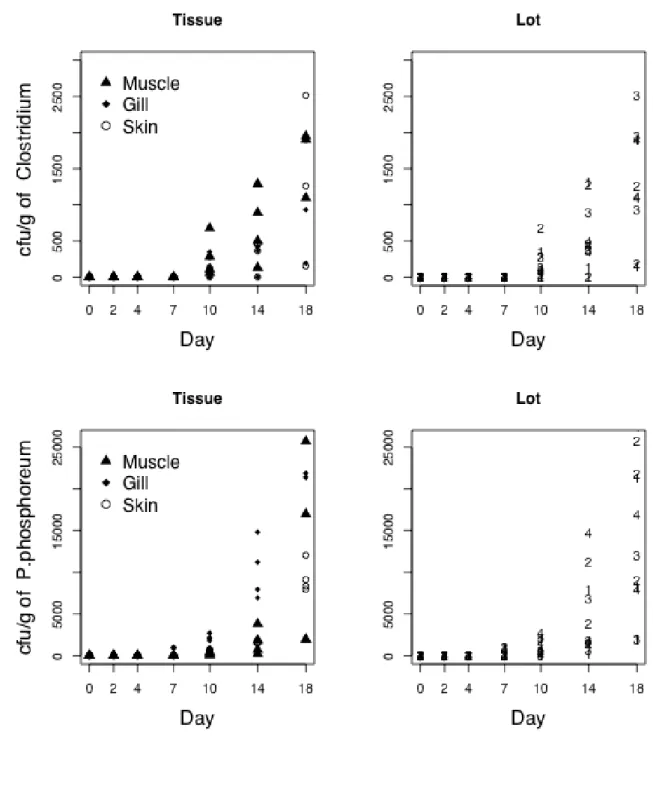
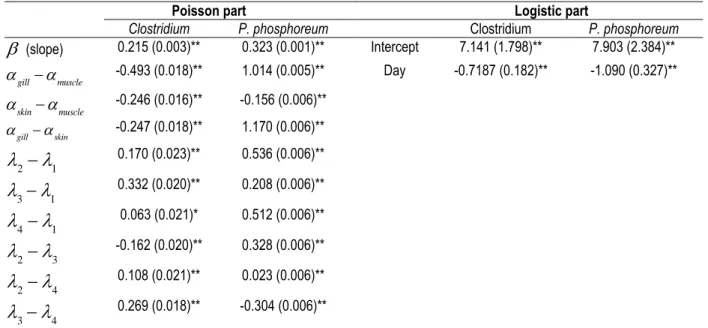
Figure 3 shows the counts
Ni, j,k ,t of sulphide-reducing Clostridium and P.
299
phosphoreum over time according to tissue and per batch. Note that the excess of zeros
300
for both counts suggested the use of model 2. The estimated values
j,k ,t (expected
301
growth) corresponding to this model and the estimated probabilities of zeros t are
302
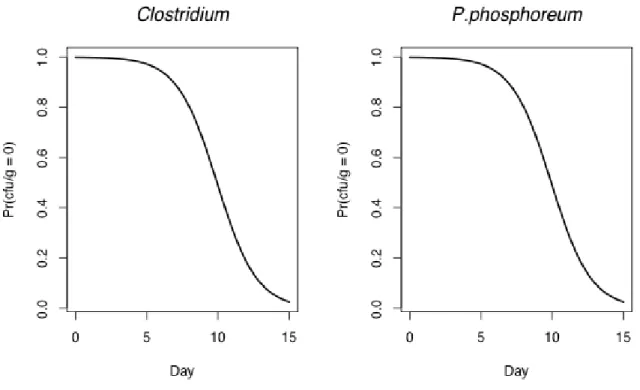
shown in Table 6. The negative coefficients of the parameter indicated that the
303
probability of zeros for sulphide-reducing Clostridium and P. phosphoreum decreased
304
over the observation period.
305
The plot of these probabilities versus days (Figure 4) showed that the probability of
306
zeros (no counts) decreased over time; from day 10, the probability of spoilage was near
307
1.
308
Table 6 shows that the contamination levels for Clostridium sp. and P.
309
phosphoreum displayed significant differences (P < 0.001) among the three tissues
310
sampled and were lower in skin and gills than in muscle.
311
Significant differences (P < 0.001) in the levels of these microorganisms were
312
observed among the four batches studied. These results suggested that the irregular
313
growth observed for these two microorganisms could be dependent on water
314
temperature or other environmental factors.
315 316
DISCUSSION
317 318
Previous authors have found similar results in the initial counts for mesophilic and
319
psychrotrophic bacteria in muscle (Cakli et al., 2006b; Kostaki et al., 2009) or skin in
320
ungutted sea bass stored on ice. However, other authors have reported higher results in
the initial TVC values in the muscle of ungutted sea bass (Taliadourou et al., 2003; Kilinc
322
et al., 2007), sea bream fillets (Erkan & Ueretener, 2010) and ungutted sea bass
323
(Papadopoulos et al., 2003) or the skin of whole sea bream (Cakli et al., 2007; Erkan,
324
2007). The differences observed in TVCs in the different studies may be due to the
325
microbiological conditions of fish muscle in ungutted sea bream, which are directly
326
related to the fishing ground, sanitary conditions of the slaughterhouse and
327
environmental factors (Ward and Baj, 1988).
328
The bacteria in other studies reached counts of 7-9 log CFU/g after 15 days of
329
storage in sea bass muscle (Cakli et al., 2006a; Cakli et al., 2006b; Kilinc et al., 2007;
330
Cakli et al., 2007), 7 log CFU/g after 16 days in ungutted sea bass fillets (Papadopoulos
331
et al., 2003), 6.7 and 7.6 log CFU/g after 13 and 16 days in sea bream fillets, respectively
332
(Erkan & Ueretener, 2010), and 7 log CFU/g after 11 and 14 days in sea bream muscle
333
with skin, under different culture conditions (López-Caballero et al., 2002).
334
Similar results for mesophilic and psychrotrophic bacteria were reported in sea
335
bream skin, with counts of 7.20 and 7.35 log CFU/g, respectively, after 15 days (Cakli et
336
al., 2007) and 6.6 and 6.8 log CFU/cm2, respectively, after 13 days of storage (Erkan,
337
2007).
338
The slightly higher count of mesophilic microorganisms compared to
339
psychrotrophic microorganisms observed in the three tissues analysed in the present
340
study may have been due to the influence of the water temperature in the breeding tanks,
341
which ranged between 18 and 23 ºC. However, other studies with temperatures ranging
342
between 14 and 27 ºC found significant changes in the bacterial counts and greater
343
growth of psychrotrophic microorganisms (Grigorakis et al. 2003) resulting from the
344
greatly reduced intensive thermal shock when the fish were placed on ice (14 to 2 ºC),
resulting in a decreased lag phase and allowing spoilage to proceed more quickly (Ashie
346
et al., 1996; Ward & Bai, 1988). In our study, the microbial load of mesophilic
347
microorganisms on day 0 of ice storage was higher than that of the psychrotrophic
348
microorganisms (0.82 in muscle, 1.36 in skin and 1.11 in gills). This difference was
349
consistently maintained over 18 days of storage and may have been due to an extended
350
lag phase.
351
Our results are in agreement with the initial counts of Pseudomonas sp. for
352
ungutted European hake stored on ice reported by Baixas-Nogueras et al. (2009). Other
353
authors described higher initial counts of Pseudomonas sp. in muscle, with 3.0 log CFU/g
354
for sea bass (Papadopoulos et al., 2003; Paleologos et al., 2004) and 3.9 log CFU/g for
355
sea bream (Özden et al., 2007), as well as 3.3 log CFU/g in gutted sardine samples
356
(Erkan & Özden, 2008) and 2.88 log CFU/g in horse mackerel (Tzikas et al., 2007). Initial
357
S. putrefaciens counts accounted for a large proportion of the microflora in the muscle of
358
several species such as sea bass, with values of 2.2 log CFU/g (Paleologos et al., 2004);
359
sea bream, with values of 4.4 log CFU/g (Özden et al., 2007); sardines, at 3.3 CFU/g
360
(Erkan & Özden, 2008); and sea bream skin, at 3.3 log CFU/g (Erkan, 2007). However,
361
these values differed from those reported in our study, which were more closely aligned
362
with those described by López-Caballero et al. (2002), Lougovois et al. (2003) and
363
Baixas-Nogueras et al. (2009).
364
The final counts of Pseudomonas sp. and S. putrefaciens were similar to those
365
reported by other authors in sea bass muscle, at 7-7.2 log CFU/g (Pseudomonas sp.)
366
and 6.6 and 7 log CFU/g (S. putrefaciens) (Papadopoulos et al., 2003; Paleologos et al.,
367
2004), and in sea bream, which ranged from 6-7.8 log CFU/g (López-Caballero et al.,
368
2002; Lougovois et al. 2003; Özden et al., 2007); sardines, with values of 4 and 4.9 log
CFU/g, respectively, after nine days of storage (Erkan & Özden, 2008); horse mackerel,
370
with values of 6.42 and 5.12 log CFU/g, respectively, after 12 days of storage on ice
371
(Tzikas et al., 2007); and sea bream skin, with values of 6.7 log CFU/g after 13 days of
372
storage on ice for H2S-producing bacteria (Erkan, 2007). 373
Similar counts for Pseudomonas sp. and S. putrefaciens and SSB have been
374
reported in fish from temperate and tropical waters (Gillespie, 1981; Lima dos Santos,
375
1981; Gram & Huss, 1996) and in fresh Mediterranean fish stored aerobically under
376
refrigeration (Koutsoumanis & Nychas, 1999) or on ice (Gennari & Tomaselli, 1988;
377
Gennari et al., 1999; Sant’Ana et al., 2011). The counts of S. putrefaciens reported in the
378
present study were lower than those observed for Pseudomonas sp. at the end of the
379
storage period, possibly because Pseudomonas sp. and S. putrefaciens have specific
380
iron-chelating systems (siderophores), and when these are co-cultured on fish samples,
381
the siderophore-producing Pseudomonas sp. inhibits the growth of S. putrefaciens (Gram
382
& Dalgaard, 2002; Olafsdóttir et al., 2006).
383
In the present study, the initial Enterobacteriaceae counts were lower than
384
those of SSB at the end of the storage period, in agreement with the results reported
385
for different fresh Mediterranean fish at the end of their shelf lives (Gennari &
386
Tomaselli, 1988; Gennari et al., 1999; Koutsoumanis & Nychas, 1999; Tejada &
387
Huidobro, 2002). Initial Enterobacteriaceae counts in fresh fish muscle were similar
388
to those reported for ungutted European hake (Baixas-Nogueras et al., 2009).
389
However, other authors have described higher initial counts, although the same
390
authors have reported similar values to those described here in different species after
391
a period of storage on ice, such as sea bass, with counts of 2 and 4.2 log CFU/g
392
(initial and final counts, respectively) (Papadopoulos et al., 2003); sea bream, with
counts of 3.9 and 5.6 log CFU/g (initial and final counts, respectively) (Özden et al.,
394
2007); and sardines, with counts of 3.5 and 5.08 log CFU/g (initial and final counts,
395
respectively) (Erkan & Özden, 2008). The contribution of Enterobacteriaceae to the
396
microflora of fish and its spoilage potential must be taken into consideration,
397
especially in the case of polluted water or as a result of a delay in chilling after the
398
catch (Chouliara et al., 2004), as well as in the filleting process (Moini et al., 2009).
399
Although this group of bacteria can grow at low temperatures, their abundance
400
decreases during storage on ice, possibly because their growth rate is lower than
401
that of other Gram-negative psychrotrophic spoilers, making them poor competitors
402
(Bahmani et al., 2011).
403
The counts of P. phosphoreum were similar to those found in bogue fish stored
404
aerobically, whereas the contribution of P. phosphoreum was very small and relatively
405
unimportant (Koutsoumanis and Nychas, 1999).
406 407
Model 1
408 409
A batch effect was observed, likely due to the different water temperatures in the
410
tanks where the sea bass were cultivated in all seasons. These results agree with those
411
published by Iliopoulou-Georgudaki et al. (2009), who observed that temperature,
412
dissolved oxygen and conductivity had a significant influence on microbial populations in
413
aquacultured fish. Other authors (Grigorakis et al., 2003, 2004) detected differences
414
between microbial counts in December (water temperature: 14 ºC) and July (water
415
temperature: 25 ºC), showing that summer fish presented higher rates of autolytic activity
416
but lower rates of microbial spoilage.
For the bacteria shown in Figures 1 and 2, the type 1 model is based on the
418
corresponding data represented in Figures 1 and 2, in which the differences in the
419
log counts among the tissues and the batches remain constant throughout the
420
observed days. A polynomial trend is sufficient to explain the microbial kinetics, and
421
the Akaike criterion (AIC) allows for the selection of the optimal degrees of freedom.
422
All R2 coefficients representing the variability due to fixed effects were greater than
423
95% (except for the outlying integer pair of 93.8%), indicating that the data fit the
424 model well. 425 426 CONCLUSIONS 427 428
The present study provides predictive models that can be used as tools for the
429
optimisation of the shelf life of the sea bass throughout the year based on eight
430
species of microorganisms in three different tissues (muscle, skin and gills).
431
These models revealed significant differences (P < 0.001) in the microbial
432
growth between the sampled tissues and batches. The highest contamination was
433
detected in gills, followed by skin and muscle. However, Clostridium sp. and P.
434
phosphoreum followed a different model than the other studied microorganisms,
435
showing greater contamination in muscle.
436
Because the measured physicochemical parameters remained relatively
437
constant throughout the year, except for the temperature, temperature may be the
438
main cause of the observed seasonal differences. Further studies on predictive
439
modelling using physicochemical parameters should provide more raw data on
440
microbial evolution in ungutted sea bass.
442
Acknowledgements
443 444
We are very grateful to our families for their support during the preparation of
445
this manuscript. We also want to thank to Dr. Pablo Lupiola for his help in the
446 microbiological study. 447 448 References 449 450
Álvarez, A., García, B., Garrido, M.D. & Hernández, M.D. (2008). The influence of starvation time
451
prior to slaughter on the quality of commercial-sized gilthead seabream (Sparus aurata) during ice
452
storage. Aquaculture, 284, 106–114.
453
APROMAR. (2012). La Acuicultura Marina de Peces en España. APROMAR. 454
http://www.apromar.es/Informes/informe%202012/Informe-APROMAR-2012.pdf. 455
APHA. (1992). Standard methods for examination of water and wastewater. 18th Ed. American Public 456
Health Association. Washington D.C. 457
Ashie, I. N. A., Smith, J. P., & Simpson, B. K. (1996). Spoilage and self-life extension of fresh fish and 458
shelfish. Critical Reviews in Food Science and Nutrition, 36(1–2), 87–121. 459
Bahmani, Z.A., Rezai, M., Hosseini, S.V., Regenstein, J.M., Böhme, K., Alishahi, A. & Yadollahi, F. 460
(2011). Chilled storage of golden gray mullet (Liza aurata). LWT - Food Science and Technology, 44, 461
1894-1900. 462
Baixas-Nogueras, S., Bover-Cid, S., Veciana-Nogué, M.T. & Vidal-Carou, M.C. (2009). Effect of 463
gutting on microbial loads, sensory properties, volatile and biogenic amine contents of European 464
Hake (Merluccius merluccius var. mediterraneus) stored in ice. Journal of Food Protection, 72, 1671-465
1676. 466
Barrow, G.I. & Feltham, R.K. (1993). Cowan and Steel's manual for the identification of medical 467
bacteria. Cambridge University, UK. Cambridge. 468
Boulares, M., Mejri, L. & Hassouna, M. (2010). Study of the microbial ecology of wild and aquacultured 469
tunisian fresh fish. Journal Food Protection, 10, 1762-1768. 470
Broekaert, K., Heyndrickx, M., Herman, L., Devlieghere, L. & Vlaemynck, G. (2011). Seafood quality 471
analysis: Molecular identification of dominant microbiota after ice storage on several general growth 472
media. Food Microbiology, 28, 1162-1169. 473
Bruckner, S., Albrecht, A., Petersen, B. & Kreyenschmidt, J. (2013). A predictive shelf life model as a 474
tool for the improvement of quality management in pork and poultry chains. Food Control, 29, 451-460. 475
Cakli, S., B. Kilinc, B., Dincer, T. & Tolasa, S. (2006a). Comparison of the shelf lifes of map and 476
vacuum packaged hot smoked rainbow trout (Onchoryncus mykiss). European Food Research 477
Technology , 224, 19–26.
478
Cakli, S., Kilinc, B., Cadun, A., Dincer, T. & Tolasa, S. (2006b). Effects of gutting and ungutting on 479
microbiological, chemical, and sensory properties of aquacultured sea bream (Sparus aurata) and sea 480
bass (Dicentrarchus labrax) stored in ice. Critical Reviews in Food Science and Nutrition. 46, 7 , 519-481
527. 482
Cakli, S., Kilinc, B., Cadun, A., Dincer, T. & Tolasa, S. (2007). Quality differences of whole ungutted 483
sea bream (Sparus aurata) and sea bass (Dicentrarchus labrax) while stored in ice. Food Control, 18, 484
391-397 485
Calanche., J., Samayoa, S., Alonso, V., Provincial, L., Roncalés, P. &. Beltrán, J.A. (2013). Assessing 486
the effectiveness of a cold chain for fresh fish salmon (Salmo salar) sardine (Sardina pilchardus) in a 487
food processing plant. Food Control, 33, 126-135. 488
Chouliara, I., Sawaidis, L.N., Riganakos, K. & Kontaminas, M.G. (2004). Preservation of salted, 489
vacuum-packaged, refrigerated sea bream (Sparus aurata) fillets by irradiation: microbiological, 490
chemical sensory attributes Food Microbiology, 21, 351-359. 491
Corbo, M.R., Speranza, B., Filippone, A., Granatiero, S., Conte, A., Sinigaglia, M., Del Nobile, M.A. 492
Study on the synergic effect of natural compounds on the microbial quality decay of packed fish 493
hamburger. International Journal of Food Microbiology, 127, 261–267. 494
De Koning, A.J. (2004). Rates of Cholesterol Ester Formation During Storage of Anchovy (Engraulis 495
capensis) at Various Temperatures. International Journal of Food Properties, 7, 321-327.
496
Dalgaard, P. (1995). Qualitative quantitative characterisation of spoilage bacteria from packed fish. 497
International Journal of Food Microbiology, 26, 319-334.
Drosinos, E.H. & Nychas, G.J.E. (1996). Brochothrix thermosphacta, a dominant microorganism in 499
Mediterranean fresh fish (Sparus aurata) stored under modified atmosphere. Italian Journal of Food 500
Science, 8, 323-329.
501
El Marrakchi, A., Bennour, M., Bouchriti, N., Hamama, A., & Tagafait, H. (1990). Sensory, chemical 502
and microbiological assessments of Moroccan sardines (Sardina pilchardus) stored in ice. Journal of 503
Food Protection, 53(7), 600–605.
504
Erkan, N. (2007). Sensory, chemical, and microbiological attributes of sea bream (Sparus aurata): 505
effect of washing and ice storage. InternationalJournal of Food Properties, 10, 421-434. 506
Erkan, N. & Özden, O. (2008). Quality assessment of whole and gutted sardines (Sardina pilchardus) 507
stored in ice. International Journal of Food Science and Technology,43, 1549-1559. 508
Erkan, N. & Ueretener, G. (2010). The effect of high hydrostatic pressure on the microbiological, 509
chemical and sensory quality of fresh gilthead sea bream (Sparus aurata). European Food Research 510
Technology , 230, 533-542.
511
Francois, K., Devlieghere, F., Uyttendaele, M., Standaert, A. R., Geeraerd, A. H., Nadal, P., et al., 512
(2006). Single cell variability of L. monocytogenes grown on liver pâté and cooked ham at 7ºC: 513
comparing challenge test data to predictive simulations. Journal of Applied Microbiology, 100, 800-812 514
Genç, I. Y., Esteves, E, Anibal, J. & Diler, A. (2013). Effects of chilled storage on quality of vacuum 515
packed meagre fillets. Journal of Food Engineering, 115, 486–494. 516
Gennari, M., Tomaselli, S & Cantrona, V. (1999). The microflora of fresh and spoiled sardinas 517
(Sardinas pilchardus) caught in Adriatic (Mediterranean) sea and stored in ice. Food microbiology, 16, 518
15-28. 519
Gennari, M. & Tomaselli, S. (1988). Changes in aerobic microflora of skin and gills of Mediterranean 520
sardines (Sardina pilchardus) during storage in ice. International Journal of Food Microbiology, 6, 341-521
347. 522
Gillespie, N.C. (1981). A numerical taxonomic study of Pseudomonas-like bacteria isolated from fish in 523
Southeastern Queensland and their association with spoilage. Journal of Applied Microbiology, 50, 29-524
44. 525
Gram, L & Dalgaard, P. (2002). Fish spoilage bacteria – problems and solutions. Current opinion in 526
biotechnology. 13, 262–266.
527
Gram, L., & Huss, H. (1996). Microbiological spoilage of fish and fish products. International Journal of 528
Food Microbiology, 33, 589-595.
529
Grigorakis, K., Taylor, K.D.A. & Alexis, M.N. (2003). Seasonal pattern of spoilage of ice stored 530
cultured gilthead sea bream (Sparus aurata). Food Chemistry, 81, 263-268. 531
Grigorakis, K., Alexis, A., Gialamas, I. & Nikolopoulou, D. (2004). Sensory, microbiological, and 532
chemical spoilage of cultured common sea bass (Dicentrarchus labrax) stored in ice: a seasonal 533
differentiation. European Food Research Technology, 219, 584-587.
534
Guillén-Velasco, S., Ponce-Alquicira, E., Farrés-González Saravia, A. & Guerrero-Legarreta, I. (2004). 535
Histamine Production by Two Enterobacteriaceae Strains Isolated from Tuna (Thunnus thynnus) and 536
Jack Mackerel (Trachurus murphyii ). International Journal of Food Properties, 7, 91-103. 537
Hall D.B. (2000). Zero-inflated Poisson and binomial regression with random effects: a case study. 538
Biometrics, 56, 1030-1039.
539
Hugh R, Leifson E. (1953). The taxonomic significance of fermentative versus oxidative Gram-540
negative bacteria. Journal Bacteriology; 66:24–26. 541
Huss, H.H., Dalgaard, P. & Gram, L. (1995). Microbiology of fish and fish products. In Seafood from 542
Producer to Consumer, Integrated approach to Quality. Proceedings of the International Seafood 543
Conference on the occasion of the 25th anniversary of the WEFTA, held in Noordwijkerhout, The 544
Netherlands, 13-16 November, 1995. 545
ICMSF (International Commission on Microbiological Specifications for Foods). (1986). Sampling 546
plans for fish and shellfish in microorganisms in foods. Sampling for microbiological analysis: 547
principles and scientific applications, 2nd. Edt, vol 2. University of Toronto Press, Toronto, 181-196. 548
Iliopoulou-Georgudaki, J., Theodoropoulos, C., Venieri, D. & Lagkadinou, M. (2009). A model 549
predicting the microbiological quality of aquacultured sea bream (Sparus aurata) according to 550
physicochemical data: an application in western Greece fish aquaculture. International Journal of 551
Biological and Life Sciences, 5:1, pp. 1-8.
ISO, 2001. ISO 17410: Microbiology of Food and Animal Feeding Stuffs – Horizontal Method for the 553
Enumeration of Psychrotrophic Microorganisms. International Organization for Standardization, 554
Geneve, Switzerland, 7 pp. 555
ISO, 2003. ISO 4833: Microbiology of Food and Animal Feeding Stuffs – Horizontal Method for the 556
Enumeration of Microorganisms – Colony-Count Technique at 30 ºC. International Organization for 557
Standardization, Geneve, Switzerland, 9 pp. 558
Kilinc, B., Cakli, S., Cadun, A., Dincer, T. & Tolasa, S. (2007). Comparison of effects of slurry ice and 559
flake ice pretreatments on the quality of aquacultured sea bream (Sparus aurata) and sea bass 560
(Dicentrarchuslabrax) stored at 4 degrees ºC. Food Chemistry, 104, 1611-1617. 561
Kostaki, M., Giatrakou, V., Savvaidis, I. & Kontominas, M. G. (2009). Combined effect of MAP and 562
thyme essential oil on the microbiological, chemical and sensory attributes of organically aquacultured 563
sea bass (Dicentrarchus labrax) fillets. Food Microbiology, 26, 475–482. 564
Koutsoumanis, K. & Nychas, G. (1999). Chemical and sensory changes associated with microbial flora 565
of Mediterranean boque (Boops boops) stored aerobically at 0, 3, 7 y 10ºC. Applied Environmental 566
Microbiology, 65, 698-706.
567
Koutsoumanis, K. & Nychas, G. (2000). Application of a systematic procedure to develop a microbial 568
model for rapid fish shelf life predictions. International Journal of Food Microbiology, 60, 171-184. 569
Ladrat, C. D., Bagnis, V. V., Noël, J., & Fleurence, J. (2004). Proteolytic potential in white muscle of 570
sea bass (Dicentrarchus labrax) during post mortem storage on ice: time-dependent changes in the 571
activity of the components of the calpain system. Food Chemistry, 84, 441-446. 572
Laird, N.M. & Ware, J. H. (1982). Random-Effects models for longitudinal data. Biometrics, 38, 963-573
974. 574
Lima Dos Santos, C., James, D., & Teutscher, F. (1981). Guidelines for chilled fish storage 575
experiments. FAO Fish Tech. Pap., 210 p. 576
Limbo. S., Sinelli, N., Torri, L. & Riva, M. (2009). Freshness decay and shelf life predictive modelling 577
of European sea bass (Dicentrarchus labrax) applying chemical methods and electronic nose. LWT - 578
Food Science and Technology, 42, 977–984.
López-Caballero, M. A., Huidobro, A., Pastor, A. & Tejada, M. (2002). Microflora of gilthead sea 580
bream (Sparus aurata) stored in ice. Effect of washing. European Food Research Technology, 215, 581
396-400. 582
Lougovois, V.P., Kyranas, E.R. & Kyrana, V.R. (2003). Comparison of selected methods of assessing 583
freshness quality and remaining storage life of iced gilthead sea bream (Sparus aurata). Food 584
Research International, 36, 551-560.
585
Manios, S. G., Konstantinidis, Gounadaki, A., & Skandamis, P. N. (2011). Single cell variability and 586
population dynamics of Listeria monocytogenes and Salmonella Typhimurium in fresh-cut salads and 587
their sterile liquid or solidified extracts. In E. Cummins, J. M. Frias, & V. P. Valdramidis (Eds.), Seventh 588
international conference on predictive modelling in foods e Conference proceedings (pp. 49-52). 589
Dublin, Ireland: UCD, DIT, Teagasc. 590
McMeekin, T. A., Olley, J., Ross, T., & Ratkowsky, D. A. (1993). Predictive microbiology: Theory and 591
application. Innovation in microbiology. Taunton, UK: Research Studies Press and John Wiley and 592
Sons. 593
Moini, S., Tahergorabi, R., Hosseini, S. V., Rabbani, M., Tahergorabi, Z., Feàs, X. & Aflaki, F. (2009). 594
Effect of gamma radiation on the quality and shelf life of refrigerated 595
rainbow trout (Oncorhynchus mykiss) fillets. Journal of Food Protection, 72, 596
1419-1426. 597
Olafsdóttir, G., Lauzon, H. L., Martinsdóttir, E., & Kristbergsson, K. (2006). Influence of storage 598
temperature on microbial spoilage characteristics of haddock fillets (Melanogram musaeglefinus) 599
evaluated by multivariate quality prediction. International Journal of Food Microbiology, 111, 112-125. 600
Özden, O., Inugur, M. &·Erkan, N. (2007). Preservation of iced refrigerated sea bream (Sparus aurata) 601
by irradiation: microbiological, chemical and sensory attributes. European Food Research 602
Technology, 225, 797-805.
603
Özogul, F., Kuley, E. & Özogul, Y. (2007). Sensory, chemical and microbiological quality parameters 604
in sea bream (Sparus aurata) stored in ice or wrapped in cling film or in aluminium foil at 2 +/- 1 ºC. 605
International Journal of Food Science and Technology, 42, 903-909. 606
Özyurt, G., Kuley, E.,Özkutuk, S. & Özogul, F. (2009). Sensory, microbiological and chemical 607
assessment of the freshness of red mullet (Mullus barbatus) and goldband goatfish (Upeneus 608
moluccensis) during storage in ice. Food Chemistry, 114 , 505-510.
609
Paleologos, E.K., Savvaidis, I.N. & Kontominas, M.G. (2004). Biogenic amines formation and its 610
relation to microbiological and sensory attributes in ice-stored whole, gutted and filleted Mediterranean 611
sea bass (Dicentrarchus labrax). Food Microbiology, 21, 549-557. 612
Papadopoulos, V., Chouliara, I., Badeka, A., Savvaidis, I. & Kontominas, M. (2003). Effect of gutting 613
on microbiological, chemical, and sensory properties of aquacultured sea bass (Dicentrarchus labrax) 614
stored in ice. Food Microbiology, 20, 411-420. 615
Pascual, M.R. & Calderón, V. (2002). Microbiología alimentaria: metodología analítica para alimentos 616
y bebidas. 2º Edición. Edt. Díaz de Santos. Madrid. Spain. 617
Pérez-Sánchez, J.M. & Moreno-Batet, E. (1991). Invertebrados marinos de Canarias. (Edited by 618
Ediciones del Cabildo Insular de Gran Canaria). Pp. 335. Las Palmas de Gran Canaria. Spain. 619
Ross, T., Dalgaard, P. and, Tienungoon. S. (2000). Predictive modelling of the growth and survival of 620
Listeria in fishery products. International Journal of Food Microbiology, 62, 231–245.
621
Sant’Ana, L.S., Soares, S. & Vaz-Pires, P. (2011). Development of a quality index method (QIM) 622
sensory scheme and study of shelf-life of ice-stored blackspot sea bream (Pagellus bogaraveo). LWT- 623
Food Science and Technology, 44, 2253-2259.
624
Shewan, J. M. & Hobbs, G. (1967). The bacteriology of fish spoilage and preservation. Progresive 625
Industrial Microbiology, 6, 169–208.
626
Slattery, S. L. (1988).Shelf-life of Spanish mackerel (Scomberomorus commerson) from northern 627
Australian waters. Journal of Aquatic Food Product Technology, 7, 63-79. 628
Smith Svanevik, C. & Tore Lunestad, B. (2011). Characterisation of the microbiota of Atlantic mackerel 629
(Scomber scombrus). International Journal of Food Microbiology, 151, 164-170. 630
Sperber, W.H. & Doyle M.P. (2009). Compendium of the Microbiological Spoilage of Foods and 631
Beverages. Springer Science, Business Media LLC, New York, NY. 632
Sumner, J., Orejana, F., & Cordial, N. (1986). Keeping quality in ice of tilapia from warm and cold 633
waters. Asean Food Journal, 2(2), 71–73. 634
Taliadourou, D., Papadopoulos, V., Domvridou, E., Savvaidis, I. N. & Kontominas, M.G. (2003). 635
Microbiological, chemical and sensory changes of whole and filleted Mediterranean aquacultured sea 636
bass (Dicentrarchus labrax) stored in ice. Journal of the Science of Food and Agriculture, 83, 1373– 637
1379. 638
Tejada, M. & Huidobro, A. (2002).Quality of farmed gilthead sea bream (Sparus aurata) during ice 639
storage related to the slaughter method and gutting.European Food Research and Technology, 215, 640
1-7. 641
Tzikas, Z., Ambrosiadis, I., Soultos, N. & Georgakis, S. (2007). Quality assessment of Mediterranean 642
horse mackerel (Trachurus mediterraneus) and blue jack mackerel (Trachurus picturatus) during 643
storage in ice. Food Control, 18, 1172-1179. 644
Van Impe, J.F., Vercammen, D., & Van Derlinden, E. (2013). Toward a next generation of predictive 645
models: A systems biology primer. Food Control, 29, 336-342. 646
Ward D.R. & Baj N.J. (1988). Factors affecting microbiological quality of seafood. Food Technology, 647
42, 85-89. 648
Whiting, R. C. (1995). Microbial modelling in foods. Critical Reviews in Food Science and Nutrition, 35, 649 467–494. 650 651 652 653 654 655 656 657 658 659 660 661 662 663
Figure 1. Log counts of microorganisms (four batches) over time and according to tissue in sea 664
bass: = Muscle; = Gill; = Skin. 665
666 667 668
Figure 2. Log counts of microorganisms (four batches) over time and per batch in sea bass. 669
Figure 3. Counts of clostridia and P. phosphoreum according to tissue and batch in sea bass. The 672
zero rates were 44.6% for clostridia and 46.4% for P. phosphoreum 673 674 675 676 677 678
Figure 4. Probabilities of zeros for Clostridium and P. phosphoreum by observation day in sea bass. 680 681 682 683 684 685 686 687 688 689 690 691 692 693 694
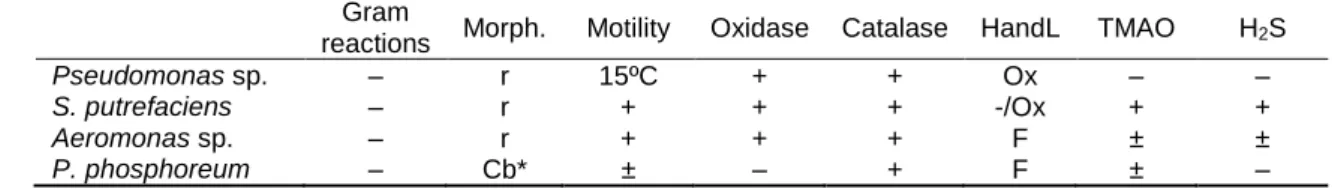
Table 1. Provisional identification of strains isolated from sea bream stored in ice. 695
Gram
reactions Morph. Motility Oxidase Catalase HandL TMAO H2S
Pseudomonas sp. – r 15ºC + + Ox – –
S. putrefaciens – r + + + -/Ox + +
Aeromonas sp. – r + + + F ± ±
P. phosphoreum – Cb* ± – + F ± –
Morphology: (cb) coccobacilli, (r) rods, (*) large round cells. 696
HandL: Oxidative or fermentative metabolism of glucose was performed in the medium of Hugh and Leifson (Hugh 697
and Leifson, 1953). 698
TMAO: trimethylamine oxide (TMAO) reduction. 699 700 701 702 703 704 705 706 707 708 709 710 711 712 713 714 715 716 717 718 719 720 721 722 723 724 725 726 727 728 729 730 731 732 733 734 735 736 737 738 739 740 741 742 743 744 745 746 747 748 749 750 751
Table 2. Changes in bacteria count (log CFU/g) in muscle of ungutted sea bass stored in ice. 753
Days of storage in ice
Microorganism 0 2 4 7 10 14 18 I Mesophilic 1.89±1.29 3.37±0.34 4.65±0.38 5.64±0.35 6.98±0.46 8.18±0.42 9.07±0.23 Psychrotrophic 1.07±1.23 3.01±0.39 3.88±0.45 4.76±0.52 5.60±0.53 6.56±0.53 7.56±0.46 Enterobacteriaceae 0.27±0.55 2.35±0.21 2.98±0.14 3.77±0.22 4.21±0.20 4.91±0.36 5.42±0.37 Aeromonas sp. 0.00 2.97±0.43 3.76±0.24 4.87±0.25 5.83±0.54 6.86±0.35 7.95±0.36 Pseudomonas sp. 1.65±1.12 3.40±0.35 4.26±0.37 5.42±0.36 6.59±0.35 7.77±0.32 8.64±0.41 S. putrefaciens 1.50±1.01 2.23±1.50 3.56±0.73 4.65±0.83 5.91±0.95 7.33±0.95 8.43±0.97 II P. phosphoreum <1 <1 <1 <1 2.18±0.49 3.01±0.54 3.80±0.60 Clostridia <1 <1 <1 <1 2.28±0.46 2.72±0.44 3.33±0.27 Mean of four batches (±) standard deviation.
754 755 756 757 758 759 760 761 762 763 764 765 766 767 768 769 770 771 772 773 774 775 776
Table 3. Changes in bacteria count (log CFU/g) in skin of ungutted sea bass stored in ice. 778
Days of storage in ice
Microorganism 0 2 4 7 10 14 18 I Mesophilic 4.60±0.54 5.66±0.51 6.83±0.32 8.14±0.26 9.37±0.34 10.42±0.33 11.51±0.43 Psychrotrophic 3.24±0.15 4.58±0.33 5.94±0.38 7.38±0.50 8.36±0.51 9.20±0.20 10.41±0.29 Enterobacteriaceae 2.28±0.25 3.08±0.18 3.80±0.27 4.46±0.21 5.05±0.16 5.58±0.10 6.35±0.20 Aeromonas sp. 3.28±0.14 4.35±0.21 5.41±0.54 6.40±0.46 7.21±0.58 8.17±0.83 8.86±0.62 Pseudomonas sp. 4.27±0.42 5.33±0.33 6.37±0.49 7.78±0.34 8.79±050 9.79±0.43 10.88±0.33 S. putrefaciens 2.46±0.27 3.58±0.31 4.44±0.43 5.54±0.55 6.52±0.53 7.47±0.53 8.31±0.55 II P. phosphoreum <1 <1 <1 <1 2.7±0.10 3.20±0.05 3.97±0.08 Clostridia <1 <1 <1 <1 1.63±1.10 1.97±1.31 2.99±0.55 Mean of four batches (±) standard deviation.
779 780 781 782 783 784 785 786 787 788 789 790 791 792 793 794 795 796 797 798 799 800 801
Table 4. Changes in bacteria count (log CFU/g) in gills of ungutted sea bass stored in ice. 803
804
Days of storage in ice
Microorganism 0 2 4 7 10 14 18 I Mesophilic 4.98±0.40 6.27±0.31 7.53±0.35 8.75±0.33 9.96±0.38 11.02±0.03 12.11±0.39 Psychrotrophic 3.87±0.35 5.42±0.55 7.08±0.35 8.15±0.57 9.10±0.57 10.10±0.21 11.00±0.14 Enterobacteriaceae 2.57±0.24 3.36±0.31 4.17±0.25 4.74±0.23 5.44±0.17 6.09±0.08 6.87±0.08 Aeromonas sp. 4.17±0.35 5.12±0.16 6.45±0.55 7.70±0.36 9.00±0.39 10.00±0.44 10.98±0.12 Pseudomonas sp. 4.56±0.40 5.77±0.31 7.13±0.41 8.31±0.48 9.67±0.49 10.38±0.45 11.21±0.22 S. putrefaciens 3.18±0.14 4.19±0.1 5.14±0.15 6.23±0.30 7.07±0.36 7.93±0.48 8.92±0.46 II P. phosphoreum <1 <1 0.54±1.08 2.97±0.03 3.33±0.07 3.99±0.15 4.39±0.06 Clostridia <1 <1 <1 <1 1.14±1.33 2.08±1.41 3.00±0.57 Mean of four batches (±) standard deviation.
805 806 807 808 809 810 811 812 813 814 815 816 817 818 819 820 821 822 823 824 825 826 827
Table 5. Mixed model for microbiological growth in sea bass for model (1). 828
Mesophilic Psychrotrophic Pseudomonas sp.
S. putrefaciens Aeromonas sp. Entero-bacteriaceae 0.989 0.975 0.988 0.971 0.968 0.973 gill muscle 2.87 (0.07)** 3.10 (0.11)** 2.70 (0.08)** 1.16 (0.10)** 3.03 (0.13)** 1.18 (0.06)** skinmuscle 2.28 (0.07)** 2.30 (0.11)** 2.15 (0.08)** 0.54 (0.10)** 1.64 (0.13)** 0.80 (0.06)** gillskin 0.58 (0.07)** 0.80 (0.11)** 0.55 (0.08)** 0.62 (0.10)** 1.39 (0.13)** 0.38 (0.06)** 2 1 0.42 (0.10)** 0.37 (0.13)* 0.59 (0.09)** 0.97 (0.12)** 0.58 (0.15)** 0.02 (0.09) 31 0.52 (0.10)** 0.71 (0.13)** 0.58 (0.09)** 0.85 (0.12)** 0.51 (0.15)** -0.12 (0.09) 4 1 0.54 (0.10)** 0.71 (0.13)** 0.53 (0.09)** 0.56 (0.12)** 0.70 (0.15)** 0.06 (0.09) 2 3 -0.10 (0.10) -0.34 (0.13) 0.00 (0.10) 0.12 (0.12) 0.07 (0.15) 0.14 (0.09) 2 4 -0.12 (0.10) -0.33 (0.13) 0.05 (0.10) 0.41 (0.12) -0.12 (0.15) -0.04 (0.09) 34 -0.02 (0.10) 0.006 (0.13) 0.05 (0.10) 0.29 (0.12) -0.19 (0.15) -0.18 (0.09) 0.58 (0.02)** 0.61 (0.03)** 0.59 (0.02)** 0.47 (0.03)** 0.61 (0.03) 0.35 (0.02)** -0.01 (0.001)** -0.01 (0.002)** -0.01 (0.001)** -0.008 (.001)** -0.01 (0.002)** -0.007 (.001)** (*) P < 0.05; (**) P < 0.001; all p-values correspond to multiple linear comparison.
829 830 831 832 833 834 835 836 837 838 839 840 841 842 843 844 1 2
Table 6. Zero-inflated models with its Poisson and logistic parts for Clostridium and P. 845
phosphoreum in sea bass stored in ice.
846
(*) P < 0.05; (**) P < 0.001; all p-values correspond to multiple linear comparison 847 848 849 850 851 852 853 854 855 856 857 858 859 860 861 862 863 864 865 866
Poisson part Logistic part
Clostridium P. phosphoreum Clostridium P. phosphoreum
(slope) 0.215 (0.003)** 0.323 (0.001)** Intercept 7.141 (1.798)** 7.903 (2.384)**
gill muscle -0.493 (0.018)** 1.014 (0.005)** Day -0.7187 (0.182)** -1.090 (0.327)**
skinmuscle -0.246 (0.016)** -0.156 (0.006)** gillskin -0.247 (0.018)** 1.170 (0.006)**
2
1 0.170 (0.023)** 0.536 (0.006)**
3
1 0.332 (0.020)** 0.208 (0.006)**
4
1 0.063 (0.021)* 0.512 (0.006)**
2
3 -0.162 (0.020)** 0.328 (0.006)**
2
4 0.108 (0.021)** 0.023 (0.006)**
3
4 0.269 (0.018)** -0.304 (0.006)**Table 7. Mean values of seawater parameters in the principal tank. 868
Parameters January April June November
Temperature (ºC) 18.2 19.50 22.4 21.8
pH 7.9 8.1 8.1 7.7
Salinity (g/l) 33 35.6 32.2 33.6
BOD5 (mg/l) <5 5.3 <5 <5