A. Cristina Freitas 7 Ana E. Pintado Manuela E. Pintado 7 F. Xavier Malcata
Organic acids produced by lactobacilli, enterococci and yeasts isolated
from Picante cheese
A.C. Freitas 7 A.E. Pintado 7 M.E. Pintado 7 F.X. Malcata (Y) Escola Superior de Biotecnologia, Universidade Católica Portuguesa, Rua Dr. António Bernardino de Almeida, P-4200-072 Porto, Portugal
Abstract Four species of bacteria (Enterococcus
fae-cium and Enterococcus faecalis, Lactobacillus planta-rum and Lactobacillus paracasei) and three species of yeasts (Debaryomyces hansenii, Yarrowia lipolytica and Cryptococcus laurentii), previously isolated from Pi-cante cheese, were cultured in ovine and in caprine milk and assayed for sugar and organic acids metabol-ism for 6 days. The results indicated that both milk types can be coagulated by the four strains of lactic acid bacteria. Lb. paracasei led to a faster and greater reduc-tion in pH. Producreduc-tion of lactic acid correlated to lac-tose degradation, and was highest for Lb. paracasei fol-lowed by E. faecium; citrate metabolism was apparent for E. faecalis and, to a lesser extent, for E. faecium, Lb. plantarum and Lb. paracasei. Relatively high con-tents of formic acid were found when inoculation was with Enterococcus and with Lb. plantarum.
Key words Microflora 7 Ovine milk 7 Caprine milk 7
Glycolysis 7 Organic acids
Introduction
Picante da Beira Baixa cheese (or simply Picante), a traditional cheese manufactured in Portugal from mix-tures of ovine and caprine milk, originates from an Ap-péllation d’Origine Controllée region in Portugal, de-fined in 1988. This variety of cheese, which is character-ised by unique hardness, saltiness and spiciness, is man-ufactured manually, at the farm level only, and ripened for a minimum period of 120 days.
The inconsistency of milk quality and of its microflo-ra, together with the lack of standardised processing, contribute considerably to high variations in physico-chemical and biophysico-chemical cheese characteristics.
Al-though Picante cheese is manufactured in the absence of starter/non-starter cultures, it is well known that the achievement and maintenance of high organoleptic and safety standards for this variety of cheese will eventual-ly require production (and subsequent use) of micro-bial additives based on adventitious microflora. The major families present throughout ripening of Picante cheese are lactic acid bacteria and yeasts [1], with via-ble numbers above 107cfu/g
cheese; the most abundant species of the former are enterococci (Enterococcus faecium, Enterococcus faecalis and Enterococcus du-rans) and lactobacilli (Lactobacillus plantarum and Lactobacillus paracasei), whereas those of the latter are Debaryomyces hansenii and Yarrowia lipolytica [2]. Smaller viable numbers were also reported for Entero-bacteriaceae (which ranged from ca. 107cfu/g
cheese in fresh cheese to less than 102cfu/g
cheese by 80 days of ripening) and staphylococci (from ca. 106cfu/g
cheese in fresh cheese to 104cfu/g
cheese by 180 days of ripening) [1, 2].
A few organic acids (e.g. lactic, propionic, succinic and acetic acids) have been shown to correlate to fla-vour characteristics of such cheeses as Cheddar, Swiss, Emmental, Tilsit and Edam [3]. The purpose of this re-search effort was to investigate the effects of produc-tion of organic acids by lactobacilli, enterococci and yeasts, previously isolated from Picante cheese, on ovine and caprine milk in order to assess their tentative role in glycolysis.
Materials and methods
Preparation of microbial cultures. Dominant species, previously isolated from Picante cheese and identified according to Freitas et al. [2], were used in the present study. Four species of bacteria and three species of yeasts were isolated, namely two Lactobacil-lus strains (Lb. plantarum and Lb. paracasei) and two Enterococ-cus strains (E. faecalis and E. faecium) for the first microbial group, and D. hansenii, C. laurentii and Y. lipolytica for the sec-ond microbial group. Experimental inocula of lactobacilli and en-terococci for milk and curdled milk experiments were obtained after growth for 18 h (which was the average time necessary to
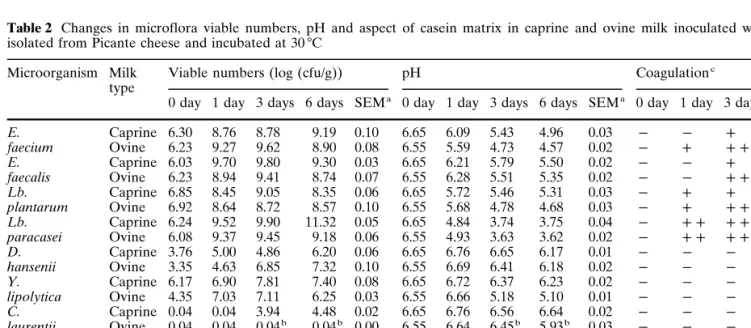
Table 2 Changes in microflora viable numbers, pH and aspect of casein matrix in caprine and ovine milk inoculated with strains
isolated from Picante cheese and incubated at 30 7C
Microorganism Milk Viable numbers (log (cfu/g)) pH Coagulationc
type
0 day 1 day 3 days 6 days SEMa 0 day 1 day 3 days 6 days SEMa 0 day 1 day 3 days 6 days
E. Caprine 6.30 8.76 8.78 9.19 0.10 6.65 6.09 5.43 4.96 0.03 P P c cc faecium Ovine 6.23 9.27 9.62 8.90 0.08 6.55 5.59 4.73 4.57 0.02 P c cc cc E. Caprine 6.03 9.70 9.80 9.30 0.03 6.65 6.21 5.79 5.50 0.02 P P c cc faecalis Ovine 6.23 8.94 9.41 8.74 0.07 6.55 6.28 5.51 5.35 0.02 P P cc cc Lb. Caprine 6.85 8.45 9.05 8.35 0.06 6.65 5.72 5.46 5.31 0.03 P c c cc plantarum Ovine 6.92 8.64 8.72 8.57 0.10 6.55 5.68 4.78 4.68 0.03 P c cc cc Lb. Caprine 6.24 9.52 9.90 11.32 0.05 6.65 4.84 3.74 3.75 0.04 P cc cc cc paracasei Ovine 6.08 9.37 9.45 9.18 0.06 6.55 4.93 3.63 3.62 0.02 P cc cc cc D. Caprine 3.76 5.00 4.86 6.20 0.06 6.65 6.76 6.65 6.17 0.01 P P P P hansenii Ovine 3.35 4.63 6.85 7.32 0.10 6.55 6.69 6.41 6.18 0.02 P P P P Y. Caprine 6.17 6.90 7.81 7.40 0.08 6.65 6.72 6.37 6.23 0.02 P P P P lipolytica Ovine 4.35 7.03 7.11 6.25 0.03 6.55 6.66 5.18 5.10 0.01 P P P P C. Caprine 0.04 0.04 3.94 4.48 0.02 6.65 6.76 6.56 6.64 0.02 P P P P laurentii Ovine 0.04 0.04 0.04b 0.04b 0.00 6.55 6.64 6.45b 5.93b 0.03 P P P P Tentative Caprine 6.65 8.95 8.80 8.88 0.09 6.65 5.93 5.18 4.82 0.02 P c cc cc starter Ovine 6.36 9.17 9.04 9.12 0.09 6.55 5.45 4.78 3.97 0.01 P c cc cc Control Caprine 0 0 0 0 0 6.65 6.52 6.50 6.46 0.02 P P P P Ovine 0 0 0 Pb 0 6.55 6.66 6.40 5.97b 0.01 P P P c
aStandard error of the mean b
Contamination detected
ccc Strong curd, c fine and grainy curd, P no curd
reach the exponential phase) in de Man, Rogosa & Sharpe (MRS) broth (Lab M, Bury, UK) at 30 7C; inocula of yeasts were obtained after growth for 18 h in the case of Y. lipolytica, and for 48 h in the case of D. hansenii and C. laurentii, in Yeast Morpho-logy (YM) broth (Difco, Detroit Mich., USA) at 30 7C. Viable counts were determined for each species after the proper incuba-tion times as detailed.
Preparation of milk feedstocks. Ovine milk from the Frízia breed and caprine milk from the Charnequeira breed were thermally processed at 110 7C for 10 min; this heat treatment does not dam-age the casein micellar structure or the fat globule network [4, 5]. Milk sterility was confirmed as absence of microorganisms on plate count agar (PCA) (Lab M) incubated at 30 7C for 5 days at a 1/10 dilution rate.
Experiments with milk. Milk portions of 40 ml were sterilised in 100 ml flasks using the procedure described. Then, 0.1 ml of each single-strain culture and 0.1 ml of a mixed inoculum were added to the sterilised milk and incubated at 30 7C; the mixed inoculum (denoted hereafter as tentative starter) had been prepared pre-viously with a 2 ml inoculum of E. faecium, a 2 ml inoculum of Lb. plantarum and a 2 ml inoculum of D. hansenii. Sterile milk samples, incubated under identical experimental conditions, were used as controls. Microbiological counts, pH and the type of coa-gulation (strong curd, fine and grainy curd, or no curd at all) were determined at 0, 1, 3 and 6 days of incubation. To check for pos-sible contamination, the microbiological counts were obtained si-multaneously on PCA and on MRS agar for lactic acid bacteria, and on PCA and potato dextrose agar (PDA) for yeasts. Further-more, microscopic observation using Gram staining for bacteria, as well as plain observation for yeasts was carried out; the catal-ase test was also performed for bacteria.
Sugars and organic acids were quantified by HPLC via an ion exchange column using the following separation conditions: the flow rate was 6 ml/min of 5 mM H2SO4 at 60 7C; the injection
vol-ume was 50 ml of sample; and the detection methods were refrac-tive index at 30 7C for sugars and UV detection at 60 7C for or-ganic acids. Samples were prepared according to Macedo and Malcata [6] by precipitation of 5.0 g of sample with 20.0 g of 1.0 M perchloric acid, standing overnight at 4 7C, centrifugation of
Table 1 Composition of caprine and ovine milks
Characteristic Caprine milk Ovine milk
pH (fresh milk) 6.78 6.63
pH (sterilised milk) 6.65 6.55
Total solids (%, w/w) 13.50 16.65 Total protein (%, w/w) 4.03 6.17
Total fat (%, w/w) 4.92 6.02
1.0 ml of supernatant for 15 min at 4000 rpm and filtration through a 0.45 mm membrane filter.
Assessment of statistical significance of results. Analysis of var-iance and Scheffé’s F-test (at the 5% significance level) were car-ried out on the data obtained throughout incubation, for the dif-ferent single strains and types of milk. Linear relationships be-tween organic acids and pH for each strain and type of milk were statistically evaluated. All statistical analyses were performed us-ing the StatView v.4.01 Computer Software (Abacus, Berkeley Calif., USA).
Results and discussion
The compositional characteristics of the caprine and ovine milk used in this set of experiments are tabulated in Table 1. The evolutions of the microflora viable numbers, pH and type of coagulation (if any) in sterile caprine and ovine milk inoculated with each selected strain of bacterium or yeast (and the corresponding controls) are shown in Table 2. It should be emphasised that a slight reduction in pH was observed after sterilis-ation and throughout the 6 days of incubsterilis-ation at 30 7C in the control samples. This can probably be accounted
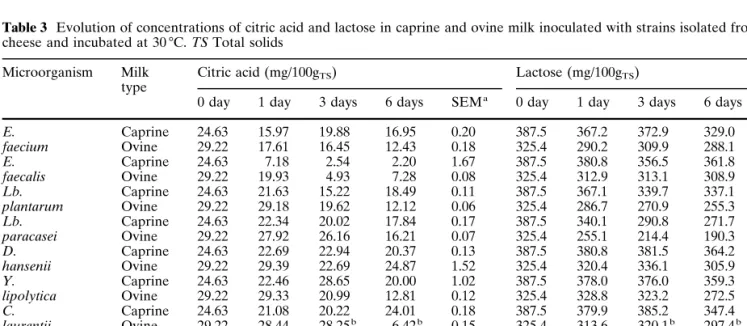
Table 3 Evolution of concentrations of citric acid and lactose in caprine and ovine milk inoculated with strains isolated from Picante
cheese and incubated at 30 7C. TS Total solids
Microorganism Milk Citric acid (mg/100gTS) Lactose (mg/100gTS)
type
0 day 1 day 3 days 6 days SEMa 0 day 1 day 3 days 6 days SEMa
E. Caprine 24.63 15.97 19.88 16.95 0.20 387.5 367.2 372.9 329.0 3.32 faecium Ovine 29.22 17.61 16.45 12.43 0.18 325.4 290.2 309.9 288.1 4.95 E. Caprine 24.63 7.18 2.54 2.20 1.67 387.5 380.8 356.5 361.8 3.92 faecalis Ovine 29.22 19.93 4.93 7.28 0.08 325.4 312.9 313.1 308.9 2.86 Lb. Caprine 24.63 21.63 15.22 18.49 0.11 387.5 367.1 339.7 337.1 2.59 plantarum Ovine 29.22 29.18 19.62 12.12 0.06 325.4 286.7 270.9 255.3 0.98 Lb. Caprine 24.63 22.34 20.02 17.84 0.17 387.5 340.1 290.8 271.7 6.01 paracasei Ovine 29.22 27.92 26.16 16.21 0.07 325.4 255.1 214.4 190.3 2.18 D. Caprine 24.63 22.69 22.94 20.37 0.13 387.5 380.8 381.5 364.2 2.62 hansenii Ovine 29.22 29.39 22.69 24.87 1.52 325.4 320.4 336.1 305.9 6.03 Y. Caprine 24.63 22.46 28.65 20.00 1.02 387.5 378.0 376.0 359.3 5.04 lipolytica Ovine 29.22 29.33 20.99 12.81 0.12 325.4 328.8 323.2 272.5 4.60 C. Caprine 24.63 21.08 20.22 24.01 0.18 387.5 379.9 385.2 347.4 3.60 laurentii Ovine 29.22 28.44 28.25b 6.42b 0.15 325.4 313.6 320.1b 297.4b 0.47 Tentative Caprine 24.63 15.62 11.75 11.73 0.76 387.5 369.2 340.6 296.7 3.29 starter Ovine 29.22 15.97 12.61 12.33 0.04 325.4 278.0 252.6 204.6 0.14 Control Caprine 24.63 20.66 21.76 21.85 0.20 387.5 389.4 401.3 372.6 2.57 Ovine 29.22 25.38 23.38 13.99b 0.61 325.4 328.8 315.5 257.9b 0.87 a
Standard error of the mean b
Contamination detected
for by thermostable enzymes, possibly from Pseudo-monas spp., that were not destroyed by the heat treat-ment used [5], and/or by plasmin action upon b-caseins; although plasmin is inactivated by sterilisation at 120 7C for 15 min [7], the thermal treatment used in our ex-periment (i.e. 110 7C for 10 min) probably did not inac-tivate the enzyme, an argument supported by Driessen and van der Walls [7], who claimed that this enzyme can remain partially active in milk after heat processing at 142 7C for 3 s.
Both milk types were coagulated by the four strains of lactic acid bacteria but, as expected, different behav-iours throughout the incubation time were observed depending on the strain. Lb. paracasei produced a fas-ter and greafas-ter reduction in pH than the other strains, whereas E. faecium and Lb. plantarum produced simi-lar pH values, especially by 3 days and 6 days. Accord-ing to Scheffé’s F-test, significant differences in terms of pH were found between the actions of E. faecium and E. faecalis, but not between those of E. faecium and Lb. plantarum. Lb. paracasei was responsible for a lower pH value than Lb. plantarum, which is in agree-ment with results presented by Macedo and Malcata [5] in a somewhat similar experiment. The tentative starter (composed of E. faecium, Lb. plantarum and D. hanse-nii) showed statistically significant differences when compared to each of the aforementioned strains inde-pendently, suggesting synergisms between these strains. In terms of pH in milk inoculated with yeasts, varia-tions with time were slight except for contaminated samples (which are obviously of no value); ovine milk inoculated with C. laurentii was already contaminated by 3 days and 6 days of incubation.
Tables 3–5 depict the concentrations of sugars and organic acids produced (or degraded) by the microbial
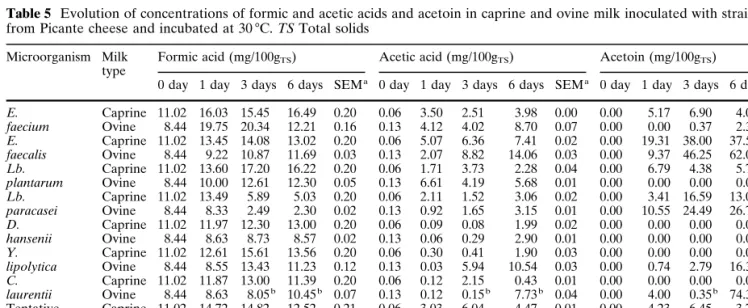
strains tested; distinct profiles between strains and be-tween caprine and ovine milks are apparent. Lactose content was higher in caprine than in ovine milk; lac-tose was actually metabolised by all bacterial strains, as concluded from the statistically significant value of Scheffé’s F-test. Production of lactic acid, as expected, correlated negatively to lactose degradation and was, in general, highest for Lb. paracasei followed by E. fae-cium. Production of lactic acid by the tentative starter and by E. faecium were similar but differed from pro-duction by Lb. plantarum when considered indepen-dently, thus suggesting a greater contribution of E. fae-cium to the pH reduction; this fact was more evident in the experiment with caprine milk. The existence of ci-trate metabolism is apparent from inspection of the data obtained from E. faecalis; lower rates of metabol-ism were recorded for E. faecium, Lb. plantarum and Lb. paracasei, and according to Scheffé’s F-test, no sta-tistically significant difference was found between Lb. paracasei and the control. In terms of yeasts, low rates of citrate metabolism were observed for D. hansenii and for Y. lipolytica; Roostita and Fleet [8] reported strong and weak utilisation of citric acid by Candida li-polytica and D. hansenii, respectively. Citrate utilisa-tion appears to be a widespread feature among lactoba-cilli;. Fryer [9] reported that 19 out of 25 strains of Lb. casei, Lb. plantarum and Lb. brevis utilise citrate in the presence of a fermentable carbohydrate. According to the same author, several species of mesophilic lactoba-cilli metabolise citrate with concomitant production of diacetyl and formic acids; Fox et al. [10] have further reported that the presence of lactose influences the amount of formic acid formed. Relatively high contents of formic acid were found for both Enterococcus strains, for Lb. plantarum and for Y. lipolytica. Lb.
pa-Table 4 Evolution of concentrations of succinic and lactic acids in caprine and ovine milk inoculated with strains isolated from Picante
cheese and incubated at 30 7C. TS Total solids
Microorganism Milk Succinic acid (mg/100gTS) Lactic acid (mg/100gTS)
type
0 day 1 day 3 days 6 days SEMa
0 day 1 day 3 days 6 days SEMa
E. Caprine 16.02 0.00 0.00 1.26 0.34 0.00 9.49 17.32 36.86 0.07 faecium Ovine 8.52 0.00 0.57 3.99 0.02 1.04 22.80 47.75 51.82 0.54 E. Caprine 16.02 12.55 3.32 19.90 0.13 0.00 1.54 4.43 11.58 0.04 faecalis Ovine 8.52 18.33 2.32 7.34 0.06 1.04 1.32 4.77 10.29 0.01 Lb. Caprine 16.02 0.00 0.79 1.95 0.14 0.00 12.25 22.12 20.32 0.08 plantarum Ovine 8.52 0.00 0.00 0.00 0.05 1.04 15.46 41.69 43.82 0.12 Lb. Caprine 16.02 24.45 23.93 24.02 0.64 0.00 40.82 92.21 88.93 0.14 paracasei Ovine 8.52 22.29 29.93 26.18 0.56 1.04 42.11 99.86 102.35 0.16 D. Caprine 16.02 16.60 16.79 19.42 1.19 0.00 0.64 0.62 0.66 0.00 hansenii Ovine 8.52 8.61 9.05 7.29 0.02 1.04 1.14 1.39 1.31 0.01 Y. Caprine 16.02 13.71 11.91 19.20 0.12 0.00 0.00 0.63 0.00 0.00 lipolytica Ovine 8.52 4.34 8.20 13.15 0.04 1.04 0.00 11.22 0.00 0.07 C. Caprine 16.02 16.29 19.87 16.15 0.17 0.00 0.65 0.62 1.01 0.00 laurentii Ovine 8.52 7.93 0.09b 2.68b 0.11 1.04 1.32 1.10b 6.00b 0.11 Tentative Caprine 16.02 0.00 0.00 0.00 0.12 0.00 13.36 26.57 35.13 0.16 starter Ovine 8.52 0.00 0.00 0.00 0.02 1.04 29.23 43.71 81.75 0.55 Control Caprine 16.02 19.58 20.04 19.08 0.20 0.00 0.65 0.00 0.00 0.00 Ovine 8.52 7.47 9.40 2.56b 0.09 1.04 2.73 0.00 5.41b 0.05
a Standard error of the mean b Contamination detected
Table 5 Evolution of concentrations of formic and acetic acids and acetoin in caprine and ovine milk inoculated with strains isolated
from Picante cheese and incubated at 30 7C. TS Total solids
Microorganism Milk Formic acid (mg/100gTS) Acetic acid (mg/100gTS) Acetoin (mg/100gTS)
type
0 day 1 day 3 days 6 days SEMa 0 day 1 day 3 days 6 days SEMa 0 day 1 day 3 days 6 days SEMa
E. Caprine 11.02 16.03 15.45 16.49 0.20 0.06 3.50 2.51 3.98 0.00 0.00 5.17 6.90 4.00 0.06 faecium Ovine 8.44 19.75 20.34 12.21 0.16 0.13 4.12 4.02 8.70 0.07 0.00 0.00 0.37 2.34 0.08 E. Caprine 11.02 13.45 14.08 13.02 0.20 0.06 5.07 6.36 7.41 0.02 0.00 19.31 38.00 37.52 0.11 faecalis Ovine 8.44 9.22 10.87 11.69 0.03 0.13 2.07 8.82 14.06 0.03 0.00 9.37 46.25 62.07 0.05 Lb. Caprine 11.02 13.60 17.20 16.22 0.20 0.06 1.71 3.73 2.28 0.04 0.00 6.79 4.38 5.73 0.02 plantarum Ovine 8.44 10.00 12.61 12.30 0.05 0.13 6.61 4.19 5.68 0.01 0.00 0.00 0.00 0.00 0.00 Lb. Caprine 11.02 13.49 5.89 5.03 0.20 0.06 2.11 1.52 3.06 0.02 0.00 3.41 16.59 13.03 0.08 paracasei Ovine 8.44 8.33 2.49 2.30 0.02 0.13 0.92 1.65 3.15 0.01 0.00 10.55 24.49 26.71 0.23 D. Caprine 11.02 11.97 12.30 13.00 0.20 0.06 0.09 0.08 1.99 0.02 0.00 0.00 0.00 0.00 0.00 hansenii Ovine 8.44 8.63 8.73 8.57 0.02 0.13 0.06 0.29 2.90 0.01 0.00 0.00 0.00 0.00 0.00 Y. Caprine 11.02 12.61 15.61 13.56 0.20 0.06 0.30 0.41 1.90 0.03 0.00 0.00 0.00 0.00 0.00 lipolytica Ovine 8.44 8.55 13.43 11.23 0.12 0.13 0.03 5.94 10.54 0.03 0.00 0.74 2.79 16.35 0.26 C. Caprine 11.02 11.87 13.00 11.39 0.20 0.06 0.12 2.15 0.43 0.01 0.00 0.00 0.00 0.00 0.00 laurentii Ovine 8.44 8.63 8.05b 10.45b 0.07 0.13 0.12 0.15b 7.73b 0.04 0.00 4.00 0.35b 74.33b 0.10 Tentative Caprine 11.02 14.72 14.82 12.52 0.21 0.06 3.03 6.04 4.47 0.01 0.00 4.23 6.45 3.77 0.04 starter Ovine 8.44 11.16 8.94 3.31 0.10 0.13 4.26 4.45 8.38 0.04 0.00 0.04 1.07 0.00 0.13 Control Caprine 11.02 12.95 13.69 11.54 0.21 0.06 2.24 1.60 0.23 0.09 0.00 0.00 0.00 0.00 0.00 Ovine 8.44 7.93 7.90 3.58b 0.14 0.13 0.20 0.07 5.25b 0.01 0.00 0.00 0.00 7.53b 0.02 a
Standard error of the mean b
Contamination detected
racasei led to the lowest concentrations of formic acid, which correlated to the lowest levels of lactose. The tentative starter generated lower values of this acid than did the two strains of lactic acid bacteria included in its formulation.
Production of succinic acid was clearly detected for Lb. paracasei but was not so clear for E. faecalis, whereas degradation occurred in milk incubated with E. faecium and Lb. plantarum strains, as well as in milk incubated with the tentative starter. Ocando et al. [11] reported that succinic acid was produced to some
ex-tent by strains of Lb. brevis, Lb. lactis and E. faecalis in sterile skimmed milk. Production of acetic acid and ace-toin was measured for the Enterococcus and Lactoba-cillus strains tested, but the source of these organic acids can vary; Ocando et al. [11] suggested that a sub-strate other than lactose was actually used, and the pos-sibility that acetic acid was formed from amino acids was not completely ruled out, whilst Nakae and Elliot [12] reported that some lactobacilli can actively pro-duce acetic acid from alanine, glycine and serine, but Fryer et al. [13] claimed that this organic acid may be a
product of glycolysis. In addition to acetic acid, acetoin [14] is produced via citrate metabolism by lactobacilli, although both these products are among those that can derive from lactose metabolism [15]. Among the lactic acid bacteria tested, Lb. paracasei and E. faecalis are undoubtedly the strongest producers of acetoin.
Acid production is an important phenomenon asso-ciated with cheese manufacture and ripening, and hence with final cheese composition and quality [10]. Good linear correlations between pH and total acid de-velopment were found (r 1 0.90), with exception of E. faecium in caprine milk (rp0.89) and tentative starter in ovine milk (rp0.85). Very good correlations (r 1 0.95) in both types of milk for individual com-pounds and pH were found in milk samples for lactic acid versus pH for E. faecium, Lb. plantarum, Lb. para-casei and tentative starter; for citric acid versus pH and acetic acid versus pH for E. faecalis; for acetoin versus pH for E. faecalis and Lb. paracasei; and for succinic acid versus pH and formic acid versus pH for Lb. plan-tarum.
Conclusions
Among the lactic acid bacteria studied, Lb. paracasei was the dominant producer of lactic acid, so in terms of glycolysis it should be considered as the most suitable strain to be part of a starter tailored for Picante cheese. Although conclusions about the final pH of cheese should be drawn carefully when based upon acid pro-duction in milk, because sugars become more limited in cheese, strains of enterococci and Lb. plantarum gave rise to pH values most similar to Picante cheese, which is characterised by values of ca. 5 at the early stages of ripening [16].
The existence of citrate metabolism by E. faecalis and, at lesser rates, by E. faecium, L. plantarum and L. paracasei points at the importance of this phenomenon in Picante cheese production as these strains, especially the enterococci, are present in Picante cheese through-out the whole ripening period [2].
Acknowledgements The authors are grateful to the members of
the technical board of the Governmental Directorate of Agricul-ture for the Region of Beira Interior (DRABI, Portugal) for their cooperation in supervising the milk collection and in transporting the milk to the ESB premises for analysis. Financial support for author A.C.F. was provided by Ph.D. fellowships, BD/2111/92-IF and BD/5364/95-IF, under the auspices of programs CIENCIA and PRAXIS XXI, respectively (administered by JNICT and FCT, Portugal). Partial financial support for the research program was provided by project PROTOLACTIS: PROdução, por Tec-nologias Optimizadas, de LACticínios TradicionaIS, administered by PAMAF (INIA, Portugal).
References
1. Freitas AC, Sousa M, Malcata FX (1995) Ital J Food Sci 7 : 361–377
2. Freitas AC, Pais C, Malcata FX, Hogg TA (1996) J Food Prot 59 : 155–160
3. Lansgrud R, Reinbold G (1973) J Milk Food Technol 36 : 593–609
4. Gomes AMP, Malcata FX (1998) J Appl Microbiol 85 : 839–848
5. Macedo AC, Malcata FX (1997) Z Lebensm Unters Forsch A 205 : 25–30
6. Macedo AC, Malcata FX (1996) Z Lebensm Unters Forsch A 74 : 409–415
7. Driessen FM, van der Walls CB (1978) Neth Milk Dairy J 32 : 245–251
8. Roostita R, Fleet GH (1996) Int J Food Microbiol 31 : 205–219
9. Fryer TF (1970) J Dairy Res 37 : 9–15
10. Fox PF, Lucey JA, Cogan TM (1990) Food Sci Nutr 29 : 237–252
11. Ocando AF, Granados A, Basanta Y, Gutierrez B, Cabrera L (1993) Food Microbiol 10 : 1–7
12. Nakae T, Elliot JA (1965) J Dairy Sci 48 : 287–292
13. Fryer TF, Sharpe ME, Reiter B (1970) J Dairy Res 37 : 17–28
14. El-Gendy SM, Abdel-Galil H, Shahim Y, Hegazi FZ (1983) J Milk Food Technol 35 : 242–244
15. Fryer TF (1969) Dairy Sci Abstr 31 : 471–490
16. Freitas AC, Fresno JB, Prieto B, Malcata FX, Carballo FJ (1997) Food Chem 2 : 219–229