280
ABSTRACT: Objective: To investigate whether social relations, sociodemographic characteristics, lifestyle, and health conditions are associated with health-related quality of life (HRQOL) among elderly persons living in regions classiied as high vulnerable in terms of health. Methods: A cross-sectional study conducted with a population-based random sample of 366 elderly (≥ 60 years of age) persons registered at a primary health-care unit in Belo Horizonte, Minas Gerais, Brazil. HRQOL was measured using the Medical Outcomes Study 12-Item Short-Form Health Survey (SF-12) and the scores obtained in the physical component score (PCS) and mental component score (MCS) were our response variables. Social relations, sociodemographic characteristics, lifestyle, and health conditions were considered our groups of explanatory variables. Multiple linear regression models were used for the analysis. Results: In the inal multivariate models, we found that elevated number of diagnosis of chronic diseases, and being bedridden for the last 15 days were variables associated with worse PCS and MCS. However, lack of education, dissatisfaction with personal relationships, lack of support and help when bedridden or to go to the doctor, and to prepare meals were associated with worse HRQOL only in MCS. Participants who reported black race/color, absence of work activity, lack of physical activity, no alcohol consumption, and hospitalization in the last 12 months had worse HRQOL only in PCS. Conclusion: In addition to the aspects related to social adversity, lifestyle, and health conditions, some functional aspects of social relations were important for understanding the HRQOL in elderly persons living in social vulnerability. Keywords: Quality of life. Elderly. Aging. Cross-sectional studies. Social networking. Interpersonal relationships.
Health related quality of life among elderly
living in region of high vulnerability for health
in Belo Horizonte, Minas Gerais, Brazil
Qualidade de vida relacionada à saúde em idosos residentes em região de
alta vulnerabilidade para saúde de Belo Horizonte, Minas Gerais
Lidyane do Valle CameloI, Luana GiattiI,II, Sandhi Maria BarretoI
ORIGINAL ARTICLE / ARTIGO ORIGINAL
IGraduate Program in Public Health, School of Medicine, Universidade Federal de Minas Gerais – Belo Horizonte (MG), Brazil. IISchool of Nutrition, Universidade Federal de Ouro Preto – Ouro Preto (MG), Brazil
Corresponding author: Lidyane do Valle Camelo. Graduate Program in Public Health, School of Medicine, Universidade Federal de Minas Gerais. Avenida Professor Alfredo Balena, 190, Santa Eigênia, Zip Code: 30130‑100, Belo Horizonte, MG, Brazil. E‑mail: [email protected]
INTRODUCTION
The share of the population aged 60 years and older increased from 4.3% in 1950 to 13.0% in 2013. In the same period, life expectancy rose from 45.5 to 74.8 years1,2. As a result of this rapid population aging and increased life expectancy, the Brazilian population has faced a significant increase in the prevalence of chronic noncommu-nicable diseases and disabilities3. In this regard, it becomes increasingly important to ensure that the increased longevity of the population is also accompanied by a bet-ter quality of life.
Quality of life is a subjective and multidimensional construct that encompasses the perception and understanding of reality and incorporates satisfaction at areas of life that people value4,5. It is an individual construct associated with the degree of expectation, culture, and personality4,5. Overall, quality of life is related to self-esteem and personal well-being and, therefore, tends to be inluenced by several aspects such as health and socioeconomic status, lifestyle, social interaction, family support, and satisfaction with life6. Some authors consider that the functional aspect is the major determinant of qual-ity of life, because the health status inluences the adequate performance in functions considered of great importance by the individuals4,5. Thus, the concept of “health-related quality of life (HRQOL)” was created to incorporate this appreciation of health status as a determinant of quality of life4,5.
RESUMO: Objetivo: Investigar se as relações sociais, juntamente com características sociodemográicas, hábitos de vida e condições de saúde estão associados à qualidade de vida relacionada à saúde (QVRS) em idosos residentes em região considerada de alta vulnerabilidade para a saúde. Métodos: Estudo transversal realizado com amostra aleatória de 366 idosos (≥ 60 anos) adscritos a um centro de saúde de Belo Horizonte, Minas Gerais. A QVRS foi aferida pelo Medical Outcomes Study 12-Item Short-Form Health Survey (SF-12) e os escores obtidos nos componentes físico (PCS) e mental (MCS) foram utilizados como variáveis resposta. As variáveis explicativas foram divididas em quatro blocos: sociodemográico, relações sociais, hábitos de vida e condições de saúde. Modelos de regressão linear múltipla foram utilizados. Resultados: Nos modelos multivariados inais, encontramos que elevado número de diagnósticos de doenças crônicas e ter estado acamado nos últimos 15 dias foram variáveis associadas à pior QVRS no domínio físico e mental. Entretanto, ausência de escolaridade, insatisfação com relacionamentos pessoais e não ter sempre que necessário o apoio de alguém para ajudar a icar de cama, ir ao médico e preparar refeições foi associado à pior QVRS apenas no MCS. Ter declarado cor da pele preta, ausência de atividade de trabalho, não praticar atividade física, não consumir álcool e internação nos últimos 12 meses estiveram associados à pior QVRS apenas no PCS. Conclusão: Além da adversidade social, hábitos de vida e condições de saúde, alguns aspectos funcionais das relações sociais foram importantes para compreensão da QVRS em idosos em vulnerabilidade social.
282
The HRQOL is a strong prognostic indicator of mortality among elderly persons7, and previous studies conducted in Brazil found that the social adversity8,9, lifestyle (such as regular physical activity, alcohol consumption, and smoking)8,10, and current health conditions8,11,12 are important factors to understand the HRQOL in the elderly persons. Studies in other countries have reported similar results13,15, but, in the international context, the fragility of social relationships has also been identiied as a factor associated with worse HRQOL16,17.
Social relationships can be deined as the degree to which individuals are connected and integrated into comunities18, and, according to Due et al.19, it has two dimensions: the structural and functional aspects. The structure of social relations corresponds to formal and informal relationships (social network) and is usually analyzed by the number of social relationships that an individual maintains, the frequency at which individuals contact peo-ple from their social network, and diversity and reciprocity of these relationships. On the other hand, the functional aspect relates to qualitative and behavioral factors of social rela-tionships and encompasses the social support, social anchorage (including engagement and social integration), and relational stress (a negative dimension of social relations)19.
Several health conditions that have an impact on functionality, such as cognitive decline20, dementia21, depression22, limitation23, and functional decline24 have been associated with structural and functional aspects of social relations in the elderly persons, which may partly explain the link between these aspects and HRQOL. Despite these indings, the association between social relationships and physical and mental components of HRQOL has been poorly explored in Brazil, especially among elderly persons at low socioeconomic status, who tend to have higher social isolation20,24. In this context, the aim of this study was to investigate whether social relationships along with sociodemographic characteristics, life-style habits, and health conditions are associated with HRQOL in elderly people living in the region of Belo Horizonte, Minas Gerais, considered highly vulnerable to health conditions.
METHODS
VARIABLES OF THE STUDY
RESPONSE VARIABLES
The HRQOL was assessed by the Medical Outcomes Study 12-Item Short-Form Health Survey (SF-12)26. The SF-12 is composed of 12 items, and their answers were aggregated into two summary measures: the physical component score(PCS) and the mental component score(MCS)26. The PCS considers the individual’s perception of their functional capability, physical aspects, pain, and general health condition. On the other hand, the MCS considers aspects related to vitality, social functioning, emotional aspects, and mental health. Both sum-mary components vary from 0 to 100 and higher values relect better HRQOL26. The scores on the PCS and MCS were considered separately as response variables of this study.
EXPLANATORY VARIABLES
The explanatory variables were organized into four groups: sociodemographic, social relations, lifestyle, and health conditions. Details on the categorization and deinition of these variables can be seen in Table 1.
The sociodemographic group was composed of the following variables: gender, age, self-reported skin color, educational level, family income, and presence of work activi-ties in the week prior to the interview. The social relations group contemplated variables to measure structural and functional aspects of social relations21. The structural aspects were investigated by the following variables: marital status, living alone, necessity of the elderly being alone most part of the day, and number of relatives and friends with whom the elderly people could talk about almost anything. The functional aspects were studied by the variables: always having the support needed to help staying in bed, to go to the doctor, and to prepare meals; participation of the elderly persons in recreational activities; and sat-isfaction of the elderly people with personal relationships. The lifestyle group contained the following variables: regular practice of physical activity during leisure time, smoking, reg-ular consumption of fruits and/or vegetables, and consumption of any alcoholic beverage in the last 30 days. In the health conditions group, the following variables were considered: the number of self-reported chronic diseases diagnosed by a physician, number of medi-cal consultations and hospitalization in the last 12 months, and if the participant has been bedridden for the last 15 days.
DATA ANALYSIS
284
Variables n (%) PCS MCS
β (95%CI)a β (95%CI)a
Sociodemographic
Gender
Male 147 (40.2) Ref Ref
Female 219 (59.8) -3.10 (-5.09; -1.10)** -3.95 (-6.28; -1.62)** Age (in years)
60 – 64 128 (35.0) Ref Ref
65 – 69 93 (25.4) -2.08 (-4.65; 0.48) -1.26 (-4.26; 1.73)
≥ 70 145 (39.6) -2.69 (-4.97; -0.41)* -3.65 (-6.32; -0.98)**
Self-reported skin color
White 102 (27.9) Ref Ref
Brown 192 (52.5) -2.13 (-4.43; 0.17) -0.17 (-2.89; 2.54)
Black 58 (15.9) -4.72 (-7.81; -1.64)** -2.96 (-6.60; 0.69)
Others 14 (3.8) -3.49 (-8.83; 1.86) -0.89 (-7.20; 5.43)
Schooling (in years)
≥ 4 124 (33.9) Ref Ref
1 – 3 112 (30.6) -3.59 (-6.02; -1.17)** -3.29 (-6.15; -0.42)* 0 130 (35.5) -4.19 (-6.53; -1.85)*** -3.80 (-6.56; -1.04)**
Monthly family income (in minimum wage)
≥ 4 66 (18.0) Ref Ref
1 – 3 158 (43.2) -2.97 (-5.72; -0.21)* -1.00 (-4.25; 2.24) Up to 1 142 (38.8) -3.30 (-6.10; -0.50)* -2.55 (-5.85; 0.75)
Labor activity in the week prior to the interview
Yes 113 (30.9) Ref Ref
No 253 (69.1) -3.86 (-5.97; -1.75)*** -3.49 (-5.97; -1.00)**
Social relations
Marital status
Married 159 (43.4) Ref Ref
Not married 207 (56.6) -0.90 (-2.89; 1.10) -0.44 (-2.78; 1.90)
Living alone
No 336 (92.3) Ref Ref
Yes 28 (7.7) 0.38 (-3.35; 4.10) -0.72 (-5.08; 3.64)
Staying alone in most part of the day
Never/rarely/sometimes 260 (71.4) Ref Ref
Almost always/always 104 (28.6) -1.88 (-4.07; 0.31) -1.81 (-4.37; 0.76)
Number of relatives with whom the elderly persons could talk about almost everythingb
≥ 5 131 (36.0) Ref Ref
2 – 4 118 (32.4) -1.52 (-3.92; 0.88) -0.27 (-3.09; 2.54) 0 – 1 115 (31.6) -1.65 (-4.07; 0.76) -0.93 (-3.76; 1.90)
Number of friends with whom the elderly persons could talk about almost everythingb
≥ 4 131 (36.0) Ref Ref
1 – 3 126 (34.6) 0.17 (-2.20; 2.53) -0.45 (-3.22; 2.31) 0 107 (29.4) -0.20 (-2.67; 2.27) -1.49 (-4.37; 1.40)
Always having the support needed to help staying in bed, to go to the doctor and to prepare meals
Yes 232 (63.9) Ref Ref
No 131 (36.1) -0.31 (-2.38; 1.75) -3.21 (-5.61; -0.81)**
Table 1. Characteristics of population of elderly participants and univariate analysis. Belo Horizonte,
Minas Gerais, 2007 (n = 366).
Variables n (%) PCS MCS β (95%CI)a β (95%CI)a
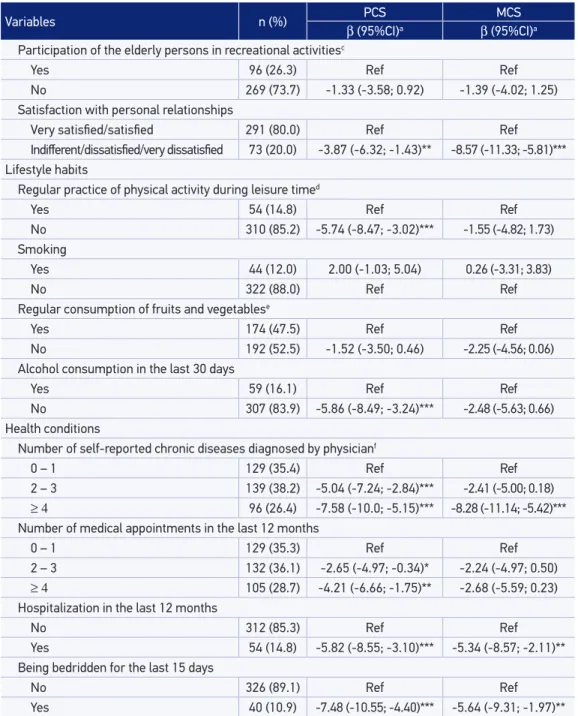
Participation of the elderly persons in recreational activitiesc
Yes 96 (26.3) Ref Ref
No 269 (73.7) -1.33 (-3.58; 0.92) -1.39 (-4.02; 1.25)
Satisfaction with personal relationships
Very satisied/satisied 291 (80.0) Ref Ref
Indiferent/dissatisied/very dissatisied 73 (20.0) -3.87 (-6.32; -1.43)** -8.57 (-11.33; -5.81)***
Lifestyle habits
Regular practice of physical activity during leisure timed
Yes 54 (14.8) Ref Ref
No 310 (85.2) -5.74 (-8.47; -3.02)*** -1.55 (-4.82; 1.73)
Smoking
Yes 44 (12.0) 2.00 (-1.03; 5.04) 0.26 (-3.31; 3.83)
No 322 (88.0) Ref Ref
Regular consumption of fruits and vegetablese
Yes 174 (47.5) Ref Ref
No 192 (52.5) -1.52 (-3.50; 0.46) -2.25 (-4.56; 0.06)
Alcohol consumption in the last 30 days
Yes 59 (16.1) Ref Ref
No 307 (83.9) -5.86 (-8.49; -3.24)*** -2.48 (-5.63; 0.66)
Health conditions
Number of self-reported chronic diseases diagnosed by physicianf
0 – 1 129 (35.4) Ref Ref
2 – 3 139 (38.2) -5.04 (-7.24; -2.84)*** -2.41 (-5.00; 0.18)
≥ 4 96 (26.4) -7.58 (-10.0; -5.15)*** -8.28 (-11.14; -5.42)***
Number of medical appointments in the last 12 months
0 – 1 129 (35.3) Ref Ref
2 – 3 132 (36.1) -2.65 (-4.97; -0.34)* -2.24 (-4.97; 0.50)
≥ 4 105 (28.7) -4.21 (-6.66; -1.75)** -2.68 (-5.59; 0.23)
Hospitalization in the last 12 months
No 312 (85.3) Ref Ref
Yes 54 (14.8) -5.82 (-8.55; -3.10)*** -5.34 (-8.57; -2.11)**
Being bedridden for the last 15 days
No 326 (89.1) Ref Ref
Yes 40 (10.9) -7.48 (-10.55; -4.40)*** -5.64 (-9.31; -1.97)**
PCS: physical component score; MCS: mental component score; 95%CI: 95% conidence interval; athe regression beta
coeicients represent the diference in average scores of physical component score and mental component score
according to each category of explanatory variables; *p <0.05; **p <0.01; ***p <0.001; bvariables categorized using the
tertile of the distribution of numbers of friends and relatives cited by the participants; cparticipation in recreational
activity was deined as participation in recreational or artistic group activities (musical group, choir, art, etc.) or any
other type of association (community, religious, etc.) for at least once a week in the last 12 months; dregular physical
activity was deined by the report of physical activities during leisure time for at least three times a week for more than 30 minutes; eregular consumption of fruits and/or vegetables was deined as the consumption of these foods on 5 or
more days a week; fthe evaluated diseases were: spine disease or back pain, arthritis or rheumatism, cancer, diabetes,
bronchitis or asthma, hypertension, heart disease, chronic kidney failure, depression, and tendinitis or tenosynovitis.
286
between the explanatory variables and the two components of HRQOL (PCS and MCS) was investigated using linear regression in two different models, one for each dependent variable. We conducted multivariate analyzes for each of the four groups of explanatory variables, including all variables associated with the 20% significance level in the univariate analysis. Subsequently, the explanatory variables associated with the response variables in the multivariate models by groups were entered simultaneously in the multivariate model to compose the final model. We used the backward elimi-nation procedure, and the variables retained in the multivariate models by groups and those retained in the final models were the variables that remain associated with the response variables to a 5% significance level.
The regression beta coeicients and their respective 95% conidence intervals (95% CI) were reported, and they represent the diferences in the mean scores on both PCS and MCS, according to the explanatory variables considered in the models. The normality of the resid-uals and homoscedasticity were checked graphically. Analyses were performed using Stata 13.
RESULTS
Among the 405 elderly persons who were part of the sample, 373 individuals agreed to participate in the study, and 366 answered the SF-12 and, hence, were included in this analy-sis. Sociodemographic characteristics, social relations, health conditions, and the prevalence of lifestyle among the elderly participants can be seen in Table 1. Participants were aged between 60 and 94 years (mean 69.2 ± 7.5 years), and most elderly persons were female subjects (59.8%), self-reported brown skin color (52.5%), had less than 4 years of school-ing (66.1%), and reported havschool-ing family income lower than four minimum wages (82%).
The PCS and MCS scores obtained an average of 42.8 (± 9.62) and 45.1 (± 11.27), respec-tively. In the univariate analysis, the worst HRQOL in the physical component was associated with the following characteristics: female gender, 70 years or older, self-reported black skin color, less than 4 years of schooling, family income lower than four minimum wages, absence of labor activity in the week prior to the survey, not satisied with personal relationships, no physical activity during leisure time, no alcohol consumption in the last 30 days, diagnosis of two or more chronic diseases, two or more medical appointments in the last 12 months, hospitalization in the last 12 months, and being bedridden for the last 15 days (Table 1). In the inal multivariate model, the worst HRQOL in the physical component remained associated with self-reported black skin, absence of labor activity in the week prior to the survey, no physical activity during leisure time, no alcohol consumption in the last 30 days, diagnosis of two or more chronic diseases, hospitalization in the last 12 months, and being bedridden for the last 15 days (Table 2). The variables retained in the inal model explained 23% of the variability in the scores of the PCS (Table 2).
Variables β (95%CI)a
Sociodemographic
Self-reported skin color
White Ref
Brown -1.65 (-3.70; 0.40)
Black -3.80 (-6.54; -1.06)**
Others -2.04 (-6.80; 2.71)
Labor activity
Yes Ref
No -2.42 (-4.35; -0.48)*
Lifestyle habits
Regular physical activity
Yes Ref
No -4.28 (-6.79; -1.77)**
Alcohol consumption in the last 30 days
Yes Ref
No -4.15 (-6.57; -1.74)**
Health conditions
Number of physician diagnoses of chronic diseases
0 – 1 Ref
2 – 3 -4.16 (-6.20; -2.11)***
≥ 4 -5.68 (-7.99; -3.37)***
Hospitalization in the last 12 months
No Ref
Yes -3.01 (-5.59; -0.44)*
Being bedridden for the last 15 days
No Ref
Yes -5.22 (-8.06; -2.38)**
Adjusted R-squared 0.23
Table 2. Variables associated with physical component score in the inal multivariate model. Belo Horizonte, Minas Gerais, 2007.
95%CI: 95% conidence interval; athe regression beta coeicients represent the diference in the scores of physical
288
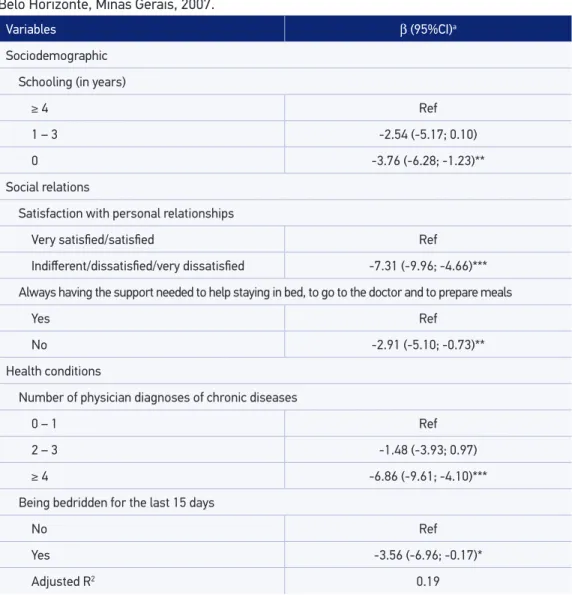
Variables β (95%CI)a
Sociodemographic
Schooling (in years)
≥ 4 Ref
1 – 3 -2.54 (-5.17; 0.10)
0 -3.76 (-6.28; -1.23)**
Social relations
Satisfaction with personal relationships
Very satisied/satisied Ref
Indiferent/dissatisied/very dissatisied -7.31 (-9.96; -4.66)***
Always having the support needed to help staying in bed, to go to the doctor and to prepare meals
Yes Ref
No -2.91 (-5.10; -0.73)**
Health conditions
Number of physician diagnoses of chronic diseases
0 – 1 Ref
2 – 3 -1.48 (-3.93; 0.97)
≥ 4 -6.86 (-9.61; -4.10)***
Being bedridden for the last 15 days
No Ref
Yes -3.56 (-6.96; -0.17)*
Adjusted R2 0.19
95%CI: 95% conidence interval; athe regression beta coeicients represent the diference in the scores of physical component
score and mental component score according to each category of explanatory variables; *p < 0.05; **p < 0.01; ***p < 0.001. Table 3. Variables associated with mental component score in the inal multivariate model. Belo Horizonte, Minas Gerais, 2007.
DISCUSSION
This work demonstrated that the physical and mental components of HRQOL were associated with social characteristics and health conditions. We found no association between the structural aspects of social relations and HRQOL, but some functional aspects were independently associated with MCS. In addition, we found that lifestyle, such as regular physical activity and alcohol consumption, was associated with HRQOL only in the physical component. Our results show once again the multidimensional aspect of HRQOL and the challenge in understanding the factors that explain this con-struct, given that the variables that remained associated with the physical and mental components in the final model explained only 23 and 19% of the variability of PCS and MCS, respectively.
The participants of this study had a higher exposure to social adversity (lower levels of income and education) than elderly people living in the metropolitan region of Belo Horizonte27. In addition, the elderly participants of this study lived in an area in which environmental, social, and health indicators relect a high-risk for health. Because of these characteristics, we expected that the average scores found in the physical and mental components of HRQOL in this study were lower than the averages found in the elderly population in general in the country. This hypothesis was conirmed only in the physical component of HRQOL, as the average PCS of this study was lower than that observed in a population-based study conducted in the state of São Paulo (42.8 versus 47.6). However, the mean MCS found in these two studies were similar (45.1 in Belo Horizonte versus 44.6 in São Paulo)10.
Elderly people with no education had a poorer HRQOL in the mental component. In addition, self-declared black skin and absence of labor activity during the week prior to the survey were also characteristics independently associated with lower scores on the PCS. These results suggest that the more exposed to social adversity elderly people are, the worse the HRQOL. This result is consistent with indings from previous studies8,9,13,17. The socioeco-nomic status is a distal determinant of health and acts as a starting point, which can result in diferent exposure and vulnerability to risk factors related to various health outcomes28 that may impact on HRQOL. It is important to emphasize that the associations found in this study were independent from variables of health conditions, showing that the associ-ation widely established between the occurrence of chronic diseases and socioeconomic disadvantage28 not fully explained the relationship between social adversity and HRQOL. Thus, it is possible that the stress resulting from exposure to adverse social conditions and discrimination experiences can also be important aspects to explain the association between social adversity and HRQOL29.
290
adverse social contexts, characterized by lack of easy access to services in the neigh-borhood (i.e.: places for shopping, public transportation, banks, clubs, etc.) impacts negatively on social relations as it hinders the connection between the community members31. Thus, given the social characteristics and housing conditions of the par-ticipants of this study, we expected that the structural and functional aspects of social relationships were associated with HRQOL in this analysis. However, only functional aspects of social relations, such as dissatisfaction with personal relationships and not always having the support needed to help staying in bed, to go to the doctor, and to prepare meals were independently associated with worse HRQOL and only in the men-tal component. It should be noted that dissatisfaction with personal relationships was associated with a decrease of 7.3 points in average MCS. These results suggest that, in this population, the perception of quality of personal relationships and the perception of the presence of social support may be more important aspects of HRQOL than sim-ply the existence (or quantity) of these relations. Our results are consistent with other studies that show that functional aspects of social relations better predict the self-rated health32,33 and mortality34 than structural aspects. However, population-based study in Italy has shown that both structural and functional aspects of social relations were asso-ciated with physical and mental components of HRQOL17.
Elderly people who do not practice physical activity during leisure time had a poorer HRQOL in the physical component; however, this behavior was not associated with MCS. The association between physical activity and HRQOL has been demonstrated in several studies10,14,17,35 and this association usually has greater magnitude in the physical compo-nent than in the mental compocompo-nent10,14,17. Physical activity reduces the intrinsic deleterious efects of aging, acts as a protective factor for various diseases and health problems, and it is related to the functionality maintenance over time14, which are aspects intrinsically related to the physical component of HRQOL. As this study has a cross-sectional design, we can-not disregard the possibility that the elderly persons who have worse HRQOL tend to be less physically active. However, longitudinal studies14,35 show that the lack of physical activ-ity predicts decline in HRQOL. Thus, public health measures to promote physical activactiv-ity in older adults can also be considered an HRQOL promotion policy. Such measures may be considered a challenge, especially in socially vulnerable populations such as the participants of this study, because they reside in places with adverse social and physical characteristics (i.e.: lack of security, scarcity of sidewalks and lighting, and lack of appropriate places to perform physical activities such as parks and squares), making it diicult to practice phys-ical activities36.
depression symptoms37,38. However, we know that the decline in health conditions induces the reduction in alcohol consumption39. Thus, reverse causality can be a major explanation for our indings. It is also important to note that, despite the moderate consumption of alcohol is associated with better HRQOL in longitudinal studies40,41, the decline in HRQOL associated with increasing age is similar for all categories of alcohol consumption, even among those who do not consume alcoholic drinks40. Thus, there is no evidence that would support a recommendation of alcohol consumption for the elderly persons in order to min-imize the decline in HRQOL.
The prevalence of chronic diseases and multimorbidity are increasing mainly in pop-ulations exposed to socioeconomic adversity3 such as the elderly persons of this study. The results of our analysis show that this morbidity proile has great impact on HRQOL, as the greater the number of medical diagnoses of chronic diseases, the worse the HRQOL in the physical and mental components. In addition, being bedridden for the last 15 days was independently associated with the PCS and MCS, while the occurrence of hospital-ization was associated with worse HRQOL only in PCS. These results are consistent with other previous studies11,12,15,17 conducted among noninstitutionalized elderly persons and demonstrate that the functional aspects afect not only the physical component of quality of life but also the mental component when inluencing the proper performance of func-tions considered important by individuals.
This study has some limitations that need to be highlighted. The variables retained in the inal model explained a small proportion of the variability of distribution of PCS and MCS and a reduced number of variables remained independently associated with HRQOL, especially the variables of the social relations group. All study participants were elderly people who lived in a low-income region as previously mentioned. Therefore, the homo-geneity of the socioeconomic proile of the studied population along with the small size of our sample may have hindered the inding of associations between HRQOL and the explanatory variables, especially associations of small magnitude. In addition, as already mentioned, another limitation of this analysis is its cross-sectional design and, therefore, we cannot ignore that the associations found in this study are a result of reverse causality. Finally, we did not use indicators of all dimensions covered in the structural and functional aspects of social relations. Therefore, it is possible that other aspects of social relations, not evaluated in this study, are important for understanding the HRQOL of elderly per-sons in social vulnerability.
CONCLUSION
292
ACKNOWLEDGMENTS
To all study participants and staf of the health center Vila Pinho in Belo Horizonte, to the Research Support Foundation of Minas Gerais for funding this study, to the Coordination of Higher Education Personnel Improvement (CAPES) for postdoctoral fellowship (PNPD-CAPES) granted to Lidyane V. Camelo, and to the National Council for Scientiic and Technological Development for research productivity scholarship granted to Sandhi Maria Barreto (CNPq: 300159/99-4) and Luana Giatti (CNPq: 312371/2013-6).
1. Vasconcelos AMN, Gomes MMF. Transição demográfica: a experiência brasileira. Epidemiol Serv Saúde 2012; 21(4): 539-48.
2. Instituto Brasileiro de Geograia e Estatística. Síntese de indicadores sociais 2014: uma análise das condições de vida da população brasileira. Rio de Janeiro: IBGE; 2014. 3. Schmidt MI, Duncan BB, Azevedo e Silva G, Menezes AM, Monteiro CA, Barreto SM, et al. Chronic non-communicable diseases in Brazil: burden and current challenges. Lancet 2011; 377(9781): 1949-61. 4. Fleck MPA. Problemas conceituais em qualidade de vida. In: Fleck MPA (editor). A avaliação de qualidade de vida: guia para proissionais da saúde. Porto Alegre: Artmed; 2008. p. 19-28.
5. Seidl EMF, Zannon CMLC. Qualidade de vida e saúde: aspectos conceituais e metodológicos. Cad Saúde Pública 2004; 20(2): 580-8.
6. Vecchia RD, Ruiz T, Bocchi SCM, Corrente JE. Qualidade de vida na terceira idade: um conceito subjetivo. Rev Bras Epidemiol 2005; 8(3): 246-52. 7. Brown DS, Thompson WW, Zack MM, Arnold SE,
Barile JP. Associations between health-related quality of life and mortality in older adults. Prev Sci 2015; 16(1): 21-30.
8. Ribeiro KT. Fatores associados à qualidade de vida relacionada à saúde de idosos residentes no Município de São Paulo – Estudo SABE: Saúde, Bem-Estar e Envelhecimento [tese de doutorado]. São Paulo: Universidade de São Paulo; 2011.
9. Lima MG, Barros MBA, César CLG, Goldbaum M, Carandina L, Ciconelli RM. Health related quality of life among the elderly: a population-based study using SF-36 survey. Cad Saúde Pública 2009; 25(10): 2159-67. 10. Lima MG, Barros MBA, Cesar CLG, Goldbaum M, Carandina L, Alves MCGP. Comportamentos relacionados à saúde e qualidade de vida em idosos: um estudo de base populacional. Rev Saúde Pública 2011; 45(3): 485-93.
11. Lima MG,Barros MB, César CL, Goldbaum M, Carandina L, Ciconelli RM. Impact of chronic disease on quality of life among the elderly in the state of São Paulo, Brazil: a population-based study. Rev Panam Salud Publica 2009; 25(4): 314-21.
12. Campolina AG, Dini PS, Ciconelli RM. Impacto da doença crônica na qualidade de vida de idosos da comunidade em São Paulo (SP, Brasil). Ciênc Saúde Coletiva 2011: 16(6): 2919-25.
13. Otero-Rodríguez A, León-Muñoz LM, Banegas JR, Guallar-Castillón P, Rodríguez-Artalejo F, Regidor E. Life-course socioeconomic position and change in quality of life among older adults: evidence for the role of a critical period, accumulation of exposure and social mobility. J Epidemiol Community Health 2011; 65(11): 964-71.
14. Balboa-Castillo T, León-Muñoz LM, Graciani A, Rodríguez-Artalejo F, Guallar-Castillón P. Longitudinal association of physical activity and sedentary behavior during leisure time with health-related quality of life in community-dwelling older adults. Health Qual Life Outcomes 2011; 27(9): 47.
15. Hopman, WM, Harrison MB, Coo H, Friedberg E, Buchanan M, VanDenKerkhof EG. Associations between chronic disease, age and physical and mental health status. Chronic Dis Can 2009; 29(2): 108-16. 16. Hawton A, Green C, Dickens AP, Richards SH, Taylor
RS, Edwards R, et al. The impact of social isolation on the health status and health-related quality of life of older people. Qual Life Res 2011; 20(1): 57-67. 17. Belvis AG, Avolio M, Sicuro L, Rosano A, Latini E,
Damiani G, et al. Social relationships and HRQL: a cross-sectional survey among older Italian adults. BMC Public Health 2008; 8: 348.
18. Berkman LF, Krishna. Social network epidemiology. In: Berkman LF, Kawachi I, Glymour MM. Social epidemiology. 2 ed. Oxford: Oxford University Press; 2014.
19. Due P, Holstein B, Lund R, Modvig J, Avlund K. Social relations: network, support and relational strain. Soc Sci Med.1999; 48(5): 661-73.
20. Shankar A, Hamer M, McMunn A, Steptoe A. Social isolation and loneliness: relationships with cognitive function during 4 years of follow-up in the English Longitudinal Study of Ageing. Psychosom Med 2013; 75(2): 161-70.
21. Holwerda TJ, Deeg DJ, Beekman AT, van Tilburg TG, Stek ML, Jonker C, et al. Feelings of loneliness, but not social isolation, predict dementia onset: results from the AmsterdamStudy of the Elderly (AMSTEL). J Neurol Neurosurg Psychiatry 2014; 85(2): 135-42.
22. Grav S, Hellzèn O, Romild U, Stordal E. Association between social support and depression in the general population: the HUNT study, across-sectional survey. J Clin Nurs 2012; 21(1-2): 111-120.
23. Torres JL, Dias RC, Ferreira FR, Macinko J, Lima-Costa MF. Functional performance and social relations among the elderly in Greater Metropolitan Belo Horizonte, Minas Gerais State, Brazil: a population-based epidemiological study. Cad Saude Publica.2014; 30(5): 1018-28.
24. Perissinotto CM, Stijacic Cenzer I, Covinsky KE. Loneliness in older persons: a predictor of functional decline and death. Arch Intern Med 2012; 172(14): 1078-83.
25. Secretaria Municipal de Saúde de Belo Horizonte. Índice de vulnerabilidade à saúde 2003. Disponível em: http://www.pbh.gov.br/smsa/biblioteca/gabinete/ risco2003.pdf (Acessado em: 12 de agosto de 2015). 26. Ware JE, Kosinski M, Keller SD. SF-12: How to score
the SF-12 Physical and mental health summary scales. 2 ed. Boston: The Health Institute, New England Medical Center; 1995.
27. Giacomin KC, Peixoto SV, Uchoa E, Lima-Costa MF. Estudo de base populacional dos fatores associados à incapacidade funcional entre idosos na Região Metropolitana de Belo Horizonte, Minas Gerais, Brasil. Cad Saúde Pública 2008; 24(6): 1260-70. 28. Phelan JC, Link BG, Tehranifar P. Social conditions
as fundamental causes of health inequalities: theory, evidence, and policy implications. J Health Soc Behav 2010; 51(Suppl): S28-40.
29. McEwen BS. Brain on stress: how the social environment gets under the skin. Proc Natl Acad Sci USA 2012: 109 (Suppl 2): 17180-5.
30. Vonneilich N, Jöckel KH, Erbel R, Klein J, Dragano N, Weyers S, et al. Does socioeconomic status afect
the association of social relationships and health? A moderator analysis. Int J Equity Health 2011; 10: 43. 31. Levasseur M, Généreux M, Bruneau JF, Vanasse A, Chabot É, Beaulac C, et al. Importance of proximity to resources, social support, transportation and neighborhood security for mobility and social participation in older adults: results from a scoping study. BMC Public Health 2015: 15: 503.
32. Fiorillo D, Sabatini F. Quality and quantity: the role of social interactions in self-reported individual health. Soc Sci Med 2011; 73(11): 1644-52.
33. Melchior M, Berkman LF, Niedhammer I, Chea M, Goldberg M. Social relations and self-reported health: a prospective analysis of the French Gazel cohort. Soc Sci Med 2003; 56(8): 1817-30.
34. Holt-Lunstad J, Smith TB, Layton JB. Social relationships and mortality risk: a meta-analytic review. PLoS Med 2010: 7(7): e1000316.
35. Awick EA, Wójcicki TR, Olson EA, Fanning J, Chung HD, Zuniga K, et al. Diferential exercise efects on quality of life and health-related quality of life in older adults: a randomized controlled trial. Qual Life Res 2015; 24(2): 455-62.
36. Haselwandter EM, Corcoran MP, Folta SC, Hyatt R, Fenton M, Nelson ME. The built environment, physical activity, and aging in the United States: a state of the science review. J Aging Phys Act 2015; 23(2): 323-9. 37. Kim JW, Lee DY, Lee BC, Jung MH, Kim H, Choi YS,
et al. Alcohol and cognition in the elderly: a review. Psychiatry Investig 2012; 9(1): 8-16.
38. Gea A, Beunza JJ, Estruch R, Sánchez-Villegas A, Salas-Salvadó J, Buil-Cosiales P, et al. Alcohol intake, wine consumption and the development of depression: the PREDIMED study. BMC Med 2013; 11: 192. 39. Liang W, Chikritzhs T. Reduction in alcohol
consumption and health status. Addiction 2011; 106(1): 75-81.
40. Kaplan MS, Huguet N, Feeny D, McFarland BH, Caetano R, Bernier J, et al. Alcohol use patterns and trajectories of health-related quality of life in middle-aged and older adults: a 14-year population-based study. J Stud Alcohol Drugs 2012; 73(4): 581-90.
41. Byles J, Young A, Furuya H, Parkinson L. A drink to healthy aging: the association between older women’s use of alcohol and their health-related quality of life. J Am Geriatr Soc 2006; 54(9): 1341-7.
Received on: 02/09/2015