ABSTRACT:Objective: To compare the prevalence of excess of body weight between the surveys conducted in the years 2010, 2012 and 2014, in college students from the same institution. Methods: Three cross-sectional surveys were carried out in representative samples of students of a public institution. The excess of body weight was estimated by the body mass index and compared between the surveys, using the χ2 test for linear trend, in each of the categories: sociodemographic, link with the university and health-related behaviors.
Results: There were 1,069, 1,074 and 1,031 participants in the surveys in 2010, 2012 and 2014, respectively. Between surveys, the prevalence of overweight increased in men (2010: 30.1%; 2014: 36.4%), but not in women. There was an increased prevalence of excess body weight for the categories of sociodemographic variables link with the university and health-related behaviors in men and women. Conclusion: An increasing prevalence of excess body weight in college students was observed in the surveys. The conduction of interventions aimed at maintaining body weight is essential in order to avoid possible diseases associated with the concentrations of fat in inadequate levels.
Keywords: Overweight. Obesity. Students. Cross-Sectional Studies. Longitudinal Studies.
Prevalence of body weight excess in undergraduate
students: analysis of repeated surveys
Prevalências de excesso de peso corporal em
universitários: análise de inquéritos repetidos
Thiago Ferreira de SousaI, Aline Rodrigues BarbosaII
IUniversidade Federal do Recôncavo da Bahia – Amargosa (BA), Brazil.
IIPostgraduate Program in Physical Education, Universidade Federal de Santa Catarina – Florianópolis (SC), Brazil.
Corresponding author: Thiago Ferreira de Sousa. Universidade Federal do Recôncavo da Bahia. Centro de Formação de Professores. Avenida Nestor de Mello Pita, 535, Caixa Postal: 64, Centro, CEP: 45.300-000, Amargosa, BA, Brasil. E-mail: [email protected]
Conlict of interests: nothing to declare – Financial support: none.
INTRODUCTION
Excess body weight (EBW) is a serious public health problem and is a risk factor for the emergence of chronic non-communicable diseases (NCDs)1-3. EBW is associated with
psy-chological disorders such as depression1 and increases the risks of mortality due to cancer2
and other causes3.
In developed and developing countries, prevalence of EBW has increased in both young people and adults4. It is estimated that, by 2030, the worldwide concentration of people with
EBW could be of 3.38 billion5. In Brazil, in 2002 and 2003, this occurrence in men was of
50.4%; in 2008, and in 2009, it increased to 62.5%. For women, between 2008-2009, it was of 64.9% - an increase of approximately 10% compared to 2002-20036. Over time, this has
also been veriied in children and adolescents6.
As for the group in the transition phase from adolescence to adulthood (university stu-dents), studies pointed to a high prevalence of EBW in undergraduates from universities in Brazil7,8, the United States9 and Portugal10. This situation was observed among men and
physical activity practitioners11.
Information on the prevalence and factors associated with EBW in Brazilian univer-sity students is limited, since studies, to date, have been limited to the participation of new students entering university7,12 and women7, as well as not having national coverage7,8,12.
In addition, the predominance of cross-sectional studies7,8,12 makes it diicult to identify
possible temporal trends.
Consistent with the need for research on EBW in this group, it is important to con-sider the increase in enrollment in higher education13. With the exception of the South
RESUMO:Objetivo: Comparar as prevalências de excesso de peso corporal, entre os inquéritos realizados nos anos de 2010, 2012 e 2014, com universitários de uma mesma instituição. Métodos: Foi realizada uma pesquisa de monitoramento, com a condução de inquéritos transversais em amostras representativas de universitários de uma instituição do estado da Bahia. O excesso de peso corporal foi estimado pelo índice de massa corporal e comparado entre os inquéritos, por meio do teste do χ2 para tendência linear, em cada uma das categorias das variáveis sociodemográicas, de vínculo com a universidade e dos comportamentos relacionados à saúde. Resultados:
Participaram 1.069, 1.074 e 1.031 universitários nos inquéritos de 2010, 2012 e 2014, respectivamente. A prevalência de excesso de peso corporal aumentou entre as investigações, de forma geral, em homens (2010: 30,1%; 2014: 36,4%), mas não em mulheres. Também se elevou em relação às categorias das características sociodemográicas, de vínculo com a universidade e dos comportamentos pertinentes à saúde em homens e mulheres. Conclusão: O aumento na prevalência de excesso de peso corporal em universitários foi mostrado entre os inquéritos. A realização de intervenções destinadas à manutenção do peso corporal é essencial para evitar o surgimento de possíveis doenças associadas às concentrações de gordura em níveis inadequados.
and Southeastern regions of the country, between 2001 and 2010, access to universities became more comprehensive for Brazilians, with the highest enrollment growth being in the Northeast, from 15.2% to 19.3%13. Considering the above, as well as the need to monitor
the prevalence of EBW in this group, especially due to the negative impact of this biological marker on health, this study aimed to compare the prevalence of EBW between the surveys conducted in the years 2010, 2012 and 2014, with university students of the same institution.
METHODS
The data in this study were derived from the Monitoring of Health Indicators and Quality of Life of Academics (Monitoramento dos Indicadores de Saúde e Qualidade de Vida de Acadêmicos - MONISA) Research, held at a university in the state of Bahia. The method-ological details of this study were presented in a previous publication14.
The target population was university students enrolled in the second semester of under-graduate courses in the years 2010, 2012 and 2014. E-learning students were excluded, as well those with special enrollment conditions and those entering the institution in the sec-ond semester, totaling: in 2010, 5,461 students; in 2012, 5,767; and in 2014, 5,244. In all three surveys, the sample estimates were similar for the adopted parameters (prevalence: 50%; relative error: 3 percentage points, or p.p.; 95% conidence interval; increase of 20 and 15% for losses and refusals). The estimated samples, in the years 2010, 2012 and 2014, were 1,232, 1,243 and 1,223, respectively.
The sample was stratiied according to the distribution of the target population in the courses, time of classes and years of entry into the institution. In 2010, 30 courses were included. In 2012, four courses were added to these, resulting in 34 courses. In 2014, the Language Studies courses with qualiication in Spanish and with qualiication in English were fused into one single “Language Studies course”, making 33 courses. The daytime (morning and evening) and night class periods were considered.
In each of the three surveys, the years of entry into the university were organized into four categories (considering the minimum time for completion of most courses in eight semesters):
1. 2010 survey – entrants from 2010, 2009, 2008, 2007 and earlier; 2. 2012 survey – entrants from 2012, 2011, 2010, 2009 and earlier; 3. 2014 survey – entrants from 2014, 2013, 2012, 2011 and earlier.
In each stratum, the university students were randomly selected, with the help of the registration list, in alphabetical order, using the Research Randomizer software.
The university students selected were searched in the institution in up to three attempts, at diferent days and times; data collection was carried out between September and November in the year of each survey, before or during classes, according to the convenience of the individuals selected. There was no replacement for those who were not found or refused to participate.
The information was obtained through the Health Indicators and Quality of Life of Academics (ISAQ-A) questionnaire, developed for application in research with university students and previously validated regarding face and content, as well as tested for its lev-els of reproducibility15. The questionnaires were applied individually or collectively (up to
40 students), being illed by the students themselves in the classroom. The same conditions were guaranteed during collection with only one student or in groups: guidelines were given for the illing of the questionnaires and a member of the team was available to resolve any doubts at the time of collection.
OUTCOME VARIABLE
EBW was estimated by the body mass index (BMI), using the measures of body mass and height included in the ISAQ-A questionnaire and classiied according to the criteria established by the World Health Organization (WHO)16 for adults aged 18 years or older,
in BMI ≥ 25 kg/m2, through the following equation: body mass divided by height squared.
University students aged under 18 years were classiied according to Cole et al.17
The analysis of reproducibility of the height and body mass reported, with an inter-val of one week, was previously published15. The values obtained were considered
satis-factory (height in meters, mean diference of – 0.002, 95%CI - 0.006 – 0.003; body mass in kilograms, mean diference of 0.36, 95%CI - 0.19 – 0.91),according to the plotting of the Bland-Altman scatter plot.
The levels of concurrent validity of the measures of body mass and stature reported in relation to the measurements showed satisfactory agreement for use in the classiication of EBW in this group for use in epidemiological studies18, with Kappa values of 0.76 for men
and 0.74 for women.18.
EXPLORATORY VARIABLES
The independent, sociodemographic variables were: sex; age group in tertiles (1st
ter-tile, 17 to 20 years, 2nd tertile, 21 to 23 years, and 3rd tertile, 24 years or more); marital
sta-tus (no spouse and spouse). The variables related to the bond with the university were the period of classes (night and day) and years of exposure to the university, being:
• in the 2012 survey – one year for entrants in 2012; two years for entrants in 2011; three years for entrants in 2010; and four years and more for entrants in 2009 and earlier;
• in the 2014 survey – one year for entrants in 2014; two years for entrants in 2013; three years for entrants in 2012; and four years and more for entrants in 2011 and earlier;
The variables referring to health-related behaviors were:
• physical activities during leisure, classiied as active (university students who reported practicing physical activity in at least one day of a typical week) and inactive (those who did not practice physical activity, but were interested in doing it, and those who did not practice but had no interest);
• consumption of fruits, referring to the frequency of this intake on typical weekdays, classiied in up to four days per week and ive days or more per week19;
• consumption of vegetables, frequency of intake in typical weekdays, classiied as up to four days per week and ive days or more per week19;
• consumption of soft drinks, use of soft drinks (including low calorie ones and/ or artiicial juice) on typical weekdays, classiied as up to four days a week and ive days or more per week19;
• consumption of fatty red meat, by reporting the intake of this meat with beef, pork or lamb fat, classiied in no (no day per week) and yes (one day or more per week)19;
• consumption of chicken with fat, which is the intake of chicken with skin (without removing the visible fat) in typical weekdays, categorized in no (no day per week) and yes (one day or more per week)19.
The information was tabulated in EpiData 3.1 and the analyzes were performed in the Statistical Package for Social Sciences (SPSS) version 15.0. Descriptive analyzes of the abso-lute and relative frequencies, mean and standard deviation were used. To compare the prev-alence of EBW between the surveys, for each independent variable, the χ2 test was used for
linear trend. All analyzes were stratiied by sex. The level of signiicance was 5%.
The design of the MONISA study was approved by the local research ethics committee, under protocol no. 382/2010. Participants signed the informed consent and had their iden-tiication information kept conidential.
RESULTS
of men and women are presented in Table 1. In the three surveys, there was a greater par-ticipation of women (2010: 54.7%, 2012: 54.9%, 2014: 52.5%).
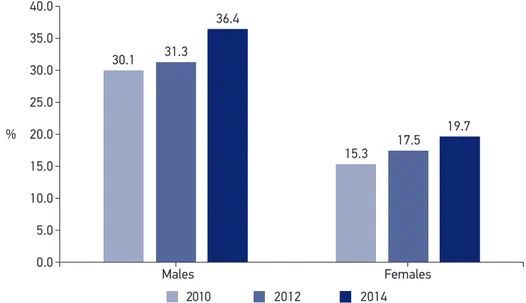
The prevalence of EBW in university students in each survey is shown in Figure 1. There was an increase in the prevalence of EBW in men (p < 0.05), speciically between 2012 and 2014, but not in women.
Variables
2010 Survey 2012 Survey 2014 Survey
H (n) %
M (n) %
H (n) %
M (n) %
H (n) %
M (n) %
Age group (years)
17 to 20 (124) 25.6 (161) 27.6 (137) 28.2 (166) 28.3 (147) 30.1 (175) 32.3 21 to 23 (180) 37.1 (220) 37.7 (150) 30.9 (208) 35.4 (162) 33.1 (190) 35.1 24 or more (181) 37.3 (202) 34.6 (199) 40.9 (213) 36.3 (180) 36.8 (177) 32.7 Marital status
No spouse (427) 87.0 (509) 86.0 (415) 85.0 (505) 85.4 (425) 86.2 (480) 88.4 Spouse (64) 13.0 (83) 14.0 (73) 15.0 (86) 14.6 (68) 13.8 (63) 11.6
Period of classes
Daytime (318) 64.8 (416) 70.3 (320) 65.4 (410) 68.9 (350) 70.9 (397) 72.6 Night (173) 35.2 (176) 29.7 (169) 34.6 (185) 31.1 (144) 29.1 (150) 27.4
Time of exposure to the university (years)
1 (103) 21.0 (130) 22.0 (104) 21.3 (126) 21.2 (98) 19.8 (102) 18.6 2 (103) 21.0 (164) 27.7 (121) 24.7 (142) 23.9 (96) 19.4 (103) 18.8 3 (114) 23.2 (111) 18.8 (80) 16.4 (135) 22.7 (88) 17.8 (139) 25.4 4 or more (171) 34.8 (187) 31.6 (184) 37.6 (192) 32.3 (212) 42.9 (203) 37.1
Consumption of fruit (days/week)
≥ 5 (75) 15.5 (125) 21.7 (88) 18.1 (133) 22.9 (114) 23.3 (159) 29.4 Up to 4 (410) 84.5 (451) 78.3 (399) 81.9 (448) 77.1 (375) 76.7 (381) 70.6
Consumption of vegetables (days/week)
≥ 5 (188) 39.0 (267) 46.5 (191) 40.7 (272) 47.5 (215) 44.3 (269) 50.2 Up to 4 (294) 61.0 (307) 53.5 (278) 59.3 (301) 52.5 (270) 55.7 (267) 49.8
Consumption of fatty meat
No (31) 6.5 (67) 11.8 (39) 8.3 (61) 10.9 (28) 5.8 (71) 13.3 Yes (449) 93.5 (500) 88.2 (430) 91.7 (499) 89.1 (451) 94.2 (463) 86.7
Consumption of fatty chicken
No (205) 42.0 (356) 62.6 (176) 37.4 (316) 56.5 (201) 41.7 (267) 50.5 Yes (283) 58.0 (213) 37.4 (294) 62.6 (243) 43.5 (281) 58.3 (262) 49.5
Consumption of sot drinks (days/week)
Up to 4 (379) 77.5 (464) 78.9 (371) 76.7 (467) 80.1 (419) 85.3 (474) 86.8
≥ 5 (110) 22.5 (124) 21.1 (113) 23.3 (116) 19.9 (72) 14.7 (72) 13.2
Physical activity during leisure
Inactive (167) 34.6 (372) 64.6 (166) 34.8 (355) 60.2 (170) 35.0 (325) 60.1
Active (315) 65.4 (204) 35.4 (311) 65.2 (235) 39.8 (316) 65.0 (216) 39.9
Table 1. Sociodemographic characteristics, information on university bond and on health-related behaviors of university student samples.
The comparison between the prevalence of EBW between the surveys, according to the independent variables, is presented in Table 2. In men, there was an increase among the investigations for university students in the lowest age group, in the night period, in their irst year of exposure to the university, which reported fruit consumption of up to four days a week, fatty meat and fatty chicken consumption, of soft drink consumption in up to four days a week, as well as being physically active during leisure.
For females (Table 2), over time, the increase in the prevalence of EBW occurred for those in the highest age tertile, who had a spouse, who studied in the daytime with four years and more of exposure to the university, who reported consuming fruits on ive or more days of the week, who reported not ingesting chicken with fat and who did not engage in physical activity during leisure.
DISCUSSION
The prevalence of EBW has generally increased over time in men and not in women. In both groups, this increase was evidenced in diferent categories of sociodemographic char-acteristics and bond with the university, as well as health-related behaviors.
The males analyzed in this study had an increase in EBW similar to Harvard under-graduates11, during the years of the investigations, and it appears that this follows the
trend estimated in the surveillance of risk and protection factors for chronic diseases by phone survey (VIGITEL)19,20. However, in this study, there were no differences in
the prevalence of EBW among women, which did not occur for the female students of Havard11. It is important to consider the interval between the surveys: the largest
Figure 1. Prevalence of excess body weight among university students.
40.0
35.0
30.1 31.3
36.4
15.3
17.5 19.7 30.0
25.0
20.0
15.0
10.0
5.0
0.0
Males Females
2010 2012 2014
Variables
Males
p-
value*
Females
p-
value* 2010
(n) %
2012 (n) %
2014 (n) %
2010 (n) %
2012 (n) %
2014 (n) %
Age group (years)
17 to 20 (16) 13.2 (27) 20.3 (42) 28.6 < 0.01 (17) 10.8 (17) 10.8 (23) 13.4 0.46
21 to 23 (47) 26.1 (36) 24.2 (47) 29.4 0.51 (24) 11.4 (35) 16.9 (24) 13.2 0.56
24 or more (82) 45.3 (87) 44.2 (88) 49.2 0.46 (45) 23.2 (47) 23.4 (56) 33.1 0.04
Marital status
No spouse (110) 26.3 (112) 27.6 (131) 31.3 0.11 (66) 13.5 (74) 15.3 (78) 16.9 0.15
Spouse (35) 54.7 (38) 52.1 (45) 68.2 0.12 (20) 27.0 (24) 31.6 (25) 43.9 0.05
Period of classes
Daytime (88) 28.5 (90) 28.8 (108) 31.5 0.39 (53) 13.3 (61) 15.6 (70) 18.4 0.05
Night (57) 32.9 (60) 35.9 (69) 48.3 < 0.01 (33) 20.1 (38) 21.8 (33) 23.1 0.53
Time of exposure to the university (years)
1 (17) 16.8 (31) 30.4 (41) 42.3 < 0.01 (23) 19.0 (23) 19.3 (14) 14.3 0.38
2 (34) 33.3 (26) 21.8 (24) 25.3 0.19 (18) 11.4 (28) 21.1 (16) 15.7 0.24
3 (34) 30.6 (26) 33.3 (36) 41.4 0.12 (22) 20.2 (18) 13.7 (25) 18.9 0.86
4 or more (60) 35.7 (67) 37.2 (76) 36.7 0.85 (23) 13.1 (30) 16.5 (48) 25.1 < 0.01
Consumption of fruit (days/week)
≥ 5 (29) 39.2 (32) 37.6 (38) 33.9 0.45 (21) 17.8 (20) 15.9 (32) 20.9 0.47 Up to 4 (115) 28.6 (116) 29.6 (139) 37.7 < 0.01 (63) 14.6 (77) 18.1 (70) 19.1 0.09
Consumption of vegetables (days/week)
≥ 5 (58) 31.5 (63) 33.9 (82) 38.5 0.14 (38) 14.9 (46) 17.8 (56) 21.6 0.05 Up to 4 (85) 29.4 (80) 29.3 (94) 35.6 0.12 (46) 15.8 (50) 17.5 (43) 17.0 0.70
Consumption of fatty meat
No (4) 12.9 (11) 28.9 (5) 17.9 0.60 (6) 9.2 (8) 14.3 (10) 14.5 0.36
Yes (137) 31.1 (132) 31.4 (170) 38.3 0.02 (78) 16.4 (86) 18.1 (91) 20.6 0.10
Consumption of fatty chicken
No (68) 34.0 (54) 31.4 (76) 38.0 0.40 (43) 12.7 (58) 19.4 (50) 19.5 0.02
Yes (76) 27.2 (89) 30.9 (97) 35.3 0.04 (40) 19.5 (36) 15.4 (46) 18.5 0.82
Consumption of sot drinks (days/week)
Up to 4 (109) 29.3 (119) 32.8 (150) 36.3 0.04 (67) 15.2 (80) 18.0 (86) 19.0 0.14
≥ 5 (36) 33.3 (30) 27.0 (27) 38.6 0.60 (19) 16.0 (17) 15.3 (16) 23.2 0.26
Physical activity during leisure
Inactive (48) 29.6 (58) 35.6 (57) 34.1 0.39 (53) 15.1 (57) 17.0 (66) 21.2 0.04
Active (95) 30.4 (85) 28.0 (119) 38.3 0.04 (31) 15.9 (42) 18.7 (35) 16.9 0.80
Table 2. Prevalence of excess body weight between the surveys with university students, according to sociodemographic variables, bond with the university and health-related behaviors.
interval in the present study was four years; at Harvard, it was seven years11 — which
may have contributed to the identification of differences between the prevalence of EBW among women.
The results showed the increase in the prevalence of EBW over time in males of the lowest age group and the irst year of exposure to university. The occurrence of EBW among the categories of university exposure time in Harvard students was veriied for those in the ifth year, from 28.7% in 1993 to 37.2% in 199911. In this study, the diference
between the prevalence observed for the youngest men and the irst year of university exposure may represent a trend in the increase on EBW in adolescence13, and thus,
uni-versity students have entered with a higher EBW each year. In addition, it is important to consider the occurrence of BMI increase in the irst few months of university, as veriied in Canadian university students21.
For women, the increase in the prevalence of EBW (2010 to 2014) occurred for those in the highest age group and with four years or more of exposure to the university. Adult women from the Brazilian capitals, aged 24 to 54 years, also presented higher prevalence of EBW in 201420, when compared to 200619. In a meta-analysis, it was veriied that, at the end
of the university period, there was an increase of 1.55 kg in body weight, and 1.17% in fat percentage. This accumulation was higher than at the beginning22, which possibly explains
the results shown here for females.
In relation to the females with a spouse, a predominance of EBW was evidenced over the years of the surveys. Studies have indicated that the same occurs with married adults of both sexes, regardless of age23,24, schooling and health-related behaviors23. In relation to
married women, this may represent less involvement in behaviors related to maintaining body weight, such as physical activity in leisure23.
The results showed that the prevalence of EBW in men who studied at night increased during the surveys; however, in women, the fact was evidenced for the daytime period. Students attending night classes are usually engaged in occupational activities that require little energy expenditure and which favor an inadequate diet during the day25. The
char-acteristics related to the higher prevalence of EBW in university students attending night classes are not conclusive8,26, which raises the need for scientiic research on the occurrence
of EBW in students of diferent periods.
Regarding health-related behaviors, such as eating habits and the practice of physical activities, these components have a direct impact on maintaining body weight27. In the
pres-ent study, the increase in the prevalence of EBW was veriied in men who reported the con-sumption of meat and chicken with fat and the irregular intake of fruits. Studies have shown that inadequate feeding may be positively related to increased body weight8,28.
leisure may have practiced modalities that favor the increase of muscle mass, resulting in classification as EBW29. The increase in the prevalence of EBW in women who are
inactive during leisure may be related to the female habits, which characterize them with a higher prevalence of physical inactivity during leisure, thus, with greater possi-bilities of presenting EBW.
The article presents limitations that should be mentioned. First, the overlap of subjects among the surveys, which was of approximately 7% between the investigations every two years (2010 and 2012; 2012 and 2014) and 3% between 2010 and 2014. The second limita-tion is related to the use of a queslimita-tionnaire for the investigalimita-tion of health-related behav-iors, in view of the possible memory bias; on the other hand, the variables employed in this study presented satisfactory levels of reproducibility15. Although the use of reported
mea-sures of body mass and height for BMI estimation may be seen as a limitation, some vali-dation studies of these measures have shown the possibility of use in epidemiological sur-veys with university students18,30.
Among the strengths of this study are its methodological rigor, using a simple random selection process, in a stratiied sample that is proportional to the diferent characteristics of the bond to the university. The short period of data collection may have avoided possi-ble seasonal academic interference, such as the inals period. Finally, the monitoring aspect contributes to the surveillance of this information in university students.
CONCLUSION
The information from this study allow the conclusion that there has been an increase in the prevalence of EBW over the years between men and women. The estimates herein have pointed to this increase among men:
• in the age group of 17 to 20 years;
• attending night classes;
• in the irst year of exposure to the university;
• who ate fruits up to four days a week;
• who reported the consumption of fatty meats and fatty chicken;
• in addition to the consumption of soft drinks up to four days a week; and
• who are active during leisure.
In females, this increase was shown for women who:
• were aged 24 years or over;
• who had a spouse;
• who attended the daytime classes;
• with four years and more of university exposure;
• who ate fruit on ive or more days per week;
• who did not consume fatty chicken; and
The implementation of interventions focused on the maintenance of body weight in university students is essential, as it may prevent the emergence of diseases associated with fat concentrations at inadequate levels.
1. Luppino FS, Wit LM, Bouvy PF, Stijnen T, Cuijpers P, Penninx BW, et al. Overweight, obesity, and depression: a systematic review and meta-analysis of longitudinal studies. Arch Gen Psychiatry 2010; 67(3): 220-9. DOI: 10.1001/archgenpsychiatry.2010.2
2. Calle EE, Rodriguez C, Walker-Thurmond K, Thun MJ. Overweight, obesity, and mortality from cancer in a prospectively studied cohort of U.S. adults. N Engl J Med 2003; 348(17): 1625-38. DOI: 10.1056/ NEJMoa021423
3. Adams KF, Schatzkin A, Harris TB, Kipnis V, Mouw T, Ballard-Barbash R, et al. Overweight, obesity, and mortality in a large prospective cohort of persons 50 to 71 years old. N Engl J Med 2006; 355(8): 763-78. DOI: 10.1056/NEJMoa055643
4. Low S, Chin MC, Deurenberg-Yap M. Review on epidemic of obesity. Ann Acad Med Singapore 2009; 38(1): 57-9.
5. Kelly T, Yang W, Chen CS, Reynolds K, He J. Global burden of obesity in 2005 and projections to 2030. Int J Obes (Lond) 2008; 32(9): 1431-7. DOI: 10.1038/ijo.2008.102
6. Brasil. Instituto Brasileiro de Geograia e Estatística (IBGE). Pesquisa de Orçamentos Familiares 2008-2009: antropometria e estado nutricional de crianças, adolescentes e adultos no Brasil. Rio de Janeiro 2010. [Internet]. Disponível em: http://www.ibge.gov.br/ home/ (Acessado em 15 de outubro de 2010).
7. Costa LCF, Vasconcelos FAG. Prevalence and factors associated with nutritional status among female university students in Florianópolis, SC. Rev Bras Cineantropom Desempenho Hum 2013; 15(3): 326-37. DOI: 10.5007/1980-00326-37.2013v15n3p326
8. Fontes AC, Pontes LM, Vianna RP. Prevalência e fatores associados ao sobrepeso e obesidade em estudantes universitários, Paraíba, Brasil. Coleção Pesquisa Educação Física 2012; 11(2): 149-58.
9. Sira N, Pawlak R. Prevalence of overweight and obesity, and dieting attitudes among Caucasian and African American college students in Eastern North Carolina: a cross-sectional survey. Nutr Res Pract 2010; 4(1): 36-42. DOI: 10.4162/nrp.2010.4.1.36
10. Brandão MP, Pimentel FL, Silva CC, Cardoso MF. Factores de risco cardiovascular numa população universitária portuguesa. Rev Port Cardiol 2008; 27(1): 7-25.
11. Nelson TF, Gortmaker SL, Subramanian SV, Cheung L, Wechsler H. Disparities in overweight and obesity among US college students. Am J Health Behav 2007; 31(4): 363-73. DOI: 10.5555/ajhb.2007.31.4.363
12. Madureira AS, Corseuil HX, Pelegrini A, Petroski EL. Associação entre estágios de mudança de comportamento relacionados à atividade física e estado nutricional em universitários. Cad Saúde Pública 2009; 25(10): 2139-46. DOI: 10.1590/S0102-311X2009001000005
13. Brasil. Instituto Nacional de Estudos e Pesquisas Educacionais Anísio Teixeira (INEP). Censo da educação superior 2010: divulgação dos principais resultados do Censo da Educação Superior 2010. Ministério da Educação 2011. [Internet]. Disponível em: http://download.inep.gov.br/educacao_superior/ censo_superior/documentos/2010/divulgacao_ censo_2010.pdf (Acessado em 14 de julho de 2012).
14. Sousa TF, Fonseca SA, José HP, Nahas MV. Estudo MONISA: características e aspectos metodológicos. Rev Bras Epidemiol 2012; 15(4): 904-7. DOI: 10.1590/ S1415-790X2012000400020
15. Sousa TF, Fonseca SA, José HP, Nahas MV. Validade e reprodutibilidade do questionário indicadores de saúde e qualidade de vida de acadêmicos (ISAQ-A). Arq Ciênc Esp 2013; 1(1): 21-30.
16. World Health Organization (WHO). Obesity: preventing and managing the global epidemic: report on a WHO expert consultation on obesity 3-5. Geneva: WHO; 1997.
17. Cole TJ, Bellizzi MC, Flegal KM, Dietz WH. Establishing a standard deinition for child overweight and obesity worldwide: international survey. BMJ 2000; 320(7244): 1240-3.
18. Sousa TF, Barbosa AR. Validade das medidas referidas da massa corporal e estatura em universitários. ABCS Health Sci 2016; 41(2): 71-7. DOI: 10.7322/abcshs. v41i2.872
19. Brasil. Ministério da Saúde. VIGITEL 2006. Vigilância de fatores de risco e proteção para doenças crônicas por inquérito telefônico: estimativas sobre frequência e distribuição sociodemográica de fatores de risco e proteção para doenças crônicas nas capitais dos 26 Estados brasileiros e no Distrito Federal em 2006. Brasília: Ministério da Saúde; 2007. 90 p.
20. Brasil. Ministério da Saúde. VIGITEL 2014. Vigilância de fatores de risco e proteção para doenças crônicas por inquérito telefônico: estimativas sobre frequência e distribuição sociodemográica de fatores de risco e proteção para doenças crônicas nas capitais dos 26 Estados brasileiros e no Distrito Federal em 2014. Brasília: Ministério da Saúde; 2015. 152 p.
21. Edmonds MJ, Ferreira KJ, Nikiforuk EA, Finnie AK, Leavey SH, Duncan AM, et al. Body weight and percent body fat increase during the transition from high school to university in females. J Acad Nutr Diet 2008; 108(6): 1033-7. DOI: 10.1016/j.jada.2008.03.002
22. Fedewa MV, Das BM, Evans EM, Dishman RK. Change in weight and adiposity in college students: a systematic review and meta-analysis. Am J Prev Med 2014; 47(5): 641-52. DOI: 10.1016/j.amepre.2014.07.035
23. Janghorbani M, Amini M, Rezvanian H, Gouya MM, Delavari A, Alikhani S, et al. Association of body mass index and abdominal obesity with marital status in adults. Arch Iranian Med 2008; 11(3): 274-81. DOI: 08113/AIM.008
24. Tzotzas T, Vlahavas G, Papadopoulou SK, Kapantais E, Kaklamanou D, Hassapidou M. Marital status and educational level associated to obesity in Greek adults: data from the National Epidemiological Survey. BMC Public Health 2010; 10: 732. DOI: 10.1186/1471-2458-10-732
25. Nahas MV, Barros MV, Bem MF, Oliveira ES, Loch MR. Estilo de vida e indicadores de saúde dos jovens catarinenses. Relatório da pesquisa desenvolvida pelo Núcleo de Pesquisa em Atividade Física e Saúde com amostra representativa dos estudantes de 15 a 19 anos
matriculados nas escolas estaduais do ensino médio em Santa Catarina. Florianópolis: Universidade Federal de Santa Catarina; 2005.
26. Silva DA, Quadros TM, Gordia AP, Petroski EL. Associação do sobrepeso com variáveis sócio-demográicas e estilo de vida em universitários. Ciênc Saúde Colet 2011; 16(11): 4473-79. DOI: 10.1590/ S1413-81232011001200020
27. Donnelly JE, Blair SN, Jakicic JM, Manore MM, Rankin JW, Smith BK, et al. American college of sports medicine position stand. Appropriate physical activity intervention strategies for weight loss and prevention of weight regain for adults. Med Sci Sports Exerc 2009; 41(2): 459-71. DOI: 10.1249/MSS.0b013e3181949333
28. Menezes IH, Neutzing MB, Taddei JA. Risk factors for overweight and obesity in adolescents of a Brazilian University: a case-control study. Nutr Hosp 2009; 24(1): 17-24.
29. Sousa TF. Atividades físicas praticadas no lazer por universitários de uma instituição pública do Nordeste do Brasil. Rev Bras Ativ Fís Saúde 2012; 17(2): 125-31.
30. Savane FR, Navarrete-Muñoz EM, Hera MG, Gimenez-Monzo D, Gonzalez-Palacios S, Valera-Gran D, et al. Validez del peso y talla auto-referido en población universitaria y factores asociados a las discrepancias entre valores declarados y medidos. Nutr Hosp 2013; 28(5): 1633-8. DOI: 10.3305/nh.2013.28.5.6671
Received on: 09/17/2016