A
rt
ig
o
s
o
ri
gi
n
Ai
s
/
o
ri
gi
n
Al
A
rt
ic
le
s
Sarcopenia: evaluation of different diagnostic criteria and its
association with muscle strength and functional capacity
Sarcopenia: avaliação de diferentes critérios diagnósticos e sua associação com a força muscular e capacidade funcional
Marcelo Salame1
Karen Koff da Costa2
Lucas Venturini Zottele2
Raquel Rodrigues Muradás1
Sibelle de Almeida Tierno3
Maria Rosa Chitolina Schettinger4
Melissa Premaor5
Maristela de Oliveira Beck5
1 Universidade Federal de Santa Maria, Centro de Ciências da Saúde, Programa de Pós-graduação em
Ciências da Saúde. Santa Maria, RS, Brasil.
2 Universidade Federal de Santa Maria, Centro de Ciências da Saúde, Curso de Medicina. Santa Maria, RS,
Brasil.
3 Universidade de São Paulo, Faculdade de Medicina, Hospital das Clínicas, Programa de Residência
Médica em Geriatria. São Paulo, SP, Brasil.
4 Universidade Federal de Santa Maria, Centro de Ciências Naturais e Exatas, Departamento de Química.
Santa Maria, RS, Brasil.
5 Universidade Federal de Santa Maria, Centro de Ciências da Saúde, Departamento de Medicina Interna.
Santa Maria, RS, Brasil.
Correspondência / Correspondence
Marcelo Salame
E-mail: [email protected]
Abstract
Introduction: Sarcopenia has been associated with increased morbidity and mortality in
older people. However, there is still no consensus about the best diagnostic criteria for it.
Objective: This study aimed to evaluate different diagnostic criteria of sarcopenia and their
relationship with muscle strength and functional capacity. Methods: A cross-sectional study was carried out in Santa Maria-RS, Brazil. Body composition was measured by dual-energy X-ray absorptiometry (DXA). Physical performance was evaluated by the Timed-get-up-and-go test (TGUG). Muscle strength was measured with a handgrip dynamometer. The proposed criteria of sarcopenia were evaluated as follows: A) appendicular lean mass index (aLM/ht2), cutoffs 5.5 kg/m2, 2SD, 10th percentile, and
20th percentile of young reference; B) a linear regression model was used to adjust
appendicular lean mass (aLM) for both height and fat mass, cutoff 20th percentile of
elderly. Results: In total, 104 women agreed to participate in the research, 39 young (20 to 40 years) and 65 elderly (over 60 years). The prevalence of sarcopenia varied from 0% to 17.2% according to the diagnostic criteria. Regarding muscle strength, the aLM/ht2
cutoff 10th percentile was the criterion with greater area under the ROC curve. However,
there were no criteria with an area under the ROC curve greater than 0.5 when TGUG was the outcome. The reclassification showed that the criterion B reclassified 66.7% with normal grip strength as sarcopenic. Conclusion: Of these criteria, aLM/ht2 cutoff 10th
percentile had stronger correlation with muscle strength.
INTRODUCTION
The knowledge about sarcopenia as a syndrome has evolved in the last decades. Its association with increased morbidity and mortality is now well described.1,2 Nevertheless,
there is still no consensus about the best diagnostic criteria for sarcopenia. The first criterion, proposed by Baumgartner et al.3 in 1998, used
a young population as reference.3 According
to this criterion, an individual is classified as sarcopenic when his/her appendicular lean mass index [appendicular lean mass/height² (aLM/ ht²)] is two standard deviations below the mean appendicular lean mass index (aLM/ht²) of the young reference population.3,4 As this approach
does not correct the appendicular muscle mass for fat mass, it might underestimate the prevalence of sarcopenia in obese people. Newman et al.5
suggested the use of linear regression adjusted for fat mass to deal with this problem. It uses the 20th percentile of a linear regression residual
that includes only elderly subjects to define sarcopenia (the regression adjusts for height and total fat mass).5 Therefore the choice of the group
of reference might have considerable influence on the sarcopenia diagnosis.6,7
Despite the fact that sarcopenia is characterized by progressive and generalized loss of muscle mass and strength.2,3,5,8,9 the latter
have been rarely used to evaluate the proposed diagnostic criteria. Both The European Working Group on Sarcopenia in Old People (EWGSOP) and the International Working Group on Sarcopenia (IWG) recommend that a sarcopenia definition should incorporate the low muscle mass and low muscle strength plus (or) low physical performance.9,10 One hypothesis
is that the different diagnostic criteria might have different relationship with muscle strength and (or) physical performance. The aim of this study was to evaluate different diagnostic criteria of sarcopenia and its association with muscle strength and functional capacity.
Resumo
Introdução: Sarcopenia está associada com aumento da morbidade e mortalidade em
pessoas idosas. No entanto, ainda não existe consenso sobre o melhor critério diagnóstico para ela. Objetivo: Avaliar os diferentes critérios diagnósticos de sarcopenia e sua relação com a força muscular e capacidade funcional. Métodos: Estudo transversal realizado em Santa Maria-RS, Brasil. A composição corporal foi avaliada através de absorciometria por dupla emissão de raios-x (DXA). A capacidade funcional foi inferida por meio dos testes Timed-get-up-and-go (TGUG) e preensão manual com um dinamômetro. Os critérios de sarcopenia propostos foram: A) índice de massa muscular apendicular (aLM/ht²), pontos de corte de 5,5 kg/m2, dois desvios-padrões (dp), percentil 10 e
percentil 20 da amostra jovem de referência; B) modelo de regressão linear utilizando massa muscular apendicular (aLM) ajustado para altura e massa gorda (percentil 20 da amostra de idosos). Resultados: No total, 104 mulheres concordaram em participar da pesquisa, 39 jovens (20 a 40 anos) e 65 idosas (acima de 60 anos). A prevalência de sarcopenia variou de 0% a 17,2%, conforme o critério utilizado. Em relação à força muscular, o percentil 10th do aLM/ht² foi o critério com maior área sob a curva ROC.
No entanto, nenhum dos critérios diagnósticos para sarcopenia apresentou área sob a curva ROC maior que 0,5 quando TGUG foi utilizado. Conclusão: Dos critérios avaliados, aLM/ht2 percentil 10 apresentou melhor correlação com força muscular.
METHODS
Study design and population
A cross-sectional study was carried out in the city if Santa Maria, Southern Brazil. Women were recruited from a Catholic Parish address lists from January to March 2012. Women aged between 20 to 40 years-old and over 60 years-old were invited to participate. Subjects with rheumatoid arthritis, bowel diseases, hepatic diseases, renal failure, thyroid diseases, neurodegenerative diseases, chronic obstructive pulmonary disease, and women using steroid hormones were excluded. The study was approved in 2011 by the Ethics Committee of the University of Santa Maria, CEP registration number 0311.0.243.000-11. The study protocol was in accordance with the ethical guidelines of the 1975 Declaration of Helsinki. All individuals provided an informed consent term.
The number of subjects necessary to find an appendicular lean mass index (aLM/ht²) average of 6.1 kg/m² and a standard deviation of 0.8 kg/m² was 38.3,5 The authors established
a confidence level of 95% and a power of 90%.
Assessments
A standardized questionnaire was used to collect demographic data. Weight was measured in patients in light clothing without shoes using a balance beam scale while height was measured using a wall-mounted stadiometer. Body composition (whole body and regional measures of fat mass and lean mass) was measured by dual-energy X-ray absorptiometry (Lunar Prodigy Pro, GE Health Care, Madison, WI), according to the Official Positions of the International Society for Clinical Densitometry (ISCD).11 Participants
were asked to lie flat on the table, with arms by their side, legs straight and side by side. All metal was removed as possible. For participants too large to fit within the dimensions of the
scanning field, two hemi-scan were performed (2% of participants had a hemi-scan), one each side. The coefficients of variation (CV) were 1.3% for total body fat mass, 1.4% for total bone mineral densitometry (BMD) and 0.9% for total body lean mass. Appendicular lean mass (aLM) was measured as the sum of the lean soft-tissue masses for the arms and the legs.11
Physical performance was evaluated by the Timed get-up-and-go test (TGUG). All women were asked to sit in a 43-cm chair.12,13 The time
to get up, walk a 3-meter distance, walk back and sit again was recorded. Muscle strength was measured with a handgrip dynamometer ( Jamar Hydraulic Hand Dynamometer, Sammons Preston, Chicago, IL), according to the American Society for Hand Therapists Society recommendation.14 The test was performed in
both hands in standing position with straight back, the shoulder adducted and in neutral rotation, elbow flexed 90°, and the lower arm and wrist in the neutral position. The tests were performed three times after a learning trial and rest interval between tests was 1 minute. The cutoff suggest by the European Working Group on Sarcopenia in Older People was used (body
mass index [BMI] ≤23: ≤17 kg; 23.1< BMI ≤26: ≤17.3 kg; 26.1< BMI ≤29: ≤18 kg; BMI > 29:
≤21 kg).10 These tests were chosen because they
were easy to perform at the clinical practice.
Criteria of sarcopenia
The proposed criteria of sarcopenia were evaluated as follows: firstly, it was calculated the relative aLM using the Baumgartner formula (aLM/ht2). It was used the classical Baumgartner
definition of sarcopenia [two standard deviation (SD) [G1] and the Rosetta study reference [G2].4 As the best criterion for the Brazilian
population is unknown, it was also used the 10th percentile [G3], and 20th percentile of the
sarcopenia.3 Furthermore, aLM was calculated
adjusting for fat mass in addition to height in the elderly women, as suggested by Newman.5 A
linear regression model was used to adjust aLM for both height and fat mass. The percentile proposed by Newman (20th percentile) of the
regression residuals was used as cut-point to define sarcopenia [G5].5
Statistical analyses
The prevalence of sarcopenia was calculated using the proposed criteria. Student t test and Chi-square test were used to compare younger and elderly women. Logistic regression was used to evaluate the association between sarcopenia and muscle strength and the TGUG. The Hosmer-Lemeshow goodness-of-fit statistic and corresponding p value for each model were calculated to determine the best model. The
proposed sarcopenia definitions were compared using the ROC curve and reclassification.15
Furthermore, the prevalence of sarcopenia was calculated using the Newman 20th percentile
criterion plus muscle strength cut-off as suggested by the European consensus. Differences were found significant when the two-tailed p value
was <0.05, and confidence intervals are provided
where appropriate.
RESULTS
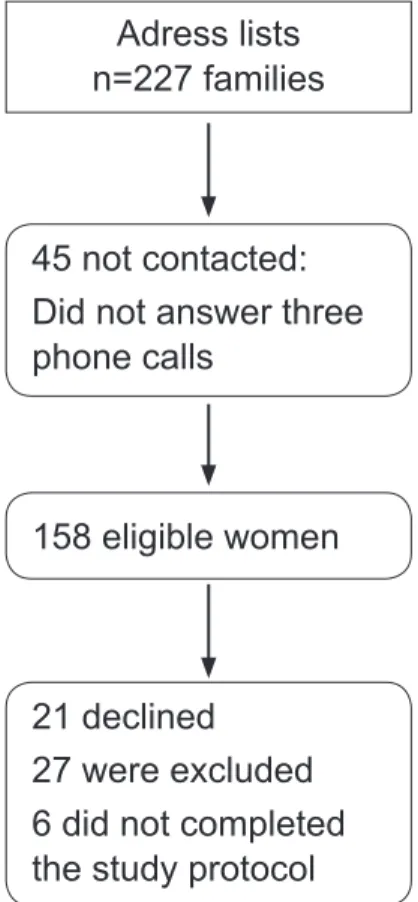
In total, 227 families were identified from the Catholic Parish address list. Of those, 177 families returned the contact. There were 158 eligible women in these families. After excluding participants who did not fulfil the research criteria, 104 women agreed to participate in the research [39 young women (age from 20 to 40 years) and 65 old women (age over 60 years)], as shown in figure 1.
Adress lists n=227 families
45 not contacted: Did not answer three phone calls
158 eligible women
21 declined 27 were excluded 6 did not completed the study protocol
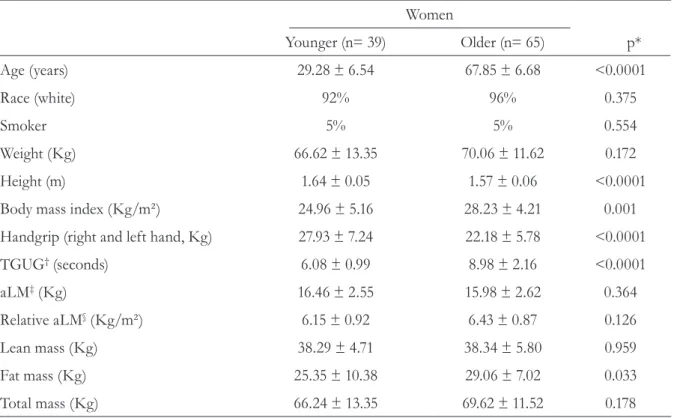
The demographic characteristics of these women are described in table 1. Young women were significantly slimmer and taller than elder women. They also have greater muscle strength
and lower TGUG time than elder women. Although fat mass was lower in young women, all other body composition parameters were no different both groups (table 1).
The cut-off of sarcopenia calculated using 2SD of the young population as suggested by Baumgartner [G1] was 4.29 kg/m2 and
the prevalence was 0%. The prevalence of sarcopenia using the Newman criterion 20th
[G2] percentile cutoff plus muscle strength cutoff as suggested by the European consensus was 10.7%. Additionally, the prevalence of sarcopenia using the cutoff of 5.67 kg/m2 plus
muscle strength as indicated by the IWG was
Table 1. Characteristics of the study population. Santa Maria-RS, 2012.
Women
Younger (n= 39) Older (n= 65) p*
Age (years) 29.28 ± 6.54 67.85 ± 6.68 <0.0001
Race (white) 92% 96% 0.375
Smoker 5% 5% 0.554
Weight (Kg) 66.62 ± 13.35 70.06 ± 11.62 0.172
Height (m) 1.64 ± 0.05 1.57 ± 0.06 <0.0001
Body mass index (Kg/m²) 24.96 ± 5.16 28.23 ± 4.21 0.001
Handgrip (right and left hand, Kg) 27.93 ± 7.24 22.18 ± 5.78 <0.0001
TGUG† (seconds) 6.08 ± 0.99 8.98 ± 2.16 <0.0001
aLM‡ (Kg) 16.46 ± 2.55 15.98 ± 2.62 0.364
Relative aLM§ (Kg/m²) 6.15 ± 0.92 6.43 ± 0.87 0.126
Lean mass (Kg) 38.29 ± 4.71 38.34 ± 5.80 0.959
Fat mass (Kg) 25.35 ± 10.38 29.06 ± 7.02 0.033
Total mass (Kg) 66.24 ± 13.35 69.62 ± 11.52 0.178
*Timed get-up-and-go test; †Timed get-up-and-go test; ‡appendicular lean mass; §appendicular lean mass/ height² (aLM/ht²).
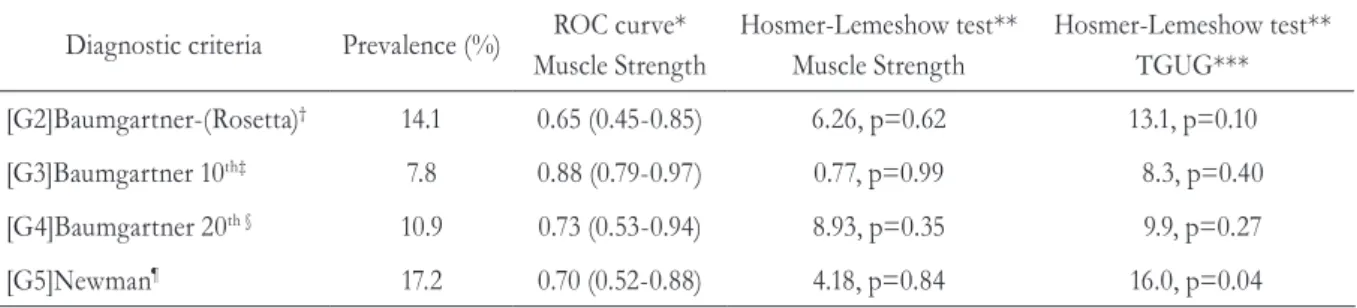
7.8% (data not shown); all other calculated frequencies are displayed in table 2.
Regarding muscle strength, the criteria that showed the greater area under the curve in the ROC analysis was the criterion proposed by Baumgartner with the 10th [G3] percentile as
In the logistic regression, the muscle strength was strongly associated to all proposed diagnostic criteria (table 3). Nevertheless, the TGUG was only associated with the modified Baumgartner (10th percentile) [G3], p<0.05
Table 2. Comparison of different diagnostic criteria of sarcopenia. Santa Maria-RS, 2012.
Diagnostic criteria Prevalence (%) ROC curve* Muscle Strength
Hosmer-Lemeshow test** Muscle Strength
Hosmer-Lemeshow test** TGUG***
[G2]Baumgartner-(Rosetta)† 14.1 0.65 (0.45-0.85) 6.26, p=0.62 13.1, p=0.10
[G3]Baumgartner 10th‡ 7.8 0.88 (0.79-0.97) 0.77, p=0.99 8.3, p=0.40
[G4]Baumgartner 20th § 10.9 0.73 (0.53-0.94) 8.93, p=0.35 9.9, p=0.27
[G5]Newman¶ 17.2 0.70 (0.52-0.88) 4.18, p=0.84 16.0, p=0.04
* Data is shown as area under the A= area under the Receiver Operating Characteristic (ROC) curve (confidence interval 95%); **data is shown as Chi-square value, pvalue;***Timed get-up-and-go test; †Baumgartner–Rosetta= Baumgartner definition of sarcopenia and the Rosetta study reference (5.5 kg/m2); ‡Baumgartner 10th= Baumgartner definition of sarcopenia and percentile 10th (5.21 kg/m2); §Baumgartner
20th= Baumgartner definition of sarcopenia and percentile 20th ( 5.67 kg/m2); Newman = 20th percentile of the regression residuals was used
as cut-point to define sarcopenia (-1.42).
Table 3. Logistic regression models using different diagnostic criteria as predictors. Santa Maria-RS, 2012.
Diagnostic criteria Muscle Strength
OR (95% CI)*
TGUG OR (95% CI)*
[G2] Baumgartner - (Rosetta)† 0.83 (0.70-0.97), p=0.02 1.24 (0.94-1.64), p=0.13
[G3] Baumgartner 10th ‡ 0.50 (0.29-0.84), p=0.01 1.45 (1.03-2.04), p=0.03
[G4] Baumgartner 20th § 0.72 (0.57-0.92), p=0.01 1.30 (0.97-1.77), p=0.07
[G5] Newman¶ 0.75 (0.61-0.91), p=0.01 1.30 (0.98-1.73), p=0.07
* Data is shown Odds Ratio (95% confidence interval); †Baumgartner – Rosetta= Baumgartner definition of sarcopenia and the Rosetta study reference (5,5 kg/m2); ‡ Baumgartner 10th= Baumgartner definition of sarcopenia and percentile 10th (5.21 kg/m2); § Baumgartner 20th=
Baumgartner definition of sarcopenia and percentile 20th (5.67 kg/m2); Newman = 20th percentile of the regression residuals was used as
cut-point to define sarcopenia (-1.42).
(table 3). The model that presented the better fit was Baumgartner with the 10thpercentile as
cutoff [G3]. The model using Baumgartner with the 10th percentile [G3] was better to predict
muscle strength (table 2).
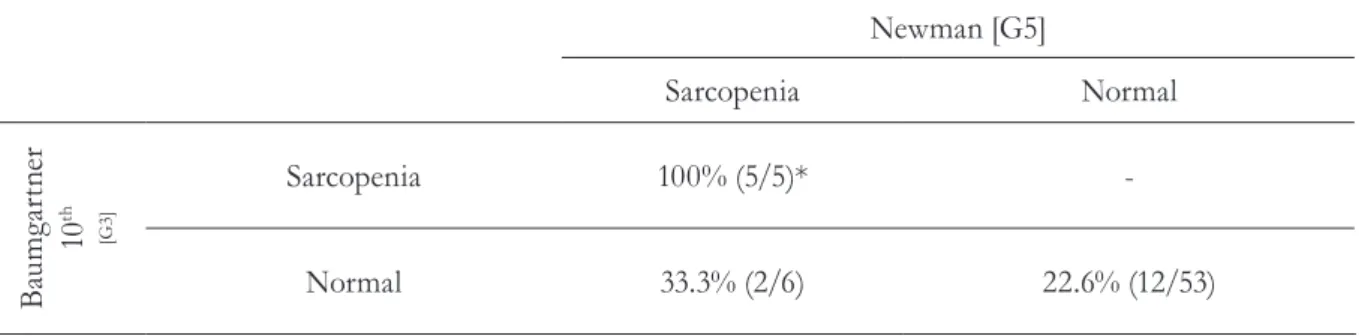
The reclassification showed that Newman criterion [G5] reclassified 66.7% of patients with normal grip strength as sarcopenic. All other diagnostic criteria agreed in relation to muscle strength and sarcopenia. Nevertheless, 20% of patients classified as non-sarcopenic criteria
Table 4. Reclassification using decreased muscle strength as outcome. Baumgartner definition of sarcopenia and percentile 10th versus Newman - 20th percentile of the regression residuals. Santa Maria-RS, 2012.
Newman [G5]
Sarcopenia Normal
B
au
m
ga
rt
ne
r
10
th
[G3
]
Sarcopenia 100% (5/5)*
-Normal 33.3% (2/6) 22.6% (12/53)
*number of subjects with decreased muscle strength / total of subjects in the stratum.
DISCUSSION
This study evaluated the ability of the different criteria and its different cutoffs predicting muscle strength or functional capacity. The results have shown that the classical Baumgartner definition of sarcopenia but with a 10th percentile cutoff [G3] presented the best
calibration and discrimination regarding muscle strength. Although all proposed criteria were apparently wellcalibrated, none of those shown a good discrimination of functional capacity evaluated by the TGUG.
Differences in prevalence of sarcopenia according to different diagnostic criteria are reinforced by our findings. The prevalence of sarcopenia in this study ranged from 0% to 17.2%, depending on the operational definition. In parallel to this study, Domiciano et al.16
have found a prevalence varying from 3.7% (using the classical Baumgartner definition with the Rosetta study4 reference) to 19.9%
(classical Newman criterion [20th percentile
cutoff ]) in 611 community-dwelling women living in Sao Paulo City, Brazil. The Fourth Korean National Health Survey has also found a prevalence ranging from 0.1% (using the classical Baumgartner definition with 2 SD cutoff ) to 11.8% (using appendicular skeletal
muscle mass adjusted by body weight) in the elderly women.17 Dam et al.18 compared nine
important cohort studies [the Framingham Heart Study Original cohort and its Offspring cohort;19,20 the Study of Osteoporotic Fractures
(SOF);21 the InCHIANTI study;22 the Rancho
Bernardo Study;23 the Health, Aging, and Body
Composition Study (HABC);24 the Osteoporotic
Fractures in Men Study (MrOS);25,26 the
Age, Gene and Environment Susceptibility-Reykjavik Study (AGES);27 and the Boston
Puerto Rican Health Study (BPRHS)28] and
six clinical trials29-34 regarding the operational
criterion agreement.18,35 They found poor
agreement (varying from 4.0% to 19.9% in women, evaluated by Cohen’s kappa test) for the positive results of the studies.18,35
In this study, the method that showed the best sensitivity and specificity for muscle strength was the classical Baumgartner definition of sarcopenia but with a 10th percentile
cutoff [G3]. Interestingly enough, no method presented sufficient sensitivity and specificity for physical performance. Although there was some early concern about the TGUG test-retest reliability36 further studies demonstrated that
TGUG is a good measure of physical capability in older adults.12,13,37-39 Nevertheless, the lack of
test has been found by others.40,41 Merriwether et
al.41 have studied 154 community-dwelling older
adults (72% women) and found no relationship between sarcopenia defined as Baumgartner suggested and physical performance.
Although the criterion suggested by Newman [G5] is useful to minimize misdiagnoses in the obese population,42 it appears to super-classify
individuals with normal muscle strength as sarcopenic in this study. Furthermore, the proportion of subjects with normal muscle strength classified as sarcopenic by this criterion was considerably high in our study. On the other hand, all other proposed criteria in the present study classified as normal (non-sarcopenic) at least 20% of individuals with diminished muscle strength. This result implies that the use of the measurement of muscle mass by densitometry method alone is insufficient to diagnose sarcopenia as suggested by EWGSOP and IWG.
This study has some limitations: firstly, the small sample size. Although it was calculated based on the average appendicular lean mass described in the previous studies,5,9 it could not
have enough power to find small differences between the criteria. Secondly, functional capacity was evaluated only by the TGUG test. It was chose the TGUG over the gait speed test because both tests appear to have the same predictive ability39 and the TGUG was considered
more feasible in clinical practice. Finally, the main restriction of our study is due to the study
design. Because of its cross-sectional nature, it can only evaluate associations. Furthermore, the outcomes such as fall, fracture, hospitalization, and/or death were not evaluated.
This study has also some strengths: the young reference population is well matched to the elderly population. To the best of the authors’ knowledge, this is the first study comparing calibration and discrimination of the diagnostic criteria of sarcopenia. These statistical procedures are important to establish the best diagnostic criterion of sarcopenia.
CONCLUSIONS
The best diagnostic criterion in this study was the criterion proposed by Baumgartner with the 10th percentile of the young women as
cutoff [G3]. Despite the fact that all diagnostic operational definitions in the present study were associated with muscle strength, recalibration showed that all of them miss subjects with decreased muscle strength. The clinical implications of these findings are not clear but some sarcopenic women may be underdiagnosed with all proposed criteria.
Large epidemiological studies that evaluate the calibration and discrimination of these diagnostic criteria on hard outcomes are needed to answer these questions.
REFERENCES
1. Bunout D, De La Maza MP, Barrera G, Leiva L, Hirsch S. Association between sarcopenia and mortality in healthy older people. Australas J Ageing. 2011;30(2):89-92.
2. Lang T, Streeper T, Cawthon P, Baldwin K, Taaffe DR, Harris TB. Sarcopenia: etiology, clinical consequences, intervention, and assessment. Osteoporosis Int 2010;21(4):543-59.
3. Baumgartner RN, Koehler KM, Gallagher D, Romero L, Heymsfield SB, Ross RR, et al. Epidemiology of sarcopenia among the elderly in New Mexico. Am J Epidemiol 1998;147(8):755-63.
4. Gallagher D, Visser M, De Meersman RE, Sepulveda D, Baumgartner RN, Pierson RN, et al. Appendicular skeletal muscle mass: effects of age, gender, and ethnicity. J Appl Physiol 1997;83(1):229-39.
5. Newman AB, Kupelian V, Visser M, Simonsick E, Goodpaster B, Nevitt M, et al. Sarcopenia: alternative definitions and associations with lower extremity function. J Am Geriatr Soc 2003;51(11):1602-9.
7. Buehring B, Krueger D, Libber J, Heiderscheit B, Sanfilippo J, Johnson B, et al. Dual-Energy X-Ray absorptiometry measured regional body composition least significant change: effect of region of interest and gender in athletes. J Clin Densitom 2012;17(1):121-8.
8. Waters DL, Baumgartner RN, Garry PJ, Vellas B. Advantages of dietary, exercise-related, and therapeutic interventions to prevent and treat sarcopenia in adult patients: an update. Clin Interv Aging 2010;5:259-70.
9. Fielding RA, Vellas B, Evans WJ, Bhasin S, Morley JE, Newman AB, et al. Sarcopenia: an undiagnosed condition in older adults. Current consensus definition: prevalence, etiology, and consequences. International working group on sarcopenia. J Am Med Dir Assoc 2011;12(4):249-56.
10. Cruz-Jentoft AJ, Baeyens JP, Bauer JM, Boirie Y, Cederholm T, Landi F, et al. Sarcopenia: European consensus on definition and diagnosis: Report of the European Working Group on Sarcopenia in older people. Age Ageing. 2010;39(4):412-23.
11. Kung AW, Wu CH, Itabashi A, Lee JK, Park HM, Zhao Y, et al. International Society for Clinical Densitometry official positions: Asia-Pacific Region consensus. J Clin Densitom 2010;13(4):346-51.
12. Kamide N, Takahashi K, Shiba Y. Reference values for the Timed Up and Go test in healthy Japanese elderly people: determination using the methodology of meta-analysis. Geriatr Gerontol Int 2011;11(4):445-51.
13. Cooper C, Dere W, Evans W, Kanis JA, Rizzoli R, Sayer AA, et al. Frailty and sarcopenia: definitions and outcome parameters. Osteoporosis Int 2012;23(7):1839-48.
14. Fess EE. Guidelines for Evaluating Assessment Instruments. J Hand Ther 1995;8(2):144-8.
15. Cook NR. Statistical evaluation of prognostic versus diagnostic models: beyond the ROC curve. Clin Chem 2008;54(1):17-23.
16. Domiciano DS, Figueiredo CP, Lopes JB, Caparbo VF, Takayama L, Menezes PR, et al. Discriminating sarcopenia in community-dwelling older women with high frequency of overweight/obesity: the Sao Paulo Ageing & Health Study (SPAH). Osteoporosis Int 2013;24(2):595-603.
17. Kim YS, Lee Y, Chung YS, Lee DJ, Joo NS, Hong D, et al. Prevalence of sarcopenia and sarcopenic obesity in the Korean population based on the Fourth Korean National Health and Nutritional Examination Surveys. J Gerontol Ser A Biol Sci Med Sci 2012;67(10):1107-13.
18. Dam TT, Peters KW, Fragala M, Cawthon PM, Harris TB, McLean R, et al. An evidence-based comparison of operational criteria for the presence of sarcopenia. J Gerontol Ser A Biol Sci Med Sci 2014;69(5):584-90
19. Kannel WB, Feinleib M, McNamara PM, Garrison RJ, Castelli WP. An investigation of coronary heart disease in families. The Framingham offspring study. Am J Epidemiol 1979;110(3):281-90.
20. Dawber TR, Meadors GF, Moore FE Jr. Epidemiological approaches to heart disease: the Framingham Study. Am J Public Health Nations Health 1951;41(3):279-81.
21. Cauley JA, Lui LY, Ensrud KE, Zmuda JM, Stone KL, Hochberg MC, et al. Bone mineral density and the risk of incident nonspinal fractures in black and white women. JAMA 2005;293(17):2102-8.
22. Ferrucci L, Bandinelli S, Benvenuti E, Di Iorio A, Macchi C, Harris TB, et al. Subsystems contributing to the decline in ability to walk: bridging the gap between epidemiology and geriatric practice in the InCHIANTI study. J Am Geriatr Soc 2000;48(12):1618-25.
23. Castillo EM, Goodman-Gruen D, Kritz-Silverstein D, Morton DJ, Wingard DL, Barrett-Connor E. Sarcopenia in elderly men and women: the Rancho Bernardo study. Am J Prev Med 2003;25(3):226-31.
24. Newman AB, Haggerty CL, Goodpaster B, Harris T, Kritchevsky S, Nevitt M, et al. Strength and muscle quality in a well-functioning cohort of older adults: the Health, Aging and Body Composition Study. J Am Geriatr Soc 2003;51(3):323-30.
25. Blank JB, Cawthon PM, Carrion-Petersen ML, Harper L, Johnson JP, Mitson E, et al. Overview of recruitment for the osteoporotic fractures in men study (MrOS). Contemp Clin Trials 2005;26(5):557-68.
26. Orwoll E, Blank JB, Barrett-Connor E, Cauley J, Cummings S, Ensrud K, et al. Design and baseline characteristics of the osteoporotic fractures in men (MrOS) study--a large observational study of the determinants of fracture in older men. Contemp Clin Trials 2005;26(5):569-85.
27. Harris TB, Launer LJ, Eiriksdottir G, Kjartansson O, Jonsson PV, Sigurdsson G, et al. Age, Gene/ Environment Susceptibility-Reykjavik Study: multidisciplinary applied phenomics. Am J Epidemiol 2007;165(9):1076-87.
29. Prestwood KM, Kenny AM, Kleppinger A, Kulldorff M. Ultralow-dose micronized 17beta-estradiol and bone density and bone metabolism in older women: a randomized controlled trial. JAMA 2003;290(8):1042-8.
30. Kenny AM, Prestwood KM, Gruman CA, Marcello KM, Raisz LG. Effects of transdermal testosterone on bone and muscle in older men with low
bioavailable testosterone levels. J Gerontol Ser A Biol Sci Med Sci 2001;56(5):266-72.
31. Kenny AM, Boxer RS, Kleppinger A, Brindisi J, Feinn R, Burleson JA. Dehydroepiandrosterone combined with exercise improves muscle strength and physical function in frail older women. J Am Geriatr Soc 2010;58(9):1707-14.
32. Kenny AM, Biskup B, Robbins B, Marcella G, Burleson JA. Effects of vitamin D supplementation on strength, physical function, and health perception in older, community-dwelling men. J Am Geriatr Soc 2003;51(12):1762-7.
33. Judge JO, Kleppinger A, Kenny A, Smith JA, Biskup B, Marcella G. Home-based resistance training improves femoral bone mineral density in women on hormone therapy. Osteoporosis Int 2005;16(9):1096-1108.
34. Hutchins-Wiese HL, Kleppinger A, Annis K, Liva E, Lammi-Keefe CJ, Durham HA, et al. The impact of supplemental n-3 long chain polyunsaturated fatty acids and dietary antioxidants on physical performance in postmenopausal women. J Nutr Health Aging 2013;17(1):76-80.
35. Studenski SA, Peters KW, Alley DE, Cawthon PM, McLean RR, Harris TB, et al. The FNIH sarcopenia
project: rationale, study description, conference recommendations, and final estimates. J Gerontol Ser A Biol Sci Med Sci 2014;69(5):547-58.
36. Rockwood K, Awalt E, Carver D, MacKnight C. Feasibility and measurement properties of the functional reach and the timed up and go tests in the Canadian study of health and aging. J Gerontol Ser A Biol Sci Med Sci 2000;55(2):70-3.
37. Podsiadlo D, Richardson S. The timed "Up & Go": a test of basic functional mobility for frail elderly persons. J Am Geriatr Soc 1991;39(2):142-8.
38. Herman T, Giladi N, Hausdorff JM. Properties of the 'timed up and go' test: more than meets the eye. Gerontology 2011;57(3):203-10.
39. Viccaro LJ, Perera S, Studenski SA. Is timed up and go better than gait speed in predicting health, function, and falls in older adults? J Am Geriatr Soc 2011;59(5):887-92.
40. Woods JL, Iuliano-Burns S, King SJ, Strauss BJ, Walker KZ. Poor physical function in elderly women in low-level aged care is related to muscle strength rather than to measures of sarcopenia. Clin Interv Aging 2011;6:67-76.
41. Merriwether EN, Host HH, Sinacore DR. Sarcopenic indices in community-dwelling older adults. J Geriatr Phys Ther 2012;35(3):118-25.
42. Delmonico MJ, Harris TB, Lee JS, Visser M, Nevitt M, Kritchevsky SB, et al. Alternative definitions of sarcopenia, lower extremity performance, and functional impairment with aging in older men and women. J Am Geriatr Soc 2007;55(5):769-74.