Licence Creative Commom
CC
BY
RBCDH
1 State University of Southwest Bahia. Center for Research on Epidemiology of Aging. Jequié, BA. Brazil.
Received: 27 October 2014 Accepted: 14 January 2015
Prevalence and factors associated with
sarcopenia in elderly women living in the
community
Prevalência e fatores associados a sarcopenia em
mulheres idosas residentes em comunidade
haliany Dutra ¹
Paloma Andrade Pinheiro ¹ José Ailton Oliveira Carneiro ¹ Raildo da Silva Coqueiro ¹ Marcos Henrique Fernandes ¹
Abstract– he objective of this study was to identify the prevalence of sarcopenia and factors associated with it in a population of elderly women living in the community in the Northeast of Brazil. his was a cross-sectional study of 173 women aged 60 years or older living in the urban zone of the municipality of Lafaiete Coutinho, Bahia, Brazil. Associations between sarcopenia (deined as reduced muscle mass plus reduced muscle strength and/or reduced muscle performance) and independent variables including sociodemographic characteristics, behavioral variables and health status were tested using logistic regression techniques. he signiicance level was set at 5%. he prevalence of sarcopenia in the study population was 17.8%. he logistic regression technique only identiied the variables advanced age (p = 0.005) and hospital admission during the pre-vious 12 months (p = 0.009) as statistically signiicant. It was concluded that there was a signiicant prevalence of sarcopenia among elderly women resident in a community with unfavorable health conditions and the indings showed that the strongest associations were with age over 80 years and hospital admission during the previous 12 months.
Key words: Aging; Health of the elderly; Sarcopenia; Women.
INTRODUCTION
he aging process triggers changes to body composition that are relected
in increased fat mass and reduced muscle mass1. he resulting progressive
and generalized loss of skeletal musculature, strength and physical
per-formance characterize sarcopenia2, which is a syndrome that predisposes
people to adverse consequences such as declining functional capacity3 and
even increased risk of death4. In view of this, aging-induced sarcopenia
is considered a risk factor for fragility and reduced functionality and its high prevalence means it is seen as an important public health problem.
here are a variety of methods for inferring the degree of sarcopenia in elderly people, ranging from imaging exams to tests of motor performance and the resulting estimates of prevalence vary depending on the criterion
employed5. A recently-published study conducted to estimate the prevalence
of sarcopenia in the 60 to 70-year-old population of the United Kingdom
reported that 6.8% had sarcopenia5. A cross-sectional study undertaken
in the United States by Melton et al. reported rates varying from 6% to 15% among participants aged 65 or older and showed that the rate was
dependent on the parameter employed to diagnose sarcopenia6. Studies
conducted in Brazil, also with elderly people, found that 34%7 and 15.9%8 of
these individuals had sarcopenia. Against this background, the consensus on deinition and diagnosis criteria developed by the European Working
Group on Sarcopenia2 stands out as ofering a deinition of practical clinical
criteria based on just three elements, muscle mass, muscle strength and performance, thus facilitating its application to epidemiological studies.
Considering the high prevalence of sarcopenia, the important
impli-cations of the pathology for elderly individuals9 and the high cost of its
consequences, studies of this type should help to monitor the phenomenon in communities living in unfavorable conditions for health and for qual-ity of life. To date, there have been few investigations of the prevalence of sarcopenia and its determinants in Latin American countries that have
employed the criteria laid out in the European Consensus2. he results
of a literature search indicate that just two studies have been conducted
employing representative samples from countries in the region10,11. he irst
is a study conducted by Arango-Lopera et al.10, using data from a Mexican
population to estimate the prevalence of sarcopenia in elderly people aged
70 or older. he second was carried out by Alexandre et al.11 using data
from the Health, Wellbeing and Aging study (SABE - Saúde, Bem-Estar e
Envelhecimento) to estimate the prevalence of sarcopenia and factors as-sociated with it in elderly people from a large city in Brazil.
METHODOLOGICAL PROCEDURES
his was an observational analytical study with a cross-sectional design analyzing data from an epidemiological population study with data col-lection by home visits that investigated the nutritional status, risk behav-iors and health status of the elderly population in Lafaiete Coutinho, BA,
Brazil (Estado nutricional, comportamentos de risco e condições de saúde
dos idosos de Lafaiete Coutinho-BA). Details of the location, study
popula-tion and data collecpopula-tion methodology have been published elsewhere. 12
Briely, the study population comprised all women aged ≥ 60 years residing in the urban zone of the municipality (n = 195). Of this population of 195 elderly women, 173 (88.7%) took part in the study, 10 refused (5.1%) and 12 (6.2%) were not located ater three home visits, on alternate days, and were considered lost to the sample.
he study was designed and conducted in compliance with the World Medical Association’s Helsinki Declaration and was approved by the Hu-man Research Ethics Committee at the Universidade Estadual do Sudoeste da Bahia (protocol 064/2010).
Sarcopenia (dependent variable)
Sarcopenia was estimated using the criteria set out in the European
consen-sus on deinition and diagnosis2, which recommends using three elements:
muscle mass, muscle strength and physical performance. In this study, muscle mass was estimated using an anthropometric equation; muscle strength was assessed using the handgrip strength test (HST); and physical performance was measured by gait velocity.
Muscle mass component: total muscle mass (TMM) was estimated using
an equation originally proposed by Lee et al.13 and later validated for use
with elderly Brazilians14: TMM (kg) = (0.244 x body mass) + (7.8 x height)
- (0.098 x age) + (6.6 x sex) + (ethnicity - 3.3). he variables are represented by the following values: 1 = male and 0 = female; ethnicity: 0 = white (white, indigenous, and mixed race white with indigenous), -1.2 = Asian and 1.4 = African Brazilian (black and mixed race including black). Ethnicity was self-reported and the procedures and the instruments employed to measure
body mass (kg) and height (m) have been described elsewhere12.
he TMM result was used to calculate a muscle mass index (MMI
= muscle mass total/height2), which was then classiied according to the
cutof points proposed by Janssen et al.15: MMI ≤ 5.75 kg/m2 = high risk;
5.76 < MMI ≤ 6.75 kg/m2 = moderate risk; MMI > 6.75 = low risk. For the purposes of analysis, MMI was recategorized as a dichotomous vari-able: MMI ≤ 6.75 kg/m2 = insuicient muscle mass; MMI > 6.75 kg/m2 = adequate muscle mass.
Muscle strength component: Muscle strength was assessed using a handgrip strength test, the instruments and procedures for which have
been described elsewhere16. Weakness was deined according to the body
from work by Fried et al.17 First BMI was classiied into three categories18:
< 22 kg/m2 = underweight; 22.0 ≤ BMI ≤ 27 kg/m2 = healthy weight; > 27
kg/m2 = overweight. For each category the HST cutof point (in kg) for
weakness was ixed at the 25th percentile, as follows: underweight, HST = 11 kg; healthy weight, HST = 21 kg; and overweight, HST = 14 kg. In-dividuals who met the weakness criterion and those who were unable to perform the test because of physical limitations were considered to have insuicient muscle strength.
Physical performance component: Physical performance was assessed using a 2.44 m walking test, the procedures for which have been described
elsewhere16. Poor performance was deined according to height, which was
classiied into one of two categories using a criterion adapted from work
by Guralnik et al.19 First the sample was divided according to median the
height of 1.49 m (the 50th percentile, i.e. ≤ 1.49 m = less than or equal to the median; > 1.49 m = greater than the median). Next the 75th percentile of the distribution of gait results was calculated for each category (the third quartile) and used as the cutof point, as follows: ≤ median height = 6 seconds; > median height = 4 seconds. Individuals who met the cri-terion for poor performance and those who were unable to perform the tests because of physical limitations were deined as having insuicient physical performance.
Outcome: Ater each of the three components had been measured, the
elderly women were initially classiied as follows2: free from sarcopenia =
adequate muscle mass, adequate muscle strength and adequate physical performance; pre-sarcopenia = insuicient muscle mass, but adequate mus-cle strength and adequate physical performance; sarcopenia = insuicient muscle mass plus either insuicient muscle strength or insuicient physical performance; and severe sarcopenia = insuicient muscle mass plus both insuicient muscle strength and insuicient physical performance. For the purposes of analysis, sarcopenia was then recategorized as a dichotomous variable: free from sarcopenia + pre-sarcopenia = no sarcopenia; sarcopenia + severe sarcopenia = sarcopenia.
Independent variables
he sociodemographic characteristics collected included age (60-69, 70-79 and ≥ 80 years), literacy suicient to read and write a message (yes or no), marital status (has partner or single) and participation in religious activities (yes or no).
Behavioral characteristics included consumption of alcoholic bever-ages (≤ 1 day/week or > 1 day/week), smoking (never smoked, ex-smoker or smoker) and habitual physical activity level, assessed by the International
Physical Activity Questionnaire (IPAQ), long form20 (≥ 150 minutes of
moderate or vigorous physical activity per week = active and < 150 minutes per week = insuiciently active).
hyper-tension, diabetes, cancer (except tumors of the skin), chronic pulmonary disease, heart disease, circulatory diseases, rheumatic diseases and osteopo-rosis; hospital admissions during the previous year (none or one or more); number of medications currently taking (one or none versus two or more); depressive symptoms, assessed using the short form, 15-item Geriatric
Depression Scale (GDS)21 (≤ 5 points = free from depressive symptoms and
> 5 points = presence of depressive symptoms); falling episodes during the previous year (yes or no); and functional capacity, measured using the Katz et
al.22 scale, which assesses activities of daily living (ADLs) related to self-care
such as feeding, washing and dressing oneself, grooming and toilet hygiene.
he variable ADLs was dichotomized23, using the cutof point 4/5, so that
elderly people were deined as dependent in terms of ADLs if they scored four points or less and independent if they scored more than four points.
Statistical procedures
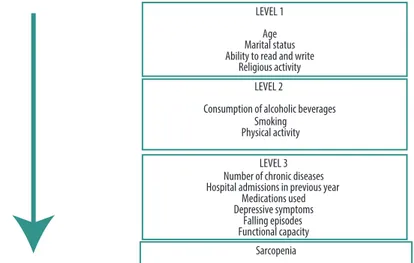
Variables were initially subjected to descriptive analysis. Associations between sarcopenia and explanatory (independent) variables were tested by calculating crude and adjusted odds ratios, by points and by 95% con-idence intervals (95%CI), using logistic regression modeling. In the crude analyses, the prevalence of sarcopenia was calculated for each category of explanatory variables and the signiicance level was tested using the Wald test of heterogeneity. Variables that exhibited statistical signiicance to at least 20 % (p ≤ 0.20) in the crude analyses were included in the adjusted analysis, following the sequence of a hierarchical model for determination of the outcome (Figure 1). In this model, the higher level variables (distal) interact with and determine the lower level variables (proximal). he efect of each explanatory variable on the outcome was controlled by the other variables at the same level and by higher levels in the model. he statistical criterion for retention in the model was 20 % (p ≤ 0.20). he signiicance level adopted for the study was 5% (α = 0.05). Data were tabulated and analyzed using IBM SPSS Statistics for Windows (IBM SPSS. 21.0, 2012, Armonk, NY: IBM Corp.).
RESULTS
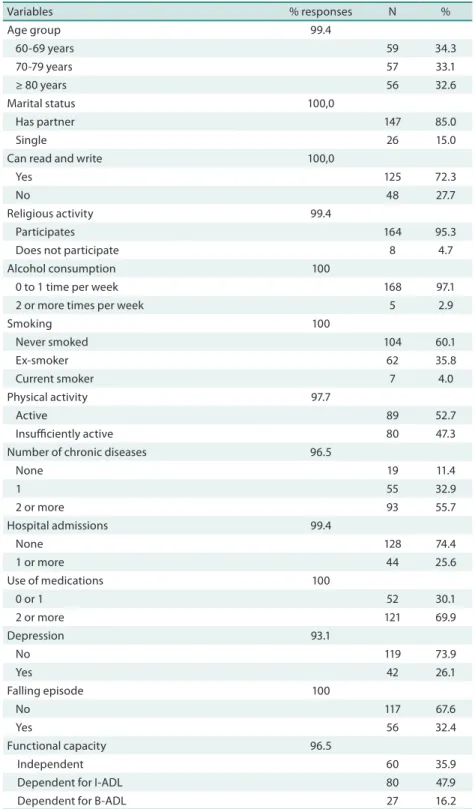
A total of 173 women with mean age of 74.8 ± 9.9 (range: 60 to 103 years) took part in the study. Of these women, 49.7% did not have healthy weight, 47.3% were sedentary and more than 60% were dependent for at least one activity of daily living. he other characteristics of the study population are shown in Table 1.
Table 1. Characteristics of the population. Lafaiete Coutinho, Brazil, 2011.
Variables % responses N %
Age group 99.4
60-69 years 59 34.3
70-79 years 57 33.1
≥ 80 years 56 32.6
Marital status 100,0
Has partner 147 85.0
Single 26 15.0
Can read and write 100,0
Yes 125 72.3
No 48 27.7
Religious activity 99.4
Participates 164 95.3
Does not participate 8 4.7 Alcohol consumption 100
0 to 1 time per week 168 97.1 2 or more times per week 5 2.9
Smoking 100
Never smoked 104 60.1
Ex-smoker 62 35.8
Current smoker 7 4.0
Physical activity 97.7
Active 89 52.7
Insuiciently active 80 47.3 Number of chronic diseases 96.5
None 19 11.4
1 55 32.9
2 or more 93 55.7
Hospital admissions 99.4
None 128 74.4
1 or more 44 25.6
Use of medications 100
0 or 1 52 30.1
2 or more 121 69.9
Depression 93.1
No 119 73.9
Yes 42 26.1
Falling episode 100
No 117 67.6
Yes 56 32.4
Functional capacity 96.5
Independent 60 35.9
Dependent for I-ADL 80 47.9 Dependent for B-ADL 27 16.2
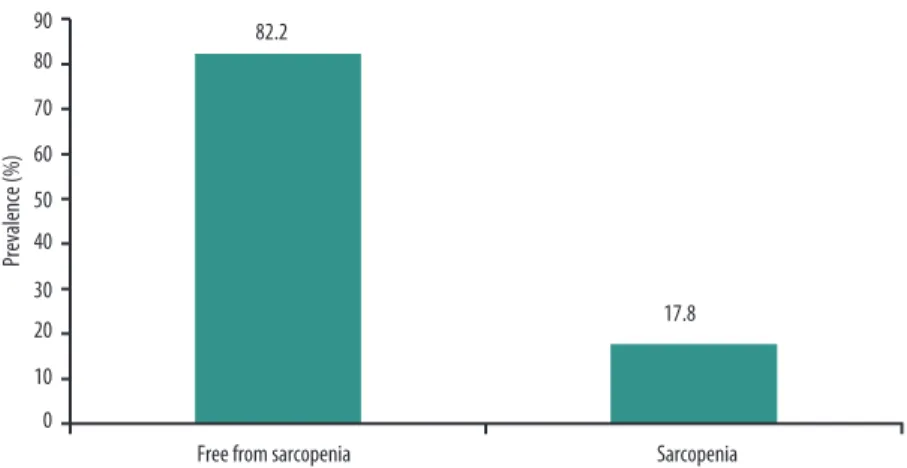
Figure 2 illustrates the prevalence of elderly women with and without sarcopenia. he analyses of sarcopenia prevalence were conducted with the results for 146 elderly women (84.4% of the sample), which is the number of participants for whom all information needed to calculate the variable sarcopenia. It will be observed that there was a 17.8% prevalence of sarco-penia among these elderly women.
Figure 2. Prevalence of sarcopenia among women elderly. Lafaiete Coutinho, Brazil, 2011.
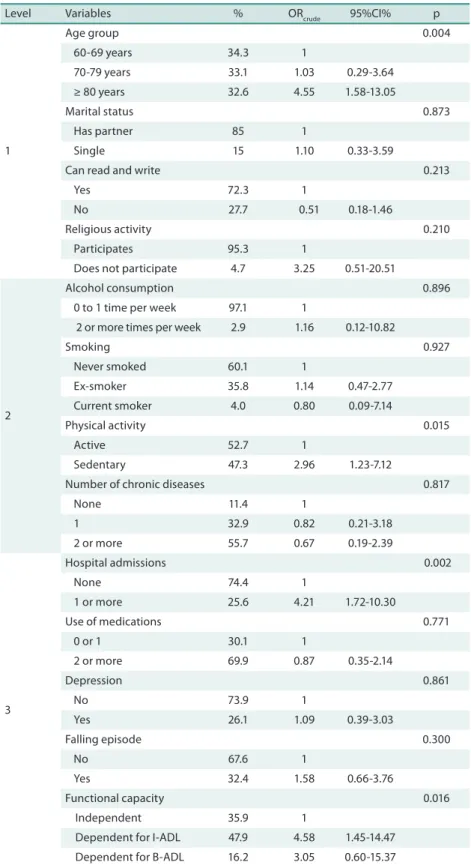
Table 2 shows the prevalence of sarcopenia according to the explanatory variables investigated. It will be observed that elderly women aged ≥ 80 years, those who were insuiciently active, those who had been admitted to hospital at least once and those who exhibited functional dependence were all more likely to be sarcopenic.
he results of the crude regression analysis show that just four variables (age group, physical activity, hospital admissions and functional capacity) attained suicient statistical signiicance (p ≤ 0.20) to be included in the multiple model.
Table 2. Prevalence of sarcopenia and its relationship to the explanatory variables investigated. Lafaiete Coutinho, Brazil, 2011.
Level Variables % ORcrude 95%CI% p
1
Age group 0.004
60-69 years 34.3 1
70-79 years 33.1 1.03 0.29-3.64 ≥ 80 years 32.6 4.55 1.58-13.05
Marital status 0.873
Has partner 85 1
Single 15 1.10 0.33-3.59
Can read and write 0.213
Yes 72.3 1
No 27.7 0.51 0.18-1.46
Religious activity 0.210 Participates 95.3 1
Does not participate 4.7 3.25 0.51-20.51
2
Alcohol consumption 0.896 0 to 1 time per week 97.1 1
2 or more times per week 2.9 1.16 0.12-10.82
Smoking 0.927
Never smoked 60.1 1
Ex-smoker 35.8 1.14 0.47-2.77 Current smoker 4.0 0.80 0.09-7.14
Physical activity 0.015
Active 52.7 1
Sedentary 47.3 2.96 1.23-7.12
Number of chronic diseases 0.817
None 11.4 1
1 32.9 0.82 0.21-3.18 2 or more 55.7 0.67 0.19-2.39
3
Hospital admissions 0.002
None 74.4 1
1 or more 25.6 4.21 1.72-10.30
Use of medications 0.771 0 or 1 30.1 1
2 or more 69.9 0.87 0.35-2.14
Depression 0.861
No 73.9 1
Yes 26.1 1.09 0.39-3.03
Falling episode 0.300
No 67.6 1
Yes 32.4 1.58 0.66-3.76
Functional capacity 0.016 Independent 35.9 1
Dependent for I-ADL 47.9 4.58 1.45-14.47 Dependent for B-ADL 16.2 3.05 0.60-15.37
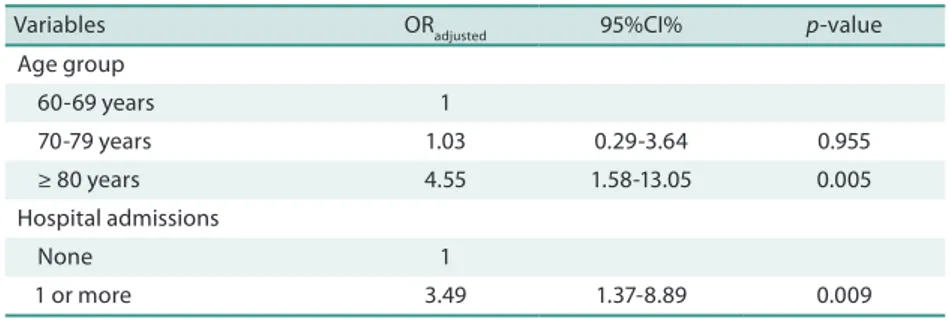
Table 3. Hierarchical logistic regression model of the relationship between sarcopenia and the explanatory variables investigated. Lafaiete Coutinho, Brazil, 2011.
Variables ORadjusted 95%CI% p-value Age group
60-69 years 1
70-79 years 1.03 0.29-3.64 0.955 ≥ 80 years 4.55 1.58-13.05 0.005 Hospital admissions
None 1
1 or more 3.49 1.37-8.89 0.009
OR – Odds Ratio; CI – Conidence interval.
DISCUSSION
he results of this study show that sarcopenia was present in approximately 18% of the elderly women studied, and indicate that it was positively as-sociated with age greater than or equal to 80 years and hospital admission during the previous 12 months.
Other studies that have been conducted to estimate the prevalence of
sarcopenia using the EWGSOP2 criteria (the same criteria used in the present
study) have reported prevalence rates that contrast with those observed
here. A study conducted by Patel et al.5 used skin folds to estimate body
composition and estimated a prevalence of approximately 8% among elderly
women, while Arango-Lopera et al.10 found a prevalence of 48.5% using calf
circumference. he diferences in prevalence may be because an MMI was used in the present study to estimate body composition. A similar prevalence
of sarcopenia was reported in the results of a study by Alexandre et al.11
where prevalence was approximately 16%. In that study the same criteria were used, but the sample was larger and the design included intervention.
Prevalence rates vary from 33% among elderly Spanish women24,
through 19.84% in elderly Italian women4 to 7.9% among women from
England5. Depending on the technique employed in the diferent
stud-ies and the cutof values chosen, the proportion of muscle mass can vary considerably. As a result, comparison of prevalence rates is problematic because of the lack of consensus and because of population variations and
methodological diferences in the criteria used to diagnose sarcopenia25.
Another very important point is that the study population has a low
Human Development Index (which was 0.599 in 201026), high mortality
rates and low educational levels, which distinguishes it from the studies mentioned above that investigated populations in developed countries, par-ticularly in terms of the unfavorable conditions of health and quality of life.
Sarcopenia was positively associated with age ≥ 80 years, which is in line with results that can be found in the literature, such as those from a
study by Iannuzzi-Sucich et al.27, who found that sarcopenia prevalence
increased from 22.6% to 31.0% among women over 80 years of age. here
is also a similarity with a study by Alexandre et al.11, since age was
sarcopenia increased from 70 years of age onwards, whereas in Lafaiete Coutinho it increased from 80 years of age onwards.
he association between sarcopenia and advanced age brings with it discussions related to the process of muscle degeneration as a consequence of senescence. During aging the muscle structure becomes disorganized and there is a substantial loss of lean mass, in terms of both number and
size of muscle ibers15. his process takes place because skeletal muscle loses
a large proportion of its ibers from 65 years of age onwards, reducing its
mass, strength and contractile force28.
Analysis of the relationship between sarcopenia and hospital
admis-sions detected a positive association. Alva et al.29 conducted a study in
which 27.2% of women classiied as malnourished had been admitted to hospital more than three times during the previous year, whereas those with normal weight had not been admitted. Although the total length of hospital stays was not analyzed, these results suggest that bedridden people are at greater risk of the syndrome. here are few studies in the literature that show this association. However, a study published by Sayer explains that the link between inactivity and the consequent loss of muscle mass is
predictive of sarcopenia30.
his study is subject to certain limitations that should be mentioned. hese include the cross-sectional design, which means that measurement of these people’s status in terms of exposure and efects over the long term was not possible. Additionally, while the methodology employing equations to accomplish measurements facilitates diagnosis it does not ofer the same degree of accuracy as imaging exams.
CONCLUSIONS
Based on the results of this study, it can be concluded that: (i) the prevalence of sarcopenia among elderly women resident in the community in a town in Northeast Brazil was 17.8%; (ii) age ≥ 80 years and hospital admission during the previous 12 months appear to be the most important determi-nants of sarcopenia in this population.
As such, the indings of this study provide a guide for identiication of subgroups at risk of sarcopenia by means of analysis of the factors as-sociated with it and ofer a foundation for planning measures to prevent functional limitations or to help reverse them in elderly women, thereby helping to provide integrated care for these people.
REFERENCES
1. Gobbo LA, Dourado DAQS, Almeida MF, Duarte YAO, Lebrão ML, Marucci MFN.
Skeletal-muscle mass of São Paulo city elderly – SABE Survey: Health , Well-being and Aging. Rev Bras Cineantropom Desempenho Hum 2012; 14(1):1-10.
2. Cruz-Jentot AJ, Baeyens JP, Bauer JM, Boirie Y, Cederholm T, Landi F, et al.
3. Carmeli E, Imam B, Merrick J. he relationship of pre-sarcopenia (low muscle mass) and sarcopenia (loss of muscle strength) with functional decline in individuals with intellectual disability (ID). Arch Gerontol Geriatr 2012; 55(1):181-5.
4. Landi F, Cruz-Jentot AJ, Liperoti R, Russo A, Giovannini S, Tosato M, et al. Sarco-penia And Mortality Risk In Frail Older Persons Aged 80 Years And Older: Results From Ilsirente Study. Age Ageing 2013; 42(2):203–9.
5. Patel HP, Syddall HE, Jameson K, Robinson S, Denison H, Roberts HC, et al.
Prevalence of sarcopenia in community-dwelling older people in the UK using the European Working Group on Sarcopenia in Older People (EWGSOP) dei-nition: indings from the Hertfordshire Cohort Study (HCS). Age Ageing 2013; 42(3):378–84.
6. Melton LJ 3rd, Khosla S, Crowson CS, O’Connor MK, O’Fallon WM, Riggs BL.
Epidemiology of sarcopenia. J Am Geriatr Soc 2000;48(6):625-30.
7. Castro EA, Lima LM, Cerqueira MS, Gobbi S, Doimo LA. Sarcopenia and
car-diovascular risk in physically active adult and elderly women. Motriz: J Phys Ed 2014; 20(1):92-9.
8. Oliveira RJ, Bottaro M, Mota AM, Pitanga F, Guido M, Leite TK, et al.
Associa-tion between sarcopenia-related phenotypes and aerobic capacity indexes of older women. J Sport Sci Med 2009; 8(3):337-43.
9. Fielding RA, Vellas B, Evans WJ, Bhasin S, Morley JE, Newman AB, et al.
Sarco-penia: an undiagnosed condition in older adults. Current consensus deinition: prevalence, etiology, and consequences. International working group on sarcopenia. J Am Med Dir Assoc 2011; 12(4):249-56.
10. Arango-Lopera VE, Arroyo P, Gutiérrez-Robledo LM, Pérez-Zepeda MU.
Preva-lence of sarcopenia in Mexico City. Eur Geriatr Med 2012; 3(3):157–60.
11. Alexandre TS, Duarte YAO, Santos JLF, Wong R, Lebrão ML. Prevalence and
as-sociated factors of sarcopenia among elderly in Brazil: indings from the sabe study. J Nutr Health Aging 2014; 18(3):284-90.
12. Leal Neto JS, Coqueiro RS, Freitas RS, Fernandes MH, Oliveira DS, Barbosa AR.
Anthropometric indicators of obesity as screening tools for high blood pressure in the elderly. Int J Nurs Pract 2013; 19(4):360-7.
13. Lee RC, Wang Z, Heo M, Ross R, Janssen I, Heymsield SB. Total-body skeletal
muscle mass: development and cross-validation of anthropometric prediction models. Am J Clin Nutr 2000; 72(3):796-803.
14. Rech CR, Dellagrana RA, Marucci MFN, Petroski EL. Validity of anthropometric
equations for the estimation of muscle mass in the elderly. Rev Bras Cineantropom Desempenho Hum 2012; 14(1):23-31.
15. Janssen I, Baumgartner RN, Ross R, Rosenberg IH, Roubenof R. Skeletal muscle
cutpoints associated with elevated physical disability risk in older men and women. Am J Epidemiol 2004; 159(4): 413-21.
16. Pinheiro PA, Passos TDO, Coqueiro RS, Fernandes MH, Barbosa AR. Motor
per-formance of the elderly in northeast Brazil: diferences with age and sex. Rev Esc Enferm USP 2013; 47(1): 125-33.
17. Fried LP, Tangen CM, Walston J, Newman AB, Hirsch C, Gottdiener J, et al.
Frailty in older adults: evidence for a phenotype. J Gerontol A Biol Sci Med Sci 2001; 56(3): 146-56.
18. American Academy of Family Physicians, American Dietetic Association, National
Council on the Aging. Nutrition screening e intervention resources for healthcare professionals working with older adults. Nutrition Screening Initiative. Washington: American Dietetic Association 2002. Disponível em: <http://www.eatright.org/ cps/rde/xchg/ada/hs.xsl/nutrition_nsi_enu_html.htm>. Acesso em: 17 fev 2013.
19. Guralnik JM, Simonsick EM, Ferrucci L, Glynn RJ, Berkman LF, Blazer DG, et al.
Corresponding author
Marcos Henrique Fernandes. Universidade Estadual do Sudoeste da Bahia.
Núcleo de Estudos em Epidemiologia do Envelhecimento.
Rua José Moreira Sobrinho, s/nº - Jequiezinho.
CEP 45206-190 – Jequié, Bahia, Brasil. Email: marcoshenriquefernandes@ bol.com.br
20. Craig CL, Marshall AL, Sjöström M, Bauman AE, Booth ML, Ainsworth BE, et al.
International physical activity questionnaire: 12-country reliability and validity. Med Sci Sports Exerc. 2003;35(8):1381-95.
21. Almeida OP, Almeida SA. Coniabilidade da versão brasileira da escala de depressão em geriatria (GDS) versão reduzida. Arq Neuropsiquiatr 1999; 57(2B): 421-6.
22. Katz S, Ford AB, Moskowitz RW, Jackson BA, Jafe MW. Studies of illness in the
aged. he index of ADL: a standardized measure of biological and psychosocial function. JAMA 1963; 185(12):914-9.
23. Duarte YAO, Andrade CL, Lebrão ML. O Índex de Katz na avaliação da
funcion-alidade dos idosos. Rev Esc Enferm USP 2007; 41(2): 317-25.
24. Masanes F, Culla A, Navarro-Gonzalez M, Navarro-Lopez M, Sacanella E, Torres B,
et al. Prevalence of sarcopenia in healthy community-dwelling elderly in an urban area of Barcelona (Spain). J Nutr Health Aging 2012; 16(2):184–7.
25. Bijlsma AY, Meskers CG, Ling CH, Narici M, Kurrle SE, Cameron ID, et al.
De-ining sarcopenia: the impact of diferent diagnostic criteria on the prevalence of sarcopenia in a large middle aged cohort. Age 2012; 35(3):871-81.
26. Instituto Brasileiro de Geograia e Estatística. Acessado em 20.09.2014. Disponível: http://www.cidades.ibge.gov.br/xtras/temas.php?lang=&codmun=291870&idte ma=118&search=bahia|lafaiete-coutinho|%C3%8Dndice-de-desenvolvimento-
humano-municipal-idhm-27. Iannuzzi-Sucich M, Prestwood KM, Kenny AM. Prevalence of Sarcopenia and
Predictors of skeletal muscle mass in healthy, older men and women. J Geront A Biol Sci Med Sci 2002; 57A(12):772-7.
28. Malafarina V, Uriz-Otano F, Iniesta R, Gil-Guerrero L. Sarcopenia in the elderly: diagnosis, physiopathology and treatment. Maturitas 2012; 71(2):109–14.
29. Alva MCV, Irigoyen CME, Gómez YCF, Ávalos SB, Cervantes TL, Gutiérrez LMR.
Factores relacionados con la desnutrición y la sarcopenia en um grupo de mujeres residentes de asilos en la Ciudad de México. Nutr Hosp 2004; 7(3):143-50.
30. Sayer AA, Robinson SM, Patel HP, Shavlakadze T, Cooper C, Grounds MD. New