1Universidade de São Paulo, Faculdade de Saúde Pública, Departamento de Nutrição. Av. Dr. Arnaldo, 715, Cerqueira César, 01246-904, São Paulo, SP, Brasil. Correspondência para/Correspondence to: DML MARCHIONI. E-mail: <[email protected]>.
Away-from-home meals: Prevalence and
characteristics in a metropolis
Alimentação fora do lar: prevalência e
características em uma metrópole
Bartira Mendes GORGULHO1
Regina Mara FISBERG1
Dirce Maria Lobo MARCHIONI1
A B S T R A C T
Objective
This study aimed to characterize away-from-home meals. Methods
This population-based, cross-sectional study measured dietary intake by administering 24-hour recalls by telephone. Away-from-home breakfast, lunch, and dinner were described and characterized according to the foods that contribute most to the intake of energy, fat, sodium, and added sugar per meal.
Results
Of the 834 respondents, 24% had had at least one meal away from home. The average energy intake per away-from-home meal was 628 kcal (±101 kcal), about 35% of the average daily intake for this population. Meals contained both healthy foods, such as rice, beans, and fish, and unhealthy foods, such as soft drinks, snacks, sandwiches, and pizza.
Conclusion
Individuals who ate away from home had worse diets. However, the presence of healthy foods indicates a possibility of improvement if purposeful programmatic actions are taken.
Indexing terms: Eating. Feeding behavior. Food habits.
R E S U M O
Objetivo
Métodos
Trata-se de estudo transversal, de base populacional representativa do município de São Paulo, realizado por meio de inquérito domiciliar e telefônico. O consumo alimentar foi medido por aplicação telefônica do recor-datório alimentar de 24 horas, em que as refeições café da manhã, almoço e jantar foram caracterizadas e descritas de acordo com os principais alimentos contribuintes para o consumo de energia, gordura, sódio e açúcar de adição.
Resultados
Dentre os 834 entrevistados, 24% realizaram ao menos uma refeição fora de casa. O consumo energético médio por refeição realizada fora do lar foi de 628 kcal (±101kcal), cerca de 35% da média de consumo diário relatado nessa população. Pôde-se observar a presença tanto de alimentos marcadores de uma dieta saudável, a exemplo do arroz, feijão e peixe, quanto de alimentos integrantes de uma dieta não saudável, como refrigerantes, salgados, sanduíches e pizzas.
Conclusão
De acordo com os dados obtidos, os indivíduos que se alimentaram fora do lar consumiram uma pior alimentação. No entanto, a presença de alimentos saudáveis aponta para potencialidades de melhora, se forem tomadas ações programáticas nesse sentido.
Termos de indexação: Ingestão de alimentos. Comportamento alimentar. Hábitos alimentares.
I N T R O D U C T I O N
The 2008 and 2009 Pesquisa de Orça-mento Familiar (POF, Family Budget Surveys) suggest a trend of eating away from home in Brazil. In six years (2002/2003-2008/2009) the participation of away-from-home foods in food expenditures in urban areas increased from one-fourth (25.7%) to one-third (33.1%), and in rural areas, from 13.1% to 17.5%. In 2008 the mean intake of away-from-home calories corresponded to approximately 16.0% of the total calorie intake and was greater in males and individuals with higher income per family member from urban areas of the Brazilian Southeast1. Data from the
Associação Brasileira das Empresas de Refeições Coletivas (ABERC, Brazilian Association of Food Services) confirm the growth of the food service market, which doubled the number of meals served between 1998 and 20102.
Away-from-home foods have higher energy density, fat content, and saturated fat content; and lower micronutrient content3-10.
Gorgulho et al.10 assessed the quality of
homemade and away-from-home meals in the municipality of São Paulo and found that the latter had lower nutritional quality, potentially contributing to the development of chronic Noncommunicable Diseases (NCD)10.
The growing rates of overweight seen in the last decades have been associated with the number of meals away from home3-9,11. Bezerra
& Sichieri11 showed that the prevalences of
overweight and obesity in men who eat away from home (38.5% and 11.9%, respectively) were higher than the prevalences in men who do not (36.1% and 10.3%, respectively)11.
Although the Ministry of Health in Brazil recognizes that the habit of eating away from home may increase the prevalence of obesity, little is known about the composition of these meals12.
Hence, the objective of this study was to characterize away-from-home meals, identifying their frequency by meal (breakfast, lunch, and dinner) and the contribution of the foods that compose them to the daily intake of energy, fats, sodium, and added sugar in participants of the population-based Inquérito de Saúde de São Paulo (ISA-Capital, Health Survey in the city of São Paulo)
M E T H O D S
of a subsample of São Paulo’s ISA-Capital conducted in 2008 and 200913. ISA-Capital’s
sample consisted of urban dwellers living in private or collective households in the municipality of São Paulo. The participants were selected by a two-stage stratified cluster sampling. The primary sampling units were urban census tracts and the secondary units, the households13.
A total of 900 males and females were invited to participate in the study, of which 300 were adolescents aged 12 to 19 years, 300 were adults aged 20 to 59 years, and 300 were older adults aged 60 or more years interviewed by ISA-Capital. The minimum size of 300 allows estimation of a prevalence of 0.5 with an error of 0.07, confidence level of 95%, and a design effect of 1.5. However, given losses stemming from moving, refusal to participate, and death, the final sample consisted of 834 individuals (41% males), of which 232 were adolescents, 304 were adults, and 298 were older adults. To maintain population representativeness, after analysis of the losses, which were homogeneous between the strata and conglomerate, and greater among adolescents (20%), the sample weight was recalculated for the same sample characteristics.
The individuals were interviewed at home to collect data on life habits and sociodemographic conditions. Food intake was measured during one year on random weekdays and months by administering a 24-hour Dietary Recall (24HR), using the Automated Multiple-Pass Method (AMPM) developed by the United States Department of Agriculture (USDA) and incorporated to the software Nutrition Data System for Research (NDS, version 2007; Nutrition Coordinating Center [NCC], University of Minnesota, Minneapolis), whose main database is the USDA Food Composition Database14,15. In this method,
the interviewee is guided through five steps (quick list; review of the quick list; meal names; cycle of details; and general review) in a standardized fashion that aims to maintain the individual interested and engaged in the interview, helping him to recall all the consumed items14. Regional
foods, recipes, and other preparations were standardized and inserted in the software according to the Brazilian food composition tables.
The contribution of away-from-home foods to each meal and intake location were determined by the methods described by Block et al.16. This method considers not only the number
of interviewees who reported consuming a given food, but also serving size and nutrient and energy contents. The total amount of a nutrient consumed by the population is estimated by making a weighted addition of the nutrient in all servings of all reported foods. The percent contribution of each food was calculated by multiplying the quotient of a nutrient’s content in each food and the total amount of the same nutrient provided by all foods by 100.
The 309 foods listed in the 24HR that the sample consumed away from home were considered away-from-home foods, regardless of where the foods were prepared. Foods consumed by at least 5% of the sample were grouped into 35 groups according to their nutritional composition, food habits of São Paulo’s city population, and culinary use as follows: rice, pasta, bread, zwieback, and cookies; whole bread; fruits; leaf vegetables; canned or pickled vegetables; vegetables; beef; pork; processed meats; cold cuts; poultry; yellow cheese; white cheese and cream cheese; whole milk; semi-skimmed and skimmed milk; dairy products (yogurts and fruit shakes); eggs; pizza; coffee and tea; soda; fruit juice; alcoholic beverages; salad dressing (oil, salt, vinegar); refined sugar; sauces; fresh condiments (onion, garlic, herbs); cocoa powder; snacks (French fries, fried cassava); legumes (except beans); and seafood.
performed in the module “Survey” of the software Stata version 1019.
The study was approved by the Research Ethics Committee of the School of Public Health under Protocol nº 2.247 in agreement with Resolution 196 passed on October 10, 1996, of the National Health Council, which regulates studies involving human beings. The subjects were only included in the study after they or their guardians (in case of minors) signed an Informed Consent Form.
R E S U L T S
The population of the study, representative of the municipality of São Paulo, consisted of 56% males, and the mean ages were 15 years, 37 years, and 71 years, respectively, for adolescents, adults, and older adults.
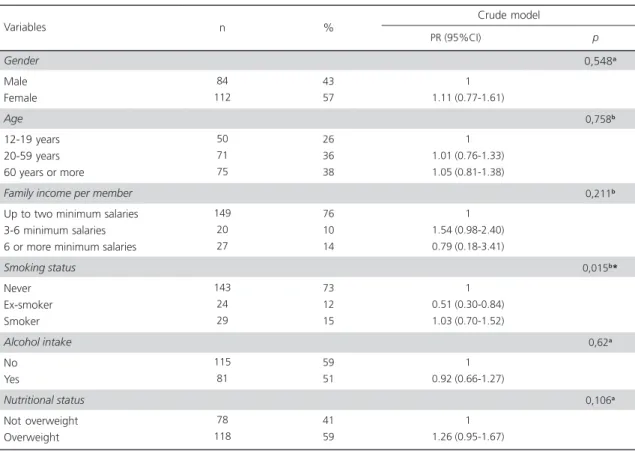
Of the 834 interviewees, 24% (50 adolescents, 71 adults, and 75 older adults) had had at least one meal away from home. Of these, 43% were males and 76% had a family income per member below two minimum salaries. The prevalences of overweight and obesity among those who ate away from home were 51% (95% Confidence Interval [95%CI]=42-59%) and 8% (95%CI=2-14%), respectively. Of all the variables, the only variable statistically associated with eating away from home was smoking status, category ex-smoker (Table 1).
Of the 482 away-from-home meals, 15%, 30%, and 10% were breakfast, lunch, and dinner, respectively; the other 45% regarded morning, afternoon, and/or evening snacks. Considering only the three main away-from-home meals (breakfast, lunch, and dinner), 36% were had at work, 26% at restaurants and fast food restaurants,
Table 1. Prevalence of away-from-home meals, prevalence ratio, and confidence interval. São Paulo (SP), 2010-2011.
Gender
Male Female
Age
12-19 years 20-59 years 60 years or more
Family income per member
Up to two minimum salaries 3-6 minimum salaries 6 or more minimum salaries
Smoking status
Never Ex-smoker Smoker
Alcohol intake
No Yes
Nutritional status
Not overweight Overweight Variables
84 112
50 71 75
149 20 27
143 24 29
115 81
78 118
43 57
26 36 38
76 10 14
73 12 15
59 51
41 59
n %
1 1.11 (0.77-1.61)
1 1.01 (0.76-1.33) 1.05 (0.81-1.38)
1 1.54 (0.98-2.40) 0.79 (0.18-3.41)
1 0.51 (0.30-0.84) 1.03 (0.70-1.52)
1 0.92 (0.66-1.27)
1 1.26 (0.95-1.67) PR (95%CI)
0,548a
0,758b
0,211b
0,015b*
0,62a
0,106a
p
Crude model
Note:aChi-square test; bWald’s test; *p<0.05.
2% at school, and 36% in other environments, such as parties, hospitals, and soup kitchens. The items with the highest participation in these meals were: rice (12%); vegetables (8%); bread, zwieback, and cookies (6%); sweets (5%); beans (5%); fruit juice (5%); leaf vegetables (5%); poultry (4%); beef (4%); seafood (4%); soda (4%); and snacks, sandwiches, and pizza (4%).
Breakfast was consumed away from home by 9% of the sample, with a mean energy content of 326 kcal (±175 kcal), where 12% (±8%) stemmed from proteins, 34% (±22%) stemmed from fats, and 55% (±34%) stemmed from carbohydrates, with a mean intake of 469 mg (±343 mg) of
sodium and 14 g (±21 g) of added sugar. Lunch was consumed away from home by 18% of the sample; the meal had a mean energy content of 771 kcal (±490 kcal), of which 21% (±14%) were from protein, 32% (±26%) were from fat, and 45% (±28%) were from carbohydrates; the mean sodium content was 1500 mg (±944 mg) and mean added sugar content was 21 g (±30 g). Dinner was consumed away from home by 6% of the sample; the meal had a mean energy content of 695 kcal (±481 kcal), of which 20% (±19%) were from protein, 32% (±26%) were from fat, and 44% (±28%) were from carbohydrates; the mean sodium content was 1358 mg
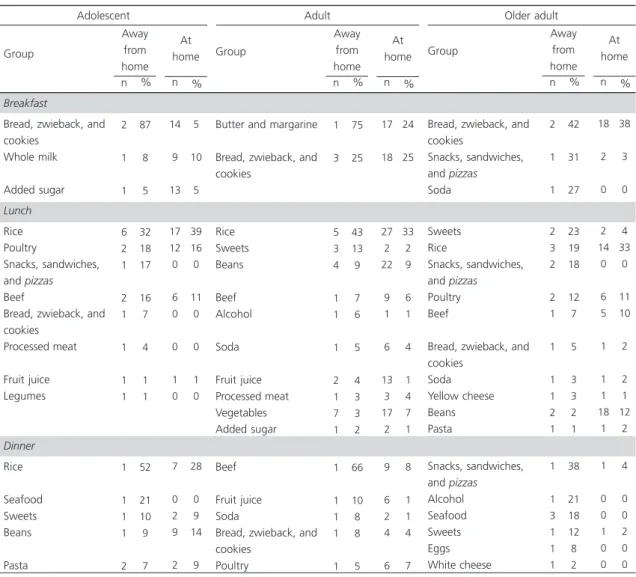
Table 2. Food groups that contributed to at least 1% of the energy consumed away-from-home and its respective intake at home.
São Paulo (SP), 2010-2011.
Breakfast
Bread, zwieback, and cookies Whole milk Added sugar Lunch Rice Poultry Snacks, sandwiches, and pizzas
Beef
Bread, zwieback, and cookies Processed meat Fruit juice Legumes Dinner Rice Seafood Sweets Beans Pasta Group 2 1 1 6 2 1 2 1 1 1 1 1 1 1 1 2
Butter and margarine
Bread, zwieback, and cookies Rice Sweets Beans Beef Alcohol Soda Fruit juice Processed meat Vegetables Added sugar Beef Fruit juice Soda
Bread, zwieback, and cookies
Poultry
Bread, zwieback, and cookies
Snacks, sandwiches, and pizzas
Soda
Sweets Rice
Snacks, sandwiches, and pizzas
Poultry Beef
Bread, zwieback, and cookies Soda Yellow cheese Beans Pasta Snacks, sandwiches, and pizzas
Alcohol Seafood Sweets Eggs White cheese 87 8 5 32 18 17 16 7 4 1 1 52 21 10 9 7 14 9 13 17 12 0 6 0 0 1 0 7 0 2 9 2 5 10 5 39 16 0 11 0 0 1 0 28 0 9 14 9 Away from home n % At home n % Away from home n % At home n % 1 3 5 3 4 1 1 1 2 1 7 1 1 1 1 1 1 75 25 43 13 9 7 6 5 4 3 3 2 66 10 8 8 5 17 18 27 2 22 9 1 6 13 3 17 2 9 6 2 4 6 24 25 33 2 9 6 1 4 1 4 7 1 8 1 1 4 7 Group Group Away from home n % At home n % 2 1 1 2 3 2 2 1 1 1 1 2 1 1 1 3 1 1 1 42 31 27 23 19 18 12 7 5 3 3 2 1 38 21 18 12 8 2 18 2 0 2 14 0 6 5 1 1 1 18 1 1 0 0 1 0 0 38 3 0 4 33 0 11 10 2 2 1 12 2 4 0 0 2 0 0
(±1323 mg) and mean added sugar content was 24g (±32 g).
Away-from-home breakfast, lunch, and dinner represented 5% (±3%), 20% (±13%), and 17% (±16%) of the mean daily intake of protein, 22% (±14%), 47% (±39%), and 43% (±35%) of the mean daily intake of fats, and 62% (±39%), 120% (±75%), and 106% (±68%) of the mean daily intake of carbohydrates, respectively.
Tables 2, 3, 4, and 5 show the main food groups consumed away from home that contributed to energy, total fat, sodium, and added sugar, respectively. The groups fruits and leaf vegetables, which are not tabulated, were found in only 5% and 4% of the meals consumed at home and in only 1% and 3% of the meals consumed away from home, respectively.
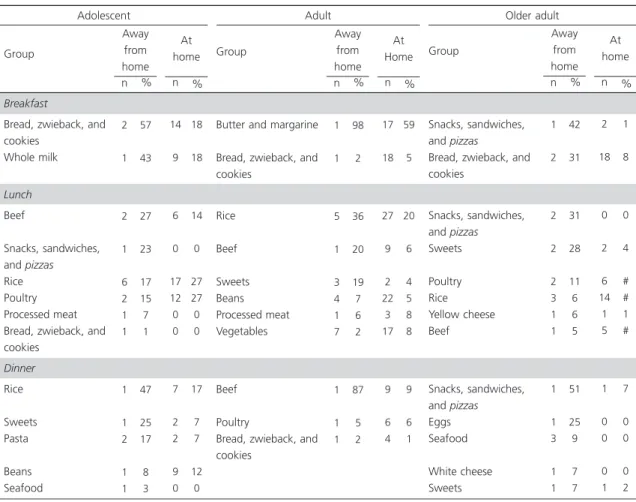
Table 3. Food groups that contributed to at least 1% of the total fats in away-from-home foods and their respective intake at home.
São Paulo (SP), 2010-2011.
Breakfast
Bread, zwieback, and cookies
Whole milk
Lunch
Beef
Snacks, sandwiches, and pizzas
Rice Poultry Processed meat Bread, zwieback, and cookies Dinner Rice Sweets Pasta Beans Seafood Group 2 1 2 1 6 2 1 1 1 1 2 1 1
Butter and margarine
Bread, zwieback, and cookies Rice Beef Sweets Beans Processed meat Vegetables Beef Poultry
Bread, zwieback, and cookies
Snacks, sandwiches, and pizzas
Bread, zwieback, and cookies
Snacks, sandwiches, and pizzas
Sweets Poultry Rice Yellow cheese Beef Snacks, sandwiches, and pizzas
Eggs Seafood White cheese Sweets 57 43 27 23 17 15 7 1 47 25 17 8 3 14 9 6 0 17 12 0 0 7 2 2 9 0 18 18 14 0 27 27 0 0 17 7 7 12 0 Away from home n % At home n % Away from home n % At Home n % 1 1 5 1 3 4 1 7 1 1 1 98 2 36 20 19 7 6 2 87 5 2 17 18 27 9 2 22 3 17 9 6 4 59 5 20 6 4 5 8 8 9 6 1 Group Group Away from home n % At home n % 1 2 2 2 2 3 1 1 1 1 3 1 1 42 31 31 28 11 6 6 5 51 25 9 7 7 2 18 0 2 6 14 1 5 1 0 0 0 1 1 8 0 4 # # 1 # 7 0 0 0 2
Adolescent Adult Older adult
D I S C U S S I O N
This study was conducted to characterize away-from-home meals and found that many Brazilian staple foods are consumed away from home, such as bread, refined sugar, butter, margarine, and whole milk at breakfast; and rice, beans, beef, and vegetables at lunch20. On the
other hand, dinner contained not only foods high in added sugar, sodium, and fats, such as soda, snacks, sandwiches, and pizza, but also a considerable amount of seafood.
In 2008 the mean intake of fish in the municipality of São Paulo was of 12 g per day for adolescents and older adults and approximately 15 g per day for adults21. Although seafood is
11% of the mean energy content of the preparation22.
Ready-to-eat and fast foods, such as snacks, sandwiches, and pizzas, which had an important participation in away-from-home meals, are characterized by relatively low cost, which may contribute to their intake23.
Energy-dense foods, usually high in fats and low in nutrients, are the cheapest, while foods with low energy density are usually more expensive and have greater price variation23,24. The 2008/2009
Brazilian Household Budget Survey shows that roughly 40% to 60% of the energy stemming from alcoholic beverages, soda, snacks, sandwiches, and pizza are consumed away from
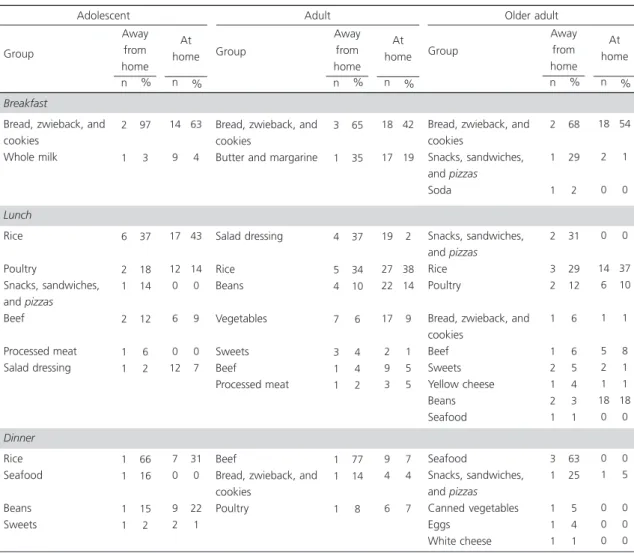
Table 4. Food groups that contributed to at least 1% of the sodium in away-from-home foods and their respective intake at home.
São Paulo (SP), 2010-2011.
Breakfast
Bread, zwieback, and cookies Whole milk Lunch Rice Poultry Snacks, sandwiches, and pizzas
Beef Processed meat Salad dressing Dinner Rice Seafood Beans Sweets Group 2 1 6 2 1 2 1 1 1 1 1 1
Bread, zwieback, and cookies
Butter and margarine
Salad dressing Rice Beans Vegetables Sweets Beef Processed meat Beef
Bread, zwieback, and cookies
Poultry
Bread, zwieback, and cookies
Snacks, sandwiches, and pizzas
Soda
Snacks, sandwiches, and pizzas
Rice Poultry
Bread, zwieback, and cookies Beef Sweets Yellow cheese Beans Seafood Seafood Snacks, sandwiches, and pizzas
Canned vegetables Eggs White cheese 97 3 37 18 14 12 6 2 66 16 15 2 14 9 17 12 0 6 0 12 7 0 9 2 63 4 43 14 0 9 0 7 31 0 22 1 Away from home n % At home n % Away from home n % At home n % 3 1 4 5 4 7 3 1 1 1 1 1 65 35 37 34 10 6 4 4 2 77 14 8 18 17 19 27 22 17 2 9 3 9 4 6 42 19 2 38 14 9 1 5 5 7 4 7 Group Group Away from home n % At home n % 2 1 1 2 3 2 1 1 2 1 2 1 3 1 1 1 1 68 29 2 31 29 12 6 6 5 4 3 1 63 25 5 4 1 18 2 0 0 14 6 1 5 2 1 18 0 0 1 0 0 0 54 1 0 0 37 10 1 8 1 1 18 0 0 5 0 0 0
Adolescent Adult Older adult
polyunsaturated fatty acids 3 and omega-6, fish is consumed by less than 1% of the municipal population, a percentage lower than that of away-from-home meals (4%)21.
The identification of rice as one of the main contributors of energy, total fat, and sodium can be justified not only because it is a Brazilian staple food but also because of the Brazilian habit of sautéing it and adding table salt. When Amorim et al.22 quantified the fat content of the buffet
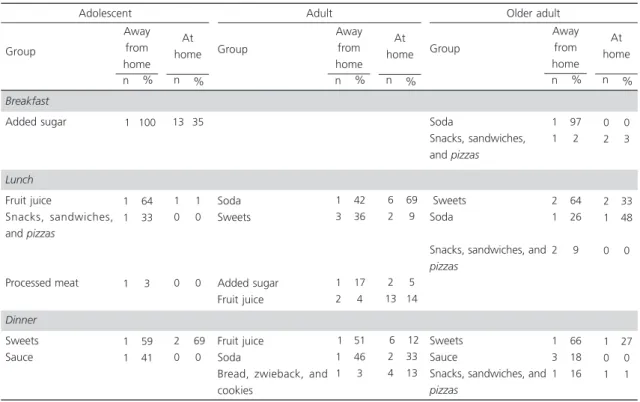
Table 5. Food groups that contributed to at least 1% of the added sugar in away-from-home foods and their respective intake at home. São Paulo (SP), 2010-2011.
Breakfast
Added sugar
Lunch
Fruit juice
Snacks, sandwiches, and pizzas
Processed meat
Dinner
Sweets Sauce Group
1
1 1
1
1 1
Soda Sweets
Added sugar Fruit juice
Fruit juice Soda
Bread, zwieback, and cookies
Soda
Snacks, sandwiches, and pizzas
Sweets Soda
Snacks, sandwiches, and
pizzas
Sweets Sauce
Snacks, sandwiches, and
pizzas
100
64 33
3
59 41
13
1 0
0
2 0
35
1 0
0
69 0
Away from home
n %
At home
n %
Away from home
n %
At home
n %
1 3
1 2
1 1 1
42 36
17 4
51 46 3
6 2
2 13
6 2 4
69 9
5 14
12 33 13
Group Group
Away from home
n %
At home
n %
1 1
2 1
2
1 3 1
97 2
64 26
9
66 18 16
0 2
2 1
0
1 0 1
0 3
33 48
0
27 0 1
Adolescent Adult Older adult
home25.Although Brazilian studies do not
compare the sodium content of at-home and away-from-home meals, a study done in 2002 in the United States compared the characteristics of foods prepared at home and away from home and found that meals prepared away from home had higher energy and added sodium (sodium added at the table by the consumer was not included) contents than the homemade26.
Low intake of fruits and leaf vegetables was also reported by Bigio et al.27, who found
that only 6% of the adolescents aged 12 to 19 years from the municipality of São Paulo consumed daily amounts of fruits and vegetables equal to or above the recommended 400 g/day and that 22% did not consume any type of fruit or vegetable on the data collection day27.
Representative Brazilian data25 show a mean daily
intake of 54 kcal from fruits, which is less than a serving (70 kcal), and roughly 16% was consumed away from home. This suggests that the absence of fruits in the diet is possibly a food habit of the
municipal population from São Paulo, regardless of eating at home or away-from-home. The contribution of fruits and fruit juice to the intake of away-from-home fats is mostly due to the intake of avocado, acaí, and coconut.
In addition to added sugar itself, the main contributors of added sugar to away-from-home meals are sweetened juices, soda, and sweets. This result is similar to that found by Bezerra & Sichieri28, who identified soda as the most
consumed away-from-home food by Brazilians. Although they analyzed the characteristics of away-from-home foods, they did not consider the amounts consumed and the energy and nutrient contributions of these foods, focusing only on intake frequencies. Lobato et al.29 used 2002/2003
POF data to find a positive and significant association between soda intake and obesity in women29.
information about individual meals, grouping all foods consumed during lunch and dinner in a single group, usually called “meals”, which prevents further detailing of the types and amounts of foods consumed at each away-from-home meal. There is no consensus in the literature regarding the definition of away-from-home food. Some authors define away-from-home food as foods consumed outside the home regardless of where it was prepared, while other authors define it as food not prepared at home regardless of where it was consumed1,30-34. However, some foods may
be prepared at home and consumed at school or work and other foods may be bought in restaurants or fast-food restaurants and consumed at home. This difference in the definitions and absence of studies that combine them hinders the comparison of findings.
Studies recognize the relationship between eating away from home and the risk of obesity, but this was not confirmed by the present study35-39. Furthermore, the association seen in the
univariate model between food away from home and being an ex-smoker can be related to the reason why the individuals stopped smoking. These individuals may have become more concerned with their health. Studies show that ex-smokers consume more fruits and vegetables and less soda than smokers and never-smokers11,40-42.
Analysis of a single food intake day can be cited as one of the limitations of the present study, hence not characterizing an analysis based on the usual food intake. However, the mean intake of a group could be determined if we consider the seasons and days of the week the survey was administered, which was done by the present study42. Another limitation was not
distinguishing the meals had in restaurants from those had in fast food restaurants, for example. Carús et al.43 investigated the meals had by adults
in a medium-sized city in the south of Brazil and found that roughly 29% of away-from-home lunch and 5% of away-from-home dinner were consumed in buffet (pay-by-weight) restaurants. In Brazil, sit-down meals are more popular than fast food meals and are positively associated with
overweight and obesity in men but not in women, in whom it is a protective factor, suggesting that Brazilian women make healthier food choices when they eat away from home11.
We also recognize the workplace as an important location for a healthy diet, since roughly 36% of away-from-home meals are had there. In 2013 Bandoni et al.44 showed that the nutritional
quality of meals served in in-house food services and restaurants is different.
C O N C L U S I O N
The study data allowed estimating food intake per away-from-home meal. Analyzing food intake per meal enables better dietary characterization and helps to identify various food habits, such as those found in the main study meals (lunch and dinner). Distinct dietary patterns are suggested for each of the three meals and age groups. Meals contained both healthy foods, such as rice, beans, and fish; and unhealthy foods, such as soda, snacks, sandwiches, and pizza. However, studies that compare the food intake of a population by intake location are still scarce, especially at a nationwide level, or whether away-from-home meals are only a reflection of homemade meals.
Given the scarcity of data on away-from-home food intake, especially meal characteristics and the complexity of food choices, food choice determinants require further studies, including studies about the influences of environmental factors on food choices, to improve our understanding of their repercussions on health and possible education and prevention policies.
A C K N O W L E D G M E N T S
São Paulo’s Health Survey stems from a partnership between Universidade de São Paulo’s School of Public Health and São Paulo’s Municipal Department of Health. The study was sponsored by
R E F E R E N C E S
1. Instituto Brasileiro de Geografia e Estatística. Pes-quisa de orçamentos familiares: análise do consumo alimentar pessoal no Brasil. Rio de Janeiro: IBGE 2011 [acesso 2012 jul 24 ]. Disponível em: <http://www. ibge.gov.br/home/presidencia/noticias/noticia_ visualiza.php?id_noticia=1648&id_pagina=1>. 2. Associação Brasileira das Empresas de Refeições
Coletivas. Mercado real de refeições. São Paulo; 2011 [acesso 2012 jul 24]. Disponível em: <http:// www.aberc.com.br/base.asp?id=3>.
3. Lin B, Frazão E, Guthrie J. Away-from-home foods increasingly important to quality of American diet. Washington (DC): Food and Rural Economics Division, Economic Research Service; 1999. U.S. Department of Agriculture Information Bulletin, n° 749. 4. Kearney JM, Hulshof KFAM, Gibney MJ. Eating
patterns temporal distribution, converging and diverging foods, meals eaten inside and outside of the home: Implications for developing FBDG. Public Health Nutr. 2001; 4(2B):693-8.
5. Bes-Rastrollo M, Basterra-Gortari FJ, Sanchez-VillegasA, Marti A, Martinez JA, Martinez-Gonzales MA. A prospective study of eating away-from-home meals and weight gain in a Mediterranean population: The SUN (Seguimiento Universidad de Navarra) cohort. Public Health Nutr. 2010; 13(9):1356-63.
6. Kant AK, Graubard BI. Eating out in America, 1987-2000: Trends and nutritional correlates. Prev Med. 2004; 38(2):243-9.
7. Abreu ES, Garbelotti ML, Torres EAFS. Dietary fiber consumption and composition foods in “by-the-kilo” restaurants. Nutr Food Sci. 2005; 35(6):386-92. 8. Ziegler P, Briefel R, Ponza M, Novak T, Hendricks K.
Nutrient intakes and food patterns of toddlers’ lunches and snacks: Influences of location. J Am Diet Assoc. 2006; 106(1S):124-34.
9. Department of Health and Human Services. Working group report on future research directions in childhood obesity prevention and treatment. Washington (DC): US Department of Health and Human Services; 2007.
10. Gorgulho BM, Fisberg RM, Marchioni DML. Nutritional quality of major meals consumed away from home in Brazil and its association with the overall diet quality. Prev Med. 2013; 57(2):98-101.
11. Bezerra NI, Sichieri R. Eating out of home and obesity: A Brazilian nationwide survey. Public Health Nutr. 2009; 12(11):2037-43.
12. Brasil. Ministério da Saúde. Guia alimentar para a população brasileira: promovendo a alimentação saudável. Brasília: Ministério da Saúde; 2006.
13. Inquéritos de Saúde no Município de São Paulo. São Paulo: ISA; 2011 [acesso 2012 nov 5]. Dispo-nível em: <http://www.fsp.usp.br/isa-sp/>. 14. Moshfegh AJ, Rhodes DG, Baer DJ, Murayi T,
Clemens JC, Rumpler WV, et al. The US Department of Agriculture Automated Multiple-Pass Method reduces bias in the collection of energy intakes. Am J Clin Nutr. 2008; 88(2):324-32.
15. Nutrition Coordinating Center: Division of Epidemiology Nutrition Data System. Nutrition Data System for Research (NDS-R). Minnesota: University of Minnesota; 1998.
16. Block G, Dresser CM, Hartman AM, Caroll MD. Nutrient sources in the American diet: Quantitative data from the NHANES II survey. I. Vitamins and minerals. Am J Epidemiol. 1985; 122(1):13-26. 17. World Health Organization. Obesity: Preventing and
managing the global epidemic. Geneva: WHO; 2000. Technical Report Series, nº 284.
18. Organização Pan-Americana da Saúde. Saúde, bem-estar e envelhecimento: O Projeto SABE no município de São Paulo: uma abordagem inicial. Brasília: OPAS; 2003.
19. Stata Statistical Software: Release 10. College Station (TX): StataCorp LP; 2007.
20. Barbosa L. Feijão com arroz e arroz com feijão: o Brasil no prato dos brasileiros. Horizontes Antropol. 2007; 13(28):87-116.
21. Carvalho AM, César CLG, Fisberg RM, Marchioni DML. Meat consumption in São Paulo: Trend in the last decade. PLoS ONE. 9(5):e96667. doi: 10.1371/ journal.pone.0096667
22. Amorim MMA, Junqueira RG, Jokl L. Consumo de óleo e gordura nas preparações do almoço self service. Alim Nutr. 2010; 21(2):217-23.
23. United States Department of Agriculture. Healthy, low calorie foods cost more on average. National Research Initiative. Washington (DC): United States Department of Agriculture; 2008 [cited 2012 Jul 24]. Available from: <http://www.csrees.usda.gov/ newsroom/impact/2008/nri/pdf/price_of_ food. pdf>.
24. Monsivais P, Drewnowski A. The rising cost of low-energy-density foods. J Am Diet Assoc. 2007; 107(12):2071-6.
25. Bezerra IN, Souza AM, Pereira RA, Sichieri R. Contribution of foods consumed away from home to energy intake in Brazilian urban areas: The 2008-9 Nationwide Dietary Survey. Br J Nutr. 2012; 109(7):1276-83.
26. Guthrie JF, Lin B, Frazao E. Role of food prepared away from home in the american diet, 1977-78
27. Bigio RS, Verly Jr E, Castro MA, Cesar CLG, Fisberg RM, Marchioni DML. Determinantes do consumo de frutas e hortaliças em adolescentes por regressão quantílica. Rev Saúde Pública. 2011; 45(3):448-56. 28. Bezerra IN, Sichieri R. Características e gastos com alimentação fora do domicílio no Brasil. Rev Saúde Pública. 2010; 44(2):221-9.
29. Lobato JCP, Costa AJL, Sichieri R. Food Intake and prevalence of obesity in Brazil: An ecological analysis. Publ Health Nutr. 2009; 12(11):2209-15. 30. Gregory J, Foster K, Tyler H, Wiseman M. The dietary and nutritional survey of British adults. London: HMSO Publications Centre; 1990.
31. Kearney JM, Hulshof KFAM, Gibney MJ. Eating patterns: Temporal distribution, converging and diverging foods, meals eaten inside and outside of the home: Implications for developing FBDG. Public Health Nutr. 2001; 4(2B):693-8.
32. Orfanos P, Naska A, Trichopoulos D, Slimani N, Ferrari P, van Bakel M, et al. Eating out of home and its correlates in 10 European countries. Public Health Nutr. 2007; 10(12):1515-25.
33. Guilkey DK, Haines PS, Popkin BM. The distribution of food consumption over a year: A longitudinal analysis. Am J Agric Econ. 1990; 72(4):891-900. 34. Horton S, Campbell C. Wife’s employment, food
expenditure and apparent nutrient intake: Evidence from Canada. Am J Agric Econ. 1991; 73(3):784-94. 35. Burns C, Jackson M, Gibbons C, Stoney RM. Foods
prepared outside the home: Association with selected nutrients and body mass index in adult Australians. Public Health Nutr. 2002; 5(3):441-8. 36. BowmanSA, Vinyart BT. Fast food consumption of US adults: Impact on energy and nutrient intakes and overweight status. J Am Coll Nutr. 2004; 23(2):163-8.
37. Satia JA, Galanko JA, Siega-Riz AM. Eating at fast-food restaurants is associated with dietary intake, demographic, psychosocial and behavioral
factors among African Americans in North Carolina. Public Health Nutr. 2004; 7(8):1089-96.
38. Schmidt M, Affenito SG, Striegel-Moore R, Khoury PR, Barton B, Crawford P, et al. Fast-food intake and diet quality in black and white girls: The National Heart, Lung, and Blood Institute Growth and Health Study. Arch Pediatr Adolesc Med. 2005; 159(7):626-31.
39. Befort C, Kaur H, Nollen N, Sullivan DK, Nazir N, Choi WS, et al. Fruit, vegetable, and fat intake among non-Hispanic black and non-Hispanic white adolescents: Associations with home availability and food consumption settings. J Am Diet Assoc. 2006; 106(3):367-73.
40. Neutzling MB, Rombaldi AJ, Azevedo MR, Hallal PC. Fatores associados ao consumo de frutas, legu-mes e verduras em adultos de uma cidade no Sul do Brasil. Cad Saúde Pública. 2009; 25(11):2365-74. 41. Rombaldi AJ, Neutzling MB, Silva MC, Azevedo MR,
Hallal PC. Fatores associados ao consumo de refri-gerante não dietético em adultos de pelotas, RS. Rev Saúde Pública. 2011; 45(2):382-90.
42. Miller PE, Mitchell DC, Harala PL, Pettit JM, Smiciklas-Wright H, Hartman TJ. Development and evaluation of a method for calculating the Healthy Eating Index-2005 using the Nutrition Data System for Research. Public Health Nutr. 2011; 14(2):306-13. 43. Carús JP, França GVA, Barros AJD. Local e tipo das refeições realizadas por adultos em cidade de médio porte. Rev Saúde Pública. 2014; 48(1):68-75. 44. Bandoni DH, Canella DS, Levy RB, Jaime PC. Eating
out or in from home: Analyzing the quality of meal according eating locations. Rev Nutr. 2013; 26(6):625-32. doi: 10.1590/S1415-5273201300 0600002