Copyright © 2015 Revista Latino-Americana de Enfermagem This is an Open Access article distributed under the terms of the Creative Commons Attribution Non-Commercial License (CC BY-NC).
This license lets others distribute, remix, tweak, and build upon your work non-commercially, and although their new works must also acknowledge you and be non-commercial, they don’t have to license their derivative works on the same terms.
Corresponding Author: Maria Helena Barbosa
Universidade Federal do Triângulo Mineiro Av. Getúlio Guaritá, 107
Bairro: Abadia
CEP: 38025-440, Uberaba, MG, Brasil
E-mail: [email protected], [email protected]
1 Paper extracted from master’s thesis “The patient safety culture in a teaching hospital of Minas Gerais” presented to Universidade Federal do Triângulo Mineiro, Uberaba, MG, Brazil. Supported by Fundação de Amparo à Pesquisa do Estado de Minas Gerais (FAPEMIG), Brazil, process # APQ-02222-12.
2 MSc.
3 PhD, Associate Professor, Universidade Federal do Triângulo Mineiro, Uberaba, MG, Brazil. 4 PhD, Adjunct Professor, Universidade Federal do Triângulo Mineiro, Uberaba, MG, Brazil.
Factors associated with the patient safety climate at a teaching
hospital
1Raíssa Bianca Luiz
2Ana Lúcia de Assis Simões
3Elizabeth Barichello
4Maria Helena Barbosa
3Objectives: to investigate the association between the scores of the patient safety climate
and socio-demographic and professional variables. Methods: an observational, sectional
and quantitative study, conducted at a large public teaching hospital. The Safety Attitudes
Questionnaire was used, translated and validated for Brazil. Data analysis used the software
Statistical Package for Social Sciences. In the bivariate analysis, we used Student’s t-test,
analysis of variance and Spearman’s correlation of (α=0.05). To identify predictors for the safety
climate scores, multiple linear regression was used, having the safety climate domain as the
main outcome (α=0.01). Results: most participants were women, nursing staff, who worked
in direct care to adult patients in critical areas, without a graduate degree and without any
other employment. The average and median total score of the instrument corresponded to 61.8
(SD=13.7) and 63.3, respectively. The variable professional performance was found as a factor
associated with the safety environment for the domain perception of service management and
hospital management (p=0.01). Conclusion: the identification of factors associated with the
safety environment permits the construction of strategies for safe practices in the hospitals.
Descriptors: Patient Safety; Safety Management; Health Personal.
Rev. Latino-Am. Enfermagem 2015 Sept.-Oct.;23(5):880-7
DOI: 10.1590/0104-1169.0059.2627 www.eerp.usp.br/rlae
Introduction
The occurrence of adverse events entails countless
losses related to the patient, such as disabilities, physical
and psychological trauma, increased length of hospital
stay and distancing from society and work. These
losses do not only relate to the patient, but also to the
professionals, who have ethical and moral damages, and
losses in professional-patient interaction(1). For health
institutions, the adverse events (AEs) cause increased
costs, loss of conidence in the institution, as well as
moral and organizational problems(1).
All of these implications, caused by unsafe practices
in health, makes the issue of AEs turn into a public health
problem, indicating the need to develop strategies for
the monitoring of errors and improvements related to
patient safety(2). For safe strategies to be implemented
in the interest of patient safety, it is necessary that
health organizations adopt a safety culture model.
Safety culture can be deined as the set of individual
and group values, attitudes, perceptions that determine
the commitment and style, concerning questions related
to patient safety in a health organization(3).
In the literature, some instruments have been
developed in order to measure the patient safety
culture, through the health professionals’ perception of
the safety climate(4). The climate relects the perception
of professionals on safety issues at any given time in
their workplace(5). The climate is understood as the
measurable part of the safety culture(5).
Studies show that positive perceptions of the
safety climate are associated with the adoption of
safe behaviors, improved communication, conducting
training programs, reduction of adverse events, among
others, contributing to safe practices in patient care(4,6-7).
Other factors in the institutional and environmental
spheres may be related to the adoption of the safety
climate, such as professional stress, teamwork, job
satisfaction, the institution’s management structure and
work conditions.
Researchers cite strengths and weaknesses that inluence the implementation of a safety climate, based
on the perception of nursing professionals. Among
the factors that contributed to this implementation
were: organizational change, professional training
and development, relationship with patients, research
and strategic planning The following weaknesses
were highlighted: organization and infrastructure of
the institution, shortcomings in communication and
ineficiency of professional training with a safety focus(8).
Thus, identifying factors that are associated with
the patient safety climate is an important tool, capable of
diagnosing factors that need improvement within health
institutions and among professionals, guaranteeing safe
and high-quality patient care. In addition, there is a
clear lack of Brazilian studies using tools that measure
hospitals’ safety climate. Among the tools, the Safety
Attitudes Questionnaire (SAQ), validated in Brazil in
2012, has been adopted in some Brazilian studies,
being a valid and reliable tool that is considered one
of the most sensitive and capable of assessing safety
attitudes(9). Other studies are observed in the country
assessing the safety climate, but with the use of other
tools, such as the study conducted in the state of Paraná,
in which the scale called “Safety Climate “ was applied,
translated and validated in Brazil(10).
Based on the above, the aim of this research was to
determine the association among patient safety scores,
sociodemographic variables and health professionals.
Method
Observational and sectional study with a quantitative
approach, undertaken at a large public teaching hospital
that attends to high-complexity patients, located in the
region of Triângulo Mineiro, Minas Gerais, Brazil.
Simple random samping was applied using the
application Power Analysis and Sample Size (PASS),
which considered a determination coeficient R²=0.02 in
a multiple linear regression model with four predictors,
adopting a signiicance level or type I error of α=0.05
and type II error of β=0.2. The sample consisted of
556 health professionals , including the nursing team
(baccalaureate nurse, nursing technicians and auxiliary
nurses), physicians, physiotherapists, social workers,
speech, language and hearing therapists, laboratory,
pharmacy and radiology technicians, dieticians,
occupational therapists, pharmacists, health aids and
psychologists. The data were collected between May and
July 2013.
The study participants were health professionals
who had worked at their services for at least one month,
working at least 20 hours per week and who agreed to
participate in the study by signing the Informed Consent
Form. Professionals on medical leave or leave of absence
during the data collection period and who could not be
contacted after three attempts were excluded.
To collect the data, the tool called Safety Attitudes
Questionnaire (SAQ) was used, validated for Brazilian
Rev. Latino-Am. Enfermagem 2015 Sept.-Oct.;23(5):880-7.
irst part contains 41 items and corresponds to six
domains, divided in: Teamwork Climate, Satisfaction at
Work, Perception of Service and Hospital Management,
Safety Climate, Work Conditions and Perceived Stress.
The response to each item follows a ive-point Likert
scale: disagrees completely (A), disagrees partially (B),
neutral (C), agrees partially (D), agrees completely (E)
and does not apply. The inal score of the SAQ ranges
between 0 and 100, with zero corresponding to the worst
perceived safety climate and 100 to the best. According
to the authors of the original tool, scores of 75 or higher
are considered as positive(12).
The second part aims to collect sociodemographic
and professional data (sex, professional category, length
of experience in the specialty and work unit). In addition,
other professional variables were added (activity sector,
main and professional activity, time since graduation and
length of experience at the institution, graduate degree
and other employment). The professional’s activity sectors
were divided in accordance with Ministry of Health Decree
930, issued on August 27th 1992(13), which classiies the
hospital areas according to the contamination potential
as critical, semi-critical and non-critical.
The health team professionals received the data
collection instrument for completion and return, with
a preset deadline, after signing the Free and Informed
Consent Form.
The data were included in an electronic worksheet
in Excel® for Windows®, validated using double data
entry and exported to Statistical Package for the Social
Sciences (SPSS), version 19.0 for Windows®for further
processing and analysis.
To verify the patient’s safety climate, initially, any
reverse items in the tool were inverted and, then, the
formula (m(q.1,q.2r,q.3,q.4,q.5,q.6,q.7,q.8,q.9,q.10,q.
11r,...q.41))-1)x25) was applied, in which m corresponds
to the mean score of the items in the tool as a whole.
The score in each domain was calculated based on the
formula (m-1)x25, where m is the mean item score in
that domain, ranging in the interval [0-100].
In the preliminary bivariate analysis, Student’s
t-test was used (dichotomous categorical), variance
analysis (ANOVA) for three or more categories and
Spearman’s correlation test for the ordinal variables.
Associations were considered statistically signiicant when p≤0.05.
Next, multiple linear regression was used to
determine the predictors associated with the safety
climate. Statistical signiicance was set at 0.05.
This study received Institutional Review Board
approval under opinion 2306/2012, In compliance with
Resolution 196/96 on research involving human beings(14).
Results
Sociodemographic and professional characteristics
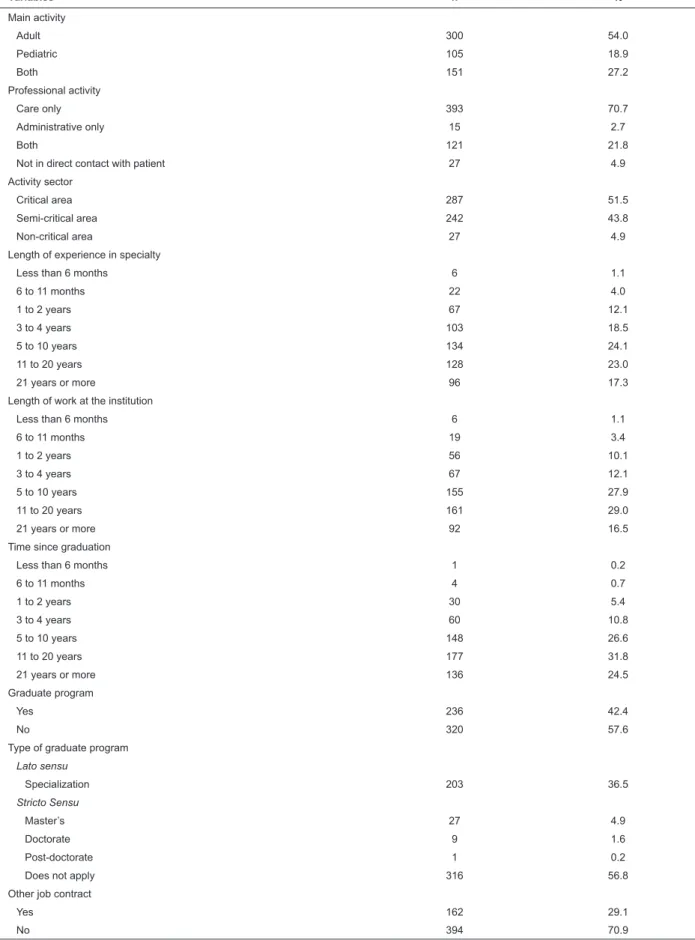
Among the 556 professionals who participated,
the majority was female (426, 76.6%); nursing
team members (401, 72.1%); main activity involving
adult patients (300, 54.0%); care functions only
(393, 70.7%); active in critical care area, according
to contamination potential of hospital areas (287,
51.5%); without any graduate degree (320, 57.6%);
and without any other employment contract (394,
70.9%), according to Table 1.
As regards the length of experience in the specialty
area, the largest proportion had between 5 and 10 years
of experience, (134, 24.1%). Concerning the length of
professional activity at the institution where the ield study
was carried out, between 11 and 20 years prevailed, (161,
29.0%). What the time since graduation is concerned,
more professionals had graduated between 11 and 20
years earlier, (177, 31.8%), according to Table 1.
Table 1 presents the research participants’ (n=556)
sociodemographic and professional characteristics.
(continue...)
Variables n %
Sex
Male 130 23.4
Female 426 76.6
Professional categoryl
Nursing team 401 72.1
Medical team 52 9.4
Other professionals 103 18.5
Table 1 – Sociodemographic and professional characteristics of research participants (n=556). Uberaba, MG, Brazil,
Table 1 - (continuation)
Variables n %
Main activity
Adult 300 54.0
Pediatric 105 18.9
Both 151 27.2
Professional activity
Care only 393 70.7
Administrative only 15 2.7
Both 121 21.8
Not in direct contact with patient 27 4.9
Activity sector
Critical area 287 51.5
Semi-critical area 242 43.8
Non-critical area 27 4.9
Length of experience in specialty
Less than 6 months 6 1.1
6 to 11 months 22 4.0
1 to 2 years 67 12.1
3 to 4 years 103 18.5
5 to 10 years 134 24.1
11 to 20 years 128 23.0
21 years or more 96 17.3
Length of work at the institution
Less than 6 months 6 1.1
6 to 11 months 19 3.4
1 to 2 years 56 10.1
3 to 4 years 67 12.1
5 to 10 years 155 27.9
11 to 20 years 161 29.0
21 years or more 92 16.5
Time since graduation
Less than 6 months 1 0.2
6 to 11 months 4 0.7
1 to 2 years 30 5.4
3 to 4 years 60 10.8
5 to 10 years 148 26.6
11 to 20 years 177 31.8
21 years or more 136 24.5
Graduate program
Yes 236 42.4
No 320 57.6
Type of graduate program
Lato sensu
Specialization 203 36.5
Stricto Sensu
Master’s 27 4.9
Doctorate 9 1.6
Post-doctorate 1 0.2
Does not apply 316 56.8
Other job contract
Yes 162 29.1
Rev. Latino-Am. Enfermagem 2015 Sept.-Oct.;23(5):880-7.
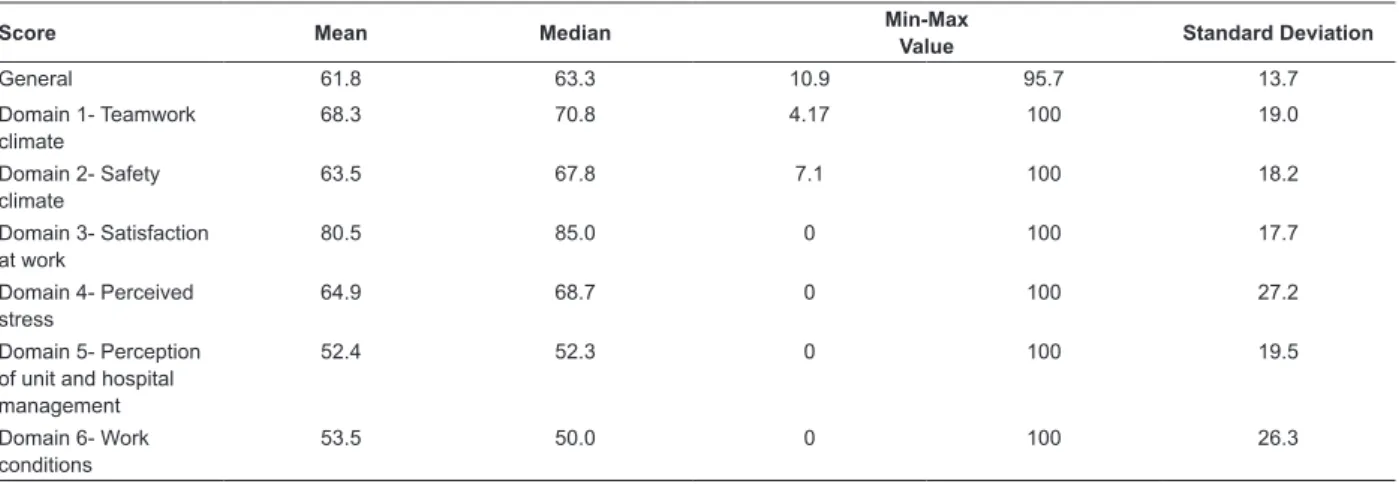
Descriptive analysis of Safety Attitudes Questionnaire scores
The mean and median of the general score were
61.8 (SD=13.7) and 63.3, respectively. The higher the
score, the better the professionals perceive the safety
climate. According to the original authors of the SAQ,
however, scores are considered positive when the total
score is equal to or higher than 75, indicating a negative
general perception of the safety climate in this study.
Per domains, the mean (score) ranged between
52.4 (SD=19.5) and 80.5 (SD=17.7) and the median
between 50.0 and 85.0. It was perceived that domain
5, perception of unit and hospital management, showed
the worst score (mean 52.4; SD=19.5), while domain
3, satisfaction at work, showed the highest score (mean
80.5; SD=17.7) among the professionals studied,
according to Table 2.
Table 2 shows the general and domain scores and
descriptive analysis of the SAQ.
Table 2 – Descriptive analysis of general and domain scores of SAQ (n=556). Uberaba, MG, Brazil, 2013
Score Mean Median Min-Max
Value Standard Deviation
General 61.8 63.3 10.9 95.7 13.7
Domain 1- Teamwork climate
68.3 70.8 4.17 100 19.0
Domain 2- Safety climate
63.5 67.8 7.1 100 18.2
Domain 3- Satisfaction at work
80.5 85.0 0 100 17.7
Domain 4- Perceived stress
64.9 68.7 0 100 27.2
Domain 5- Perception of unit and hospital management
52.4 52.3 0 100 19.5
Domain 6- Work conditions
53.5 50.0 0 100 26.3
Factors associated with the safety climate
In the preliminary bivariate analysis, the variables
that revealed statistically signiicant associations were:
professional activity, professional category, length of
professional activity, time since graduation and length
of experience at the institution.
For the variable professional activity (care and
non-care), the associations were signiicant for the
domain perception of unit and hospital management
(p=0.01), where the non-care professionals obtained
a better score than the professionals active in direct
care.
As regards the professional category, statistically
signiicant relations were found for the general score (p=0.02), for the domain perception of unit and hospital management (p=0.03) and the domain work conditions (p=0.05). As perceived, the medical team’s perception
was better when compared to the nursing team category
for these three variables.
What the variable length of professional activity is
concerned, p=0.01 was found for the domain perceived
stress, demonstrating that the professionals with less
than six months of activity perceive the acknowledgement
of stressful factors better.
For the variable time since graduation, signiicant
associations were evidenced for the domains satisfaction
at work (p=0.005) and perceived stress (p=0.005).
Professionals with less than six months since graduation
showed better perceptions in this domain when
compared to the other categories.
For the variable length of experience at the
institution, statistical signiicance was found in the domain satisfaction at work (p=0.01) and perceived stress (p=0.03). Professionals with 21 years of
experience or more presented better perceptions when
compared to the other professionals.
After the multivariate analysis through multiple
linear regression, the sole statistically signiicant predictive variable (p=0.01) associated with the SAQ
scores was professional activity for the domain perception
of unit and hospital management. In fact, this variable
already demonstrated a signiicant association in the
preliminary bivariate analysis. This result demonstrates
that the non-care professionals (mean 58.0) show a
better perception of the management when compared to
the care professionals (mean 53.1), according to Table 3.
Table 3 shows the multiple linear regression
analysis of the statistically signiicant variables in the
Discussion
The patient safety climate score in this study
obtained a mean score of 61.8 (SD=13.7) and a median
score of 63.3. In the literature, studies were found whose
mean scores were also inferior to the acceptable score
of 75(15-18). It is highlighted that scores inferior to 60
are considered a sign of alert for health organizations,
indicating the urgent need to promote the safety climate
at the institution(11).
In this research, the variable professional activity
(care and non-care) was considered a predictive
variable for the domain perception of unit and hospital
management (p=0.01). In line with this inding, a study
developed to identify the safety climate in hospitals
in the USA found signiicant associations between
care and management professionals, demonstrating
that management professionals had a more positive
perception than care professionals(19).
A study involving outpatient professionals in
Texas, USA also found signiicant differences between
professional activity (care and non-care) and the SAQ
domains. That study demonstrated that, for the domain
perception of unit and hospital management, the
management (non-care) professionals obtained better
scores when compared to the medical professionals(20),
demonstrating the non-care professionals’ better
perception of management actions than patient safety
issues.
The indings of a study involving health professionals
at a hospitalization unit of a teaching hospital in Ireland
demonstrates that the nurse managers obtained higher
scores for the domains teamwork climate (p<0.05) and
safety climate (p<0.01) than the care professionals(18).
Authors suggest that the better perception
among management than among care professionals
can be explained by the managers’ sense of propriety
and responsibility regarding their roles in the hospital
inirmaries. In addition, the care professionals may
feel excluded from administrative decision processes,
besides their lack of participation in the elaboration and
implementation of strategies, reducing their autonomy
and generating dissatisfaction with management
actions(18).
Another explanation for these indings can be
related to the care professionals’ experience with safety
risks, making them display worse perceptions of the
management, as these professionals have less contact
with direct patient care. In addition, there is a culture
of hiding negative information (occurrence of errors,
incidents and adverse events) among the professionals,
making it dificult for the safety problems to reach the
hospital management. Another aspect appointed is related
to the management professionals’ desire to be considered
as an organization committed to safety, making them
display positive perceptions(19). This situation can turn
into a problem though when this positive view does not
relect the true institutional reality(20).
In the literature, however, studies were found that
identiied other predictors of the patient safety climate.
The most mentioned predictors are the professionals’
age, sex and professional category 17,21-22) .
Hospitals in Cyprus, Greece found that the variables
age and reported fatigue at work were considered
predictors of the domains teamwork climate, safety
climate and work conditions(17).
A study aimed at verifying the relation between
sex and perceived safety culture found that the eldest
Table 3 – Multiple linear regression of factors associated with SAQ scores of participating professionals (n=556). Uberaba,
MG, Brazil, 2013
Variables
General Score
Score Dom. 1-Safety climate
in team
Score Dom. 2-Safety climate
Score Dom.3-Satisfaction at
work
Score Dom. 4-Perceived
stress
Score Dom. 5-Perception of unit and hospital management
Score Dom. 6-Work conditions
β* P† β* P† β* P† β* P† β* P† β* P† β* P†
Professional activity
-0.07 0.07 -0.06 0.13 -0.01 0.78 -0.03 0.39 0.05 0.23 -0.10 0.01 -0.04 0.25
Nursing team -0.05 0.25 0.04 0.38 0.00 0.94 -0.05 0.26 -0.09 0.07 -0.06 0.23 -0.08 0.11
Medical team 0.06 0.21 0.09 0.06 -0.01 0.76 -0.01 0.83 0.02 0.69 -0.06 0.23 -0.08 0.11
Length of experience
0.03 0.51 0.00 0.91 0.02 0.73 -0.03 0.53 0.01 0.75 0.05 0.36 0.07 0.22
Length of work at institution
0.05 0.37 -0.09 0.13 -0.04 0.41 0.10 0.09 0.07 0.20 -0.03 0.55 -0.10 0.08
Rev. Latino-Am. Enfermagem 2015 Sept.-Oct.;23(5):880-7.
professionals’ perceived teamwork climate was better
than the youngest; and that the male sex obtained
better perceptions of satisfaction at work and work
conditions when compared to the female sex(21).
In a study undertaken at obstetric centers in the
USA, statistically signiicant associations were found
between the domain teamwork climate and professional
category, with physicians showing better scores than
nurses(22). That study demonstrated different viewpoints
and opinions among physicians and nurses regarding
safety issues, with physicians demonstrating greater
awareness in reports on potential damage when
compared to nurses(22).
This study is limited by the fact that, although
simple random sampling was used to obtain the sample
size, the cross-sectional cohort to obtain the data
may limit the spectrum of the analysis. Nevertheless,
the proposed objectives were reached. Therefore,
longitudinal studies are suggested for the future.
Conclusion
As observed, the general score was 61.8 (SD=13.7)
and the median 63.3, demonstrating the professionals’
negative perception of the patient safety climate.
In the bivariate analysis, the variables that showed
statistically signiicant associations were: professional
activity for the domain perception of unit and hospital
management (p=0.01); professional category for the general score (p=0.02), for the domain perception of unit and hospital management (p=0.03) and for the domain work conditions (p=0.05); the variable length
of professional activity for the domain perceived stress
(p=0.01); the variable time since graduation for the domains satisfaction at work (p=0.005) and perceived stress (p=0.005); and the variable length of experience
at the institution for the domain satisfaction at work
(p=0.01) and perceived stress (p=0.03). Nevertheless,
the professional activity was considered the predictive
variable for the domain perception of unit and hospital
management, with non-care professionals showing a
better perception than care professionals.
The identiication of the predictors of patient
safety scores is an important tool that, linked with
organizational actions, permits diagnosing, intervening
and executing activities, based on the domains that
need to be improved (work conditions and management
actions) and the professionals’ intrinsic and extrinsic
factors in need of attention (stress, teamwork and
satisfaction). All of these efforts contribute to implement
the safety climate at the institution, with the promotion
of patient safety as the inal result.
References
1. Kho ME, Perri D, McDonald E, Waugh L, Orlicki
C, Monaghan E, et al. The climate of patient safety
in a Canadian intensive care unit. J Crit Care.
2009;24(3):7-13.
2. Dias MAE, Martins M, Navarro N. Rastreamento de
resultados adversos nas internações do Sistema Único
de Saúde. Rev Saúde Pública. 2012;46(4):719-29.
3. Nieva VF, Sorra J. Safety culture assessment: a tool
for improving patient safety in healthcare organizations.
Qual Saf Health Care. 2003;2(Suppl 2):17-23.
4. Lee WC, Wung HY, Liao HH, Lo CM, Chang FL,
Wang PC, et al. Hospital safety culture in Taiwan: a
nationwide survey using Chinese version safety attitude
questionnaire. BMC Health Serv Res. 2010;10:1-8. 5. Sexton JB, Helmreich RL, Neilands TB, Rowan K, Vella
K, Boyden J, et al. The Safety Attitudes Questionnaire:
psychometric properties, benchmarking data, and emerging
research. BMC Health Serv Res. 2006;44(6):1-10.
6. Alahmadi HA. Assessment of patient safety culture
in Saudi Arabian hospitals. Qual Saf Health Care.
2010;9(17):1-5.
7. El-Jardali F, Dimassi H, Jamal D, Jaafar M, Hemadeh
N. Predictors and outcomes of patient safety culture in
hospitals. Qual Saf Health Care. 2011;11(45):4-12.
8. Ques AAM, Montoro CH, Gonzáles MG. Strengths
and threats regarding the patient’s safety:nursing
professionals’ opinion. Rev. Latino-Am. Enfermagem.
2010;18(3): 339-45.
9. Colla JB, Bracken AC, Kinney LM, Weeks WB.
Measuring patient safety climate: a review of surveys.
Qual Saf Health Care. 2005;14(5):364-6.
10. Ribeiro PHV, Brevidelli MM, Tipple AFV, Ribeiro RP,
Gir E. Clima de segurança organizacional e a adesão às
precações padrão entre dentistas. Acta Paul. Enferm.
2013;26(2):192-7.
11. Carvalho REFL, Cassiani SHB. Cross-cultural
adaptation of the Safety Attitudes Questionnaire - Short
Form 2006 for Brazil. Rev. Latino-Am. Enfermagem.
2012; 20(3):575-82.
12. Sexton JB, Thomas EJ, Grillo SP. The safety attitudes
questionnaire (SAQ) Guidelines for administration. The
University of Texas Center of Excellence for Patient
Safety Research and Practice; 2003. Technical Report. Sponsored by the Agency for Healthcare Research and
13. Lei n° 9962, de 22 de Fevereiro de 2000 (BR). Resolve expedir normas para controle das infecções
hospitalares. Diário Oficial da União, Brasília n. 38,
Seção 1, p. 35, 23 fev. 2000.
14. Conselho Nacional de Saúde (BR). Resolução 196,
de 10 de outubro de 1996. Brasília: CNS; 1996.
15. Davenport DL, Henderson WG, Hogan S,
Mentzer RM Jr, Zwischenberger JB. Surgery resident
working conditions and job satisfaction. Surgery.
2008;144(2):332-8.
16. Modak I, Sexton JB, Thomas RL, Helmreich RL,
Thomas EJ. Measuring safety culture in the ambulatory
settings: the safety attitudes questionnaire – ambulatory
version. J Gen Intern Med. 2007;22(1):1-5.
17. Raftopoulos V, Savva N, Papadopoulou M. Safety
culture in the maternity units: a census survey using the
safety attitudes questionnaire. BMC Health Serv Res.
2011; 11(Suppl. 1):1-10.
18. Relihan E, Glynn S, Daly D, Silke B, Ryder S.
Measuring and benchmarking safety culture: application
of the safety attitudes questionnaire to an acute medical
admissions unit. Ir J Med Sci. 2009;178(4):433-9.
19. Singer SJ, Fawell A, Gaba DM, Baker LC. Patient
safety climate in US hospitals: variation by management
level. Med Care. 2008;46(11):1149-56.
20. Thomas E J, Sexton JB, Helmreich EL. Discrepant
attitudes about teamwork among critical care nurses
and physicians. Crit Care Med. 2003;31(1):956-59.
21. Carney BT, Mills PD, Bagian JP, Weeks WB. Sex
differences in operating room care giver perceptions of
patient safety: a pilot study from the Veterans Health
Administration Medical Team Training Program. Qual Saf
Health Care. 2010;19(2): 128-31.
22. Lyndon A, Sexton JB, Simpson KR, Rosenstein A, Lee KA, Wachter RM. Predictors of likelihood of speaking up
about safety concerns in labour and delivery. BMJ Qual
Saf. 2011;22(2):791-9.