ISSN 0100-879X
BIOMEDICAL SCIENCES
AND
CLINICAL INVESTIGATION
www.bjournal.com.br
www.bjournal.com.br
Volume 44 (11) 1070-1193 November 2011
Institutional Sponsors
The Brazilian Journal of Medical and Biological Research is partially financed by
Faculdade de Medicina de Ribeirão Preto Campus
Ribeirão Preto
Ex plor e H igh - Pe r for m a n ce M S Or bit r a p Te ch n ology I n Pr ot e om ics & M e t a bolom ics
analit icaw eb.com .br S C I E N T I F I C
Braz J Med Biol Res, November 2011, Volume 44(11) 1164-1170
doi: 10.1590/S0100-879X2011007500122
Body composition measures of obese adolescents by the deuterium
oxide dilution method and by bioelectrical impedance
Body composition measures of obese
adolescents by the deuterium oxide dilution
method and by bioelectrical impedance
C.M.M. Resende
1, J.S. Camelo Júnior
1, M.N.C.M. Vieira
1, E. Ferriolli
2,
K. Pfrimer
2, G.S.C. Perdoná
3and
J.P. Monteiro
11Departamento de Puericultura e Pediatria, 2Laboratório de Espectrometria de Massa,
Departamento de Clínica Médica,
3Departamento de Medicina Social, Faculdade de Medicina de Ribeirão Preto,
Universidade de São Paulo, Ribeirão Preto, SP, Brasil
Abstract
The objectives of the present study were to describe and compare the body composition variables determined by bioelectrical impedance (BIA) and the deuterium dilution method (DDM), to identifypossible correlations and agreement between the two methods, and to constructa linear regression model including anthropometric measures. Obese adolescents were evaluated by anthropometric measures, and body composition was assessed by BIA and DDM. Forty obese adolescents were included in the study. Comparison of the mean values for the following variables: fat body mass (FM; kg), fat-free mass (FFM; kg), and
total body water (TBW; %) determined by DDM and by BIA revealed significant differences. BIA overestimated FFM and TBW
and underestimated FM. When compared with data provided by DDM, the BIA data presenteda significant correlation with FFM (r = 0.89; P < 0.001), FM (r = 0.93; P < 0.001) and TBW (r = 0.62; P < 0.001). The Bland-Altman plot showed no agree-ment for FFM, FM or TBW between data provided by BIA and DDM. The linear regression models proposed in our study with respect to FFM, FM, and TBW were well adjusted. FFM obtained by DDM = 0.842 x FFM obtained by BIA. FM obtained by DDM = 0.855 x FM obtained by BIA + 0.152 x weight (kg). TBW obtained by DDM = 0.813 x TBW obtained by BIA. The body composition results of obese adolescents determined by DDM can be predicted by using the measures provided by BIA through a regression equation.
Key words: Adolescents; Obesity; Body composition; Bioelectrical impedance; Deuterium oxide dilution method
Introduction
Correspondence: C.M.M. Resende, Departamento de Puericultura e Pediatria, Faculdade de Medicina de Ribeirão Preto, USP, Av. Bandeirantes, 3900, 14049-900 Ribeirão Preto, SP, Brasil. E-mail: [email protected]
Received February 28, 2011. Accepted August 29, 2011. Available online September 16, 2011. Published November 14, 2011.
Obesity in children and adolescents has become an increasing clinical and public health concern (1). Whereas until recently the basic concern about obese children was their high risk to become obese adults, the current concern is about the possible repercussions of childhood obesity on the future health of affected subjects (2).
Body mass index (BMI) is generally used to define obesity clinically (3)because it is easy to calculate, quick to measure and noninvasive. Nevertheless, BMI is a poor index of fatness in individual children (4,5)and has poor sensitivity for categorizing the condition (6). These limita-tions mean that BMI is an inadequate outcome for research on the efficacy of obesity treatment programs (7).
Bioelectrical impedance analysis (BIA) is a rapid, safe
and simple technique for measuring body composition both in the field and in clinical settings (8). Studies on adults have shown that BIA is an easily applicable method for estimating fat-free mass (FFM) (9) or total body water (TBW) (10,11). It is evident from recent studies that the use of BIA for the assessment of body composition in children requires spe-cific prediction formulas differing from those established for adults (12-14). Such formulas have been developed for the prediction of FFM (15-19) and of TBW (12-14) in children. BIA could also be an easily applicable method for the as-sessment of body composition in obese children, but until now it has not been validated for this population.
Body composition of obese adolescent 1165
and time-consuming and require extensive training of technicians. Simple indirect methods for estimating fat-free body mass are needed to obtain accurate estimates of children’s body composition in field studies and clinical settings (12).
The use of the stable isotope deuterium oxide (2H2O)
is a reference technique for measuring TBW. After the ingestion and equilibration of a known dose of 2H
2O in the
body water compartments, 2H
2O concentration serves as
a marker for TBW from which FFM and fat body mass (FM) are derived. The deuterium dilution method (DDM) assumes a constancy of the hydration fraction of FFM, which varies during growth and development. Another very important aspect is the fact that the results obtained by DDM for the various body compartments are being considered by several investigators as the “gold standard” for the study of association with other methods, BIA in particular, for the assessment of body composition in both adults and children (15,16).
If nutritional assessment is limited only to BMI, it will be difficult to determine whether the variation in weight is due to FFM or to FM. Thus, it is important to analyze the associated body composition by BIA. However, since obese patients present changes in the amount of TBW and consequently in the estimated values of FM and FFM, it is necessary to adjust specific formulas to patients with excess body fat, especially adolescents in the process of growth and development.
Therefore, the objectives of the present study were to describe and compare the body composition variables determined by BIA and DDM, to calculate possible corre-lations and agreement between the two methods, and to constructa linear regression model including the anthro-pometric measures.
Subjects and Methods
Subjects
Forty adolescentsaged 10 to 19 years, 11 months and 29 days, with primary obesity (BMI above the 97th percentile) were included in the study (17). Data fromsubjects whose samples were contaminated with diluted deuterium were excluded, and subjects taking medications that might alter body composition were not included.
The subjects were admitted to the University Hospital, Faculty of Medicine of Ribeirão Preto, University of São Paulo (USP). They were evaluated by anthropometry, and their body composition was assessed by multifrequency BIA and DDM. Immediately after the anthropometric exams and BIA, saliva was collected from the subjects and deuterium oxide was offered to them. This permitted the exams to be performed at the same time and under the same conditions, with a consequent constant state of hydration during all methods of body assessment used in the study (18).
Anthropometry
Weight and height were measured by a trained dietitian according to the method of Heymsfield et al. (19). The reference data of the World Health Organization/National Center for Health Statistics/Centers for Disease Control and Prevention 2002 (20) were used. BMI was calculated by the standard formula (weight/height2)using height and
weight and plotted on CDC BMI-for-age curves for girls and boys 2-20 years of age (21).
Multifrequency bioelectrical impedance
The BIA measurement was obtained with the adoles-cents in the supine position with relaxed arms and legs and without any contact with other body parts. The electrodes were placed on the dominant side of the body (right side for right-handed children and left side for left-handed children). Four skin electrodes were placed on the dorsal side of the hand and foot proximal to the metacarpal-phalangeal joint and also between the distal prominences of the radius and ulna and between the medial and lateral malleoli of the ankle, respectively (22). A Bodystat® 1500 (Douglas, Brit-ish Isles) unit equation especially suited for the age group of 6 to 17 years was used for the determination of body composition. This equation only applies to the results of body composition and is automatically selected when the age of the subject is entered (12,23).
Deuterium oxide method
An oral dose of 1 g/kg weight (roughly 1 g/kg weight of a 7% diluted deuterium oxide stock solution) was carefully weighed using a scale with a sensitivity of 0.0001 g (Toledo AB204 scale, Brazil). The solution was prepared in the pharmacy by the gravimetric dilution of a 99.8% deuterium oxide solution (Cambridge Isotopes Laboratories, USA) with filtered tap water under sterile conditions. Saliva (≈2 mL) was collected directlyfrom the children into small sterile vials. The subjects first provided a pre-dose fasted saliva sample to determine the natural deuterium content. The post-dose samples were collected after3 h of equilibrium time, after the administration of deuterium.
All saliva samples were stored in a freezer at -20°C (24). All tubes had screw-on caps and were wrapped with Parafilm® for better sealing, preventing possible losses due
to evaporation during tube manipulation and cross-contami-nation during storage (25).A small extra amount of the saliva sample was stored for eventual confirmation of the results (26).During the equilibration period, subjects remained in the study location, with no food or water intake.
The deuterium enrichment of the samples was measured by isotope ratio mass spectrometry. The saliva sample (300-µL aliquots) was analyzed in triplicate. Samples were equilibrated with 100% ultrapure hydrogen injected into each tube by an automated system, and equilibrium was obtained by platinum catalysis (Thermoquest® platinum
conditions of controlled temperature (25°C). Hydrogen gas was subsequently analyzed with a continuous flow isotope ratio mass spectrometer (Hydra System/ANCA®
20-20, Europe Scientific, UK) at the Mass Spectrometry Laboratory of the Faculty of Medicine of Ribeirão Preto, USP. Tap water, internal standards, and diluted dose were analyzed within each sample batch.
Ethics
The study protocols were conducted according to the principles of the Declaration of Helsinki and were approved by the Human Research Ethics Committee of the University Hospital, Faculty of Medicine of Ribeirão Preto, USP. Writ-ten informed consent was obtained from a parent or legal guardian of each subject.
Statistical analysis
Descriptive measures were calculatedto describe the sample and the measurements of body composition (DDM and BIA). The Shapiro Wilks pre-test and the variance F-test were performed to check if the variables had normal distribution. The variables that did not show a normal distributionwere transformed into a logarithm scale. The measurements of body composition obtained by DDM were compared to those obtained by BIA using the t-test for comparison of the means.
For linear regression models, we considered the values obtained by DDM [FFM (kg), FM (kg), and TBW (%)] as the dependent variables and BIA values of FFM, FM, and TBW as well as weight, height, age, BMI, and gender as the independent variables.
To show the relationship between DDM and BIA, we considered the Pearson product-moment correlation and Bland-Altman plot. Next, we used linear regression to esti-mate the measures of FFM, FM and TBW of DDM by BIA. The estimated model (equation) explains the relationship between DDM and BIA jointly with variables such as gender, weight, height, and age, for all measures. The analyses were obtained with the R version 2.8.1 software and the level of significance was set at P < 0.05 (27).
Results
Forty obese adolescents (22 boys and 18 girls) with a mean age of 11.2 ± 0.9 years were included in the study. Mean body weight was 81.12 ± 22.80 and 73.64 ± 10.01 kg for girls and boys, respectively (P > 0.05). Mean BMI was 33.65 ± 6.88 kg/m2 for girls and 30.46 ± 2.67 kg/m2
for boys (P > 0.05).
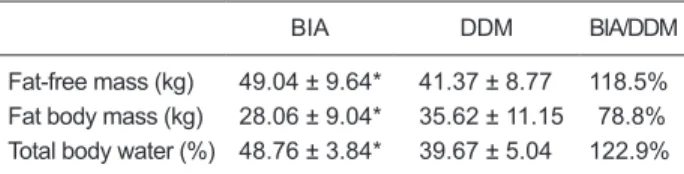
The comparison between the mean values obtained by BIA and by DDM is presented in Table 1. BIA overestimated FFM (118.5%) and TBW (122.9%) and underestimated FM (78.8%) compared to DDM; significant differences were observed in mean FM, FFM, and TBW determined by DDM and BIA.
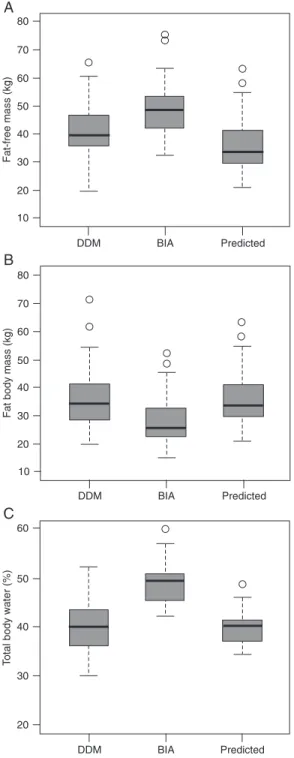
FFM values measured by DDM plotted against those measured by BIA are shown in Figure 1A (left side), with significant correlations between the two methods (r = 0.89; P < 0.001). The Bland-Altman plot (Figure 1A, right side) showed the random nature of the spread with no detectable significant negative bias.
Similarly, FM values measured by DDM plotted against those measured by BIA are shown in Figure 1B (left side), with significant correlations between the two methods (r = 0.93; P < 0.001. The Bland-Altman plot (Figure 1B, right side) showed no significant positive bias.
TBW values measured by DDM plotted against those measured with BIA are shown in Figure 1C, with significant correlations between the two methods (r = 0.62; P < 0.001). The Bland-Altman plot (Figure 1C, right side), showed a significant negative bias.
When the sample was stratified by gender, a strong correlation was found with FFM (r = 0.92; P < 0.001) and FM (r = 0.96; P < 0.001) and a lesser one with TBW (r = 0.58; P = 0.012) for females. The correlation for males was r = 0.74 for FFM (P < 0.001), r = 0.80 for FM (P < 0.001) and r = 0.54 for TBW (P < 0.01).
The estimated equation for the FFM values measured by DDM was: FFM values measured by DDM = 0.842 x FFM values measured by BIA. There was no statistically significant effect for the variables gender, weight, height, age, or BMI in the adjusted linear regression model for FFM values measured by DDM (R2 = 0.99). The estimated
equation presented results similar to those measured by DDM (Figure 2A).
The estimated equation for the FM values measured by DDM was: FM values measured by DDM = 0.855 x FM values measured by BIA + 0.152 x weight (body weight in kg). There was a significant effect of the weight variable on the adjusted linear regression model for the FM vari-able values measured by DDM (R2 = 0.99). The estimated equation presented results similar to those measured by DDM (Figure 2B).
The estimated equation for the TBW values measured by DDM was: TBW values measured by DDM = 0.813 x TBW values measured by BIA. There was no statistically
Table 1. Comparison of body composition data obtained by bio-electrical impedance (BIA) and the deuterium oxide dilution meth-od (DDM) in obese adolescents (22 boys and 18 girls).
BIA DDM BIA/DDM
Fat-free mass (kg) 49.04 ± 9.64* 41.37 ± 8.77 118.5% Fat body mass (kg) 28.06 ± 9.04* 35.62 ± 11.15 78.8% Total body water (%) 48.76 ± 3.84* 39.67 ± 5.04 122.9%
Body composition of obese adolescent 1167
significant effect for the variables gender, weight, height, age, or BMI in the adjusted linear regression model of the TBW values measured by DDM (R2 = 0.99). The estimated
equation presented results similar to those measured by DDM (Figure 2C).
Residue analysis performed for all adjustments revealed the absence of heterocedasticity (residue versus predicted), and the hypothesis of residue (test) normality was not rejected in any adjustment. The eventual outliers detected did not compromise the quality of model adjustment. Table 2 presents a summary of the linear regression models for the measurements of FFM, FM and TBW.
Discussion
In the present article, we report the assessment of body composition of obese adolescents by BIA and DDM. The comparison of the mean values for FM, FFM, TBW deter-mined by DDM and by BIA revealed significant differences (Table 1). The results demonstrated that BIA overestimated the measures of FFM and TBW and underestimated the measure of FM compared to those provided by DDM. As expected, a significant positive correlation and bias (no agreement) by the Bland-Altman plot was observed between the body composition variables obtained by the two
ods. It was possible to predict measures of body composi-tion determined by DDM in obese adolescents using the measures obtained by BIA by means of the adjusted models containing a maximum of two variables, allowing a correction in the BIA values to predict DDM methods. Thus, BIA could
be an alternative inexpensive and practical method to help health professionals obtain a more detailed assessment of body composition when DDM is not possible.
Forty obese adolescents of both genders aged 10 to 19 years (mean age: 11.2 ± 0.9) participated in the study. This same age range was studied in other investigations for the assessment of body composition in adolescents by BIA, anthropometry and DDM (12,23,28,29). In the present study, as in previous ones, no statistically significant differ-ence in weight (P = 0.20) or BMI (P = 0.07) was observed between genders, results that allowed us to perform the analyses as a group instead of separating by gender.
The World Health Organization has suggested the use of BMI for the screening of overweight and obese adolescents because it correlates well with body fat, is easy to obtain, has references for comparison, and permits the continuity of the criterion used to assess adults (30). The BMI is an index for the measurement of excess weight but not of body fat and for this reason there is continuing discussion about its predictive capacity for the identification of young people with elevated body fat (31).
BIA is a safe and noninvasive method that can be ap-plied using portable equipment and is extensively employed to estimate body composition (32). The importance of defining body composition in order to assess and monitor obesity has been well established. However, several factors limit its application to obese adolescents (33). Equations developed for eutrophic individuals usually overestimate FFM in extremely obese adults (30). The validity of BIA is no longer questioned for metabolically stable adults with no significant organic alterations. Its application to pediatrics and neonatology, as well as obesity and undernutrition, has also proved to be viable although it sometimes requires equations adjusted to the target population (22,34,35).
Several investigators have shown that a change in body composition occurs in obese individuals and have
Figure 2. Boxplot values determined by the deuterium oxide dilu-tion method (DDM), by bioelectrical impedance (BIA) and values predicted in the model adjusted by (A) fat-free mass (kg), (B) fat body mass (kg), and (C) total body water percentage (%).
Table 2. Adjusted linear regression models for the determina-tion of fat-free mass (FFM), fat mass (FM) and total body water (TBW) using BIA and DDM on a cohort of obese adolescents (22 boys and 18 girls).
Model Variable Coefficient Standard error P
Model 1 FFMBIA 0.842 0.013 <0.001 Model 2 FMBIA 0.855 0.157 <0.001 Weight 0.152 0.057 0.0135 Model 3 TBWBIA 0.813 0.013 <0.001
Body composition of obese adolescent 1169
concluded that, the greater the percentage of body fat, the lower the TBW (28,36).
Knowing that there is no practicallywater in fatty deposits in the human organism, researchers have been stimulated to define TBW as an important index for the determination of body composition (22). On this basis, the quantitation of TBW is an important resource for the assessment and monitoring of fat mass, which is defined as body weight minus FFM.
We detected significant differences in mean FM, FFM, and TBW determined by DDM and BIA, with BIA overes-timating FFM and TBW values and underesoveres-timating FM values. To the best of our knowledge, there are no studies comparing the body composition values obtained by BIA to those obtained by DDM in obese adolescents.
The present data demonstrate that BIA provides a reli-able estimate of the body composition of obese adolescents compared to DDM, which is considered to be the “gold standard” reference method. The results obtained by BIA strongly correlated with those obtained by DDM regarding the variables FFM (r = 0.89; P < 0.001) and FM (r = 0.93; P < 0.001) and correlated moderatelyregarding TBW (r = 0.62; P < 0.001).
Considering BIA as an instrument capable of measuring changes in body composition, Kushner et al. (37) studied the body composition of 20 obese women who had lost body weight using DDM, BIA and skin folds. The authors detected a significantly high correlation between the data obtained by DDM and BIA (r = 0.971).
When comparing TBW assessed by BIA to TBW as-sessed by DDM in 58 adults, Kushner and Schoeller (10) concluded that BIA proved to be a precise method for predicting the TBW obtained by DDM by means of multiple regression equations. The authors also stated that BIA is a simple, safe and noninvasive method that can be eas-ily used in outpatient clinics. The present study observed associations between DDM (gold standard) and BIA for adjustment of regression equations. The equations sug-gested in this study should be used in obese adolescents in future studies in order to be validated.
Along the same line of investigation, in another study conducted on eutrophic men in order to validate BIA in comparison to DDM, the authors observed a good corre-lation between BIA and DDM for the estimate of body fat, although the values obtained by BIA overestimated body fat (38). In the present study, we also detected a good cor-relation regarding the variable in question, although BIA underestimated FM (78.8%) compared to DDM.
Several studies have been conducted to predict TBW determined by DDM in eutrophic (13) and obese (28) children and adolescents using the measures provided by BIA, by means of equations. These studies used values of resistance indices (height2/resistance), age, weight, and
body surface/impedance in order to adjust the regression model. The present study differs from these investigations in terms of the variables included in the adjustment of the regression model, which were gender, weight, height, age, BMI, FFM, FM, and TBW, and body composition data were obtained by BIA.
The linear regression models proposed in the present study were well adjusted regarding FFM, FM, and TBW. The values of FFM, FM, and TBW obtained by DDM and predicted by the model were quite close to the real values obtained with the reference method. There was a significant effect of weight for the adjustment of the linear regression model: FM by DDM = FM by BIA, and therefore weight was included in the adjusted linear regression model. We did not detect in the literature any study using the same variables as employed in the present investigation for the adjustment of the linear regression model. The variables used are easily accessed in clinical practice.
Several studies have shown that anthropometric measures such as weight, height and skin folds are not applicable to the assessment of body composition. A viable method for the assessment of body composition would be highly desirable in clinical practice for a better monitoring of obese adolescents. BIA is a simple method and its results are obtained rapidly; however, specific formulas must be adjusted for the assessment of children and adolescents, especially in terms of obesity. Thus, the formulas suggested in the present study may help health professionals to as-sess the body composition of obese adolescents, without being limited to the BMI, a criterion that does not assess FM or FFM. However, it is inappropriate to extrapolate these equations outside the limits of the data. In other words, although linear regression models are well adjusted, it is necessary to test their applicability ona sample popula-tion of obese adolescents and possibly to include other important variables in the models. To this end, multiple regression analysis will be necessary in addition to an expanded sample size.
Acknowledgments
Research supported by an MSc grant from CAPES to C.M.M. Resende.
References
1. Giugliano R, Carneiro EC. [Factors associated with obesity in school children]. J Pediatr 2004; 80: 17-22.
2. Batch JA, Baur LA. Management and prevention of obesity
and its complications in children and adolescents. Med J Aust 2005; 182: 130-135.
standard definition for child overweight and obesity world -wide: international survey. BMJ 2000; 320: 1240-1243. 4. Wells JC. A Hattori chart analysis of body mass index in
infants and children. Int J Obes Relat Metab Disord 2000; 24: 325-329.
5. Bartok CJ, Marini ME, Birch LL. High body mass index
per-centile accurately reflects excess adiposity in white girls. J
Am Diet Assoc 2011; 111: 437-441.
6. Reilly JJ, Savage SA, Ruxton CH, Kirk TR. Assessment of obesity in a community sample of prepubertal children. Int J
Obes Relat Metab Disord 1999; 23: 217-219.
7. Haroun D, Wells JC, Williams JE, Fuller NJ, Fewtrell MS, Lawson MS. Composition of the fat-free mass in obese and nonobese children: matched case-control analyses. Int J Obes 2005; 29: 29-36.
8. Fischer H, Lembcke. Die Anwendung der Bioelektrischen Impedananalyse (BIA) zur Beurteilung der Körperzusam-mensetzung in des Ernährungszutandes. Innere Medizin
Aktuell 1991; 181: S13-S17.
9. Segal KR, Van Loan M, Fitzgerald PI, Hodgdon JA, Van Itallie TB. Lean body mass estimation by bioelectrical imped-ance analysis: a four-site cross-validation study. Am J Clin Nutr 1988; 47: 7-14.
10. Kushner RF, Schoeller DA. Estimation of total body water by bioelectrical impedance analysis. Am J Clin Nutr 1986; 44: 417-424.
11. Deurenberg P, van der Kooy K, Leenen R, Weststrate JA,
Seidell JC. Sex and age specific prediction formulas for
estimating body composition from bioelectrical impedance: a cross-validation study. Int J Obes 1991; 15: 17-25. 12. Houtkooper LB, Going SB, Lohman TG, Roche AF, Van Loan
M. Bioelectrical impedance estimation of fat-free body mass in children and youth: a cross-validation study. J Appl Physiol
1992; 72: 366-373.
13. Davies PS, Preece MA, Hicks CJ, Halliday D. The prediction of total body water using bioelectrical impedance in children and adolescents. Ann Hum Biol 1988; 15: 237-240. 14. Danford LC, Schoeller DA, Kushner RF. Comparison of two
bioelectrical impedance analysis models for total body water measurement in children. Ann Hum Biol 1992; 19: 603-607. 15. Raghavan CV, Super DM, Chatburn RL, Savin SM, Fanaroff
AA, Kalhan SC. Estimation of total body water in very-low-birth-weight infants by using anthropometry with and without bioelectrical impedance and H2[(18)O]. Am J Clin Nutr 1998; 68: 668-674.
16. Lof M, Forsum E. Evaluation of bioimpedance spectroscopy for measurements of body water distribution in healthy women before, during, and after pregnancy. J Appl Physiol
2004; 96: 967-973.
17. World Health Organization (WHO). Grow reference 5-19 years. Body mass index for age (5-19 years) percentiles girls and boys. http://www.who.int/growthref/who2007_bmi_for age/en/index.html. Accessed February 12, 2009.
18. Dioum A, Gartner A, Cisse AS, Delpeuch F, Maire B, Wade S, et al. Validity of impedance-based equations for the predic-tion of total body water as measured by deuterium dilupredic-tion in African women. Am J Clin Nutr 2005; 81: 597-604.
19. Heymsfield SB, Tighe A, Wang ZM. Nutritional assessment
by anthropometric and biochemical methods. In: Shils ME, Olsno JA, Shike M (Editors), Modern nutrition in health and
disease. 2nd edn. Malvern: Lea & Febiger; 1994.
20. Ogden CL, Kuczmarski RJ, Flegal KM, Mei Z, Guo S, Wei
R, et al. Centers for Disease Control and Prevention 2000 growth charts for the United States: improvements to the 1977 National Center for Health Statistics version. Pediatrics
2002; 109: 45-60.
21. Center for Disease Control and Prevention (CDC) A. CDC growth charts for the United States: methods and develop-ment. http//:www.cdc.gov/growthcharts.
22. Lukaski HC. Methods for the assessment of human body composition: traditional and new. Am J Clin Nutr 1987; 46: 537-556.
23. Kushner RF, Schoeller DA, Fjeld CR, Danford L. Is the
impedance index (ht2/R) significant in predicting total body
water? Am J Clin Nutr 1992; 56: 835-839.
24. Albernaz E, Victora CG, Haisma H, Wright A, Coward WA. Lactation counseling increases breast-feeding duration but not breast milk intake as measured by isotopic methods. J Nutr 2003; 133: 205-210.
25. Salazar G, Infante C, Vio F. Deuterium equilibration time in infant’s body water. Eur J Clin Nutr 1994; 48: 475-481. 26. Wong WW, Lee LS, Klein PD. Deuterium and oxygen-18
measurements on microliter samples of urine, plasma, sa-liva, and human milk. Am J Clin Nutr 1987; 45: 905-913. 27. Paula G A. Modelos de regressão com apoio computacional.
São Paulo: IME - USP, 2004.
28. Wabitsch M, Braun U, Heinze E, Muche R, Mayer H, Teller W, et al. Body composition in 5-18-y-old obese children and adolescents before and after weight reduction as assessed by deuterium dilution and bioelectrical impedance analysis.
Am J Clin Nutr 1996; 64: 1-6.
29. Eckhardt CL, Adair LS, Caballero B, Avila J, Kon IY, Wang J, et al. Estimating body fat from anthropometry and isotopic dilution: a four-country comparison. Obes Res 2003; 11: 1553-1562.
30. World Health Organization. Physical status: the use and
interpretation of anthropometry. http//:www.who.int/em/.
31. Vieira ACR, Alvarez MM, Martins VMR, Sichieri R, Veiga GV. Desempenho de pontos de corte de índice de massa corporal de diferentes referências na predição de gordura corporal em adolescentes. Cad Saúde Públ 2006; 22: 1681-1690.
32. Eisenkolbl J, Kartasurya M, Widhalm K. Underestimation of percentage fat mass measured by bioelectrical impedance analysis compared to dual energy X-ray absorptiometry method in obese children. Eur J Clin Nutr 2001; 55: 423-429.
33. Wells JC, Fuller NJ, Dewit O, Fewtrell MS, Elia M, Cole TJ. Four-component model of body composition in children: density and hydration of fat-free mass and comparison with simpler models. Am J Clin Nutr 1999; 69: 904-912. 34. Holt TL, Cui C, Thomas BJ, Ward LC, Quirk PC, Crawford
D, et al. Clinical applicability of bioelectric impedance to measure body composition in health and disease. Nutrition
1994; 10: 221-224.
35. Chumlea WC, Guo SS. Bioelectrical impedance and body composition: present status and future directions. Nutr Rev
1994; 52: 123-131.
36. Chumlea WC, Schubert CM, Sun SS, Demerath E, Towne B, Siervogel RM. A review of body water status and the effects of age and body fatness in children and adults. J Nutr Health
Aging 2007; 11: 111-118.
37. Kushner RF, Kunigk A, Alspaugh M, Andronis PT, Leitch CA, Schoeller DA. Validation of bioelectrical-impedance analysis as a measurement of change in body composition in obesity.
Am J Clin Nutr 1990; 52: 219-223.