.
Patterns of species richness and abundance among cactus
communities receiving different rainfall levels in the
semiarid region of Brazil
Paulo Sérgio Monteiro Ferreira1*, Sérgio de Faria Lopes1 and Dilma Maria de Brito Melo Trovão1
Received: March 15, 2016 Accepted: October 3, 2016
ABSTRACT
Th is study examines the variation in cacti species richness and abundance among sites with diff erent average rainfall and soil types. We assessed a total of 3,660 individuals of six species of Cactaceae: Cereus jamacaru, Melocactus zehntneri, Pilosocereus gounellei, Pilosocereus pachycladus, Tacinga inamoena, and Tacinga palmadora. Th e greatest species richness and abundance of cacti were at locations with low rainfall and more clayey soils. Th e species studied diff ered in multidimensional representation, with some species being more positively related to soils with a higher proportion of fi ne particles (M. zehntneri and P. gounellei), while others were negatively related to soils with a higher proportion of coarser particles (T. inamoena) or positively related to areas with higher rainfall and vegetation cover (C. jamacaru and P. pachycladus). Th e diff erential responses of the species of Cactaceae studied in relation to the gradients analyzed demonstrates the need for more research into the relationship between cacti and environmental variables in semiarid ecosystems with high environmental heterogeneity.
Keywords: Caatinga, Cactaceae, environmental gradients, semiarid region, soil granulometry
Introduction
Th e semiarid region ofBrazilis a region of greatdiversity in manyrespects(geomorphological, physiognomic,etc.) (Alves 2009; Moro et al. 2016). Th roughout most of its extent the annual rainfall is equal to or less than 1000 mm (AESA 2014). Furthermore, this precipitation is heterogeneously distributed as a result of two large moisture gradients, one in the north-south direction determined by decreasing precipitation, and the other in the east-west direction due to the eff ect of increasing continentality (Rodal et al. 2008). Th e most common soil of the region is of crystalline origin, but areas of sedimentary soil are also present (Moro et al.
2015; Moro et al. 2016).
Th e Caatinga domain (seasonally dry tropical forest), with features that distinguish it from the other main biomes of the world, exhibits marked variation in its response to environmental heterogeneity, which is related to the interaction among edaphic, climatic and historical factors (Moro et al. 2015). Th e hyperxerophytic vegetation of the Caatinga grows in crystalline soil and is predominant in this phytogeographical region (Moro et al. 2016).
Species of thefamilyCactaceaehave importantadaptive traitsfor surviving xericenvironments, beingmostly leafl ess plantswithsucculent, photosynthetic (cladodes)andspiny trunks andbranches(Buxbaum 1950; Nobel 2002). Cacti
1 Centro de Ciências Biológicas e da Saúde, Universidade Estadual da Paraíba, Baraúnas, 351, 58429-500, Campina Grande, PB, Brazil
also use crassulacean acid metabolism (CAM), which enables more effi cient use of water (Nobel 2003). In Brazil, there are 260 species of 39 genera (Zappi et al. 2016) of Cactaceae, which are often taken as emblematic of Caatinga vegetation (Forzza et al. 2012).
Studies of thesemiaridvegetation inBrazilshow that Cactaceaeis well representedin terms of the number of species (Oliveira et al. 2009; Santos & Melo 2010; Santos et al. 2011; Pereira Júnior et al. 2012), demonstrating the relevance of this family when trying to understand communities of semiarid ecosystems. Furthermore, cacti are usually among the only species remaining original vegetation is transformed by human activities (Zappi & Taylor 2008; Gonçalves et al. 2016).
Studies on species distributions and plant communities can provide information about the environment that is useful in conservation (Moro et al. 2015). Accordingly, initial prospects of using cacti as indicators of environmental gradients are present in the work of Mera et al. (2012), who studied the distribution and diversity of cacti on the western slope of the Peruvian Andes, by correlating these data with climatic parameters of rainfall and potential evapotranspiration and climatic thermicity and aridity indices.
From this perspective, we expected that cactus communities would show the same patterns of variation in species composition and structure in response to environmental variation, but particularly in relation to variation in water availability. Specifi cally among species of Cactaceae, there are many examples of intraspecifi c variation in vegetative characters in response to water and nutrient availability, and levels of solar radiation (Buhanan & Briggs
2010; Menezes et al. 2015).
On the basis of these premises,the presentstudy investigated the species composition and structure ofcactus communities in fourareas of thesemiarid regionof Paraíba, Brazil,with diff erent rainfall levels and edaphic conditions.
Th e following question was posed: is there variation in the composition and structure of cactus communities in relation to environmental heterogeneity on the scale analyzed? Th e hypothesis of this study was that there would be no variation in species composition among the areas analyzed, but that abundance of species would depend on diff erent environmental preferences for water availability and soil parameters. Th is study promises to add to our knowledge about the ecology of cactus species in the Brazilian semiarid region and its Caatinga ecosystem.
Materials and methods
Study area
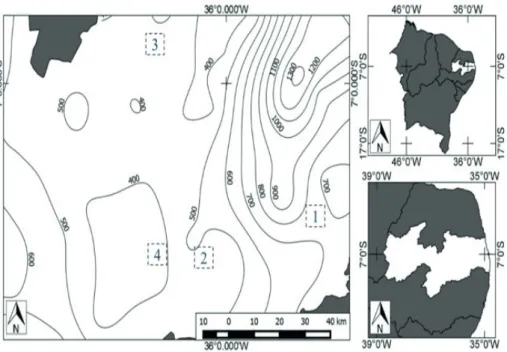
Th e Caatinga is a predominantly shrubby-arboreal, xerophytic, deciduous and thorny vegetation, whose most representative families are Leguminosae (subfamilies Caesalpinoideae, Mimosoideae and Faboideae), Euphorbiaceae and Cactaceae (Rodal et al. 2013). Four areas of Caatinga (A1-A4) were selected for study that had declining levels of mean annual rainfall, and possessed particular properties that indicated they had not been cut for at least the last 20 years, given the diffi culty of fi nding pristine areas because of the historical exploitation of Caatinga vegetation (Fig. 1).
Area A1 has the highest mean annual rainfall with 650 mm (average weather data for the 30 year period of 1961 and 1990; AESA 2014) and a mean temperature of 23°C (INMET 2014). The soils are predominantly sandy with little litter. It is characterized mainly by the presence of trees, including lianas and epiphytes; the other three areas have increasingly more open shrubby land, without lianas and epiphytes, and more exposed soils. Area A2 had the second highest mean annual rainfall with 550 mm (AESA 2014) and a mean temperature of 23°C (INMET 2014), followed by A3 with a mean annual rainfall of 450 mm (AESA 2014), and a mean temperature of 25°C (INMET 2014). Area A4 had the lowest annual rainfall among the four study areas, and the lowest rainfall in Brazil, with 350 mm annually (AESA 2014); its mean temperature is 23°C (INMET 2014). Areas 2 and 4 had the greatest amount of exposed rock.
In each area, we markedthree 1-ha plots that were spaced at least 500 m apart; an adaptationof themethod proposed byRodalet al. (2013). This standardized plot size was chosen in order to include the largest possible number of individuals because of the low density of some species of Cactaceae (Zappi et al. 2011a), the clustering distribution pattern that some species exhibit (Gomez et al. 2013) and their capacity for vegetative propagation (Meiado 2012).
Fieldwork was carried outbetweenJanuary 2013 andDecember 2014. In each plot, we identified all living individuals of cacti belonging to all sizes and life forms, and recorded their diameter at ground level (DGL) and height; height was measured by comparison with a stick of known length (3 m) (Rodal et al. 2013). When high densities of shrubby Cactaceae made it impossible to measure all individuals, we measured all those of a circular area one-fifth the size of the total cactus cluster, and used these data to extrapolate for the entire cluster.
In an attempt to discern a pattern that could be compared with other groups belonging to seasonally dry tropical plant formations (SDTFs) (Moro et al. 2015), found cacti were classified according to Raunkiaer’s classification of life-forms following the suggestions proposed by Moro et al. (2014) in the catalog of vascular plants for the Caatinga Phytogeographical Domain (PCD).
We determinedabsolute density (AD), mean height, mean DGL, volume, Shannon diversity index(H’)and Pielouevenness index (J’) using the program Fitopac Shell, version 2.1.2 (Shepherd 2010). Hutcheson`s t-test was used to compare the diversity indicies for each area using the software PAST 2.17c.
Data for determining mean annual rainfall were gathered from the online platform of the Executive Agency for Water Management of Paraíba State (AESA 2014), which are produced from monthlyand annualclimatological data taken at weather stationsover an average of at leastthirty years. Enhanced vegetation index (EVI) values were obtained through the website SERIES VIEW (Freitas et al. 2011); this is a spectral vegetation index (SVI) using the relationship
between the red, near infrared and blue reflectance by remote sensing to infer the vegetation cover of a certain area (Huete et al. 2002).
In each plot, wemeasuredthe coordinatesandterrain elevationusing a GarmineTrex30 GPS,andcollected soil for determiningparticle sizebyscreening. Soil samples were collected from 0-20 cm deep at three random points of each plot, and combined. The samples were dried in an oven at 105 °C for 24 hours and then placed on a shaking platform and sieved using p2 (>2 mm), p500 (<0.5 mm), p250 (>0.25/<0.5 mm), p63 (>0.038/<0.063 mm) and c (<0.038 mm) sieves.
Non-metric multidimensional scaling (MDS), with a distance matrix calculated by the Bray-Curtis similarity, was used as the a prioritest to observe tendencies in spatial variation. The MDS arranges the data along two dimensions, thus showing which areas are more similar (in composition and abundance) in relation to environmental factors. The suitability of the ordination was verified by the stress value, which indicates the relationship between the Euclidean distance among the samples and the ordination axes. (Clarke & Warwick 2001).
Subsequently, we performed a PERMANOVA
permutationanalysis(with999permutations) (Anderson et al. 2008) to test the significance of differences among
ordering patterns formed by MDS, and a pairwise test (post-hoc test) to identify which pairs of groups differed statistically. The significance of each pairwise comparison was determined by Monte Carlo test (Gotelli & Ellison 2011).
As an exploratory test to search for a predictive model that could suggestthe environmental variables that would best relate to the variation in cactus communities, a biotic environmental (BIO-ENV) analysis was performed. This analysis used the abiotic and biotic data to construct similarity matrices, whose rankings were compared by using Spearman’s coefficient (ρ) (Clarke & Warwick 2001).
Thepredictor variablesidentified by BIO-ENV were related to species by way of a canonical correspondence analysis (CCA). This analysis allows the variation among cactus communities to be observed as they relate directly to variation in the predicted environmental factors (Braak 1995). These statistical analyses were performed using the statistical program PRIMER 6.0 + PERMANOVA (Clarke & Warwick 2001).
Results
A total of 3,660 individual cacti were sampled of six species belonging to four genera: Cereus jamacaru,
Table 1. Average abundance (and standard deviation) of species of Cactaceae in four areas sampled in semiarid region of Brazil and Raunkiaer’s life forms. A1 = highest rainfall; A2 = medium-high rainfall; A3 = medium-low rainfall; A4 = lowest rainfall; Ph = phanerophyte; Ch = chamaephyte.
Species (Raunkiaer) A1 A2 A3 A4
C. jamacaru (Ph) 11.7 (7.6) 13.0 (22.5) 3.3 (5.8) 7.7 (13.4)
M. zehntneri (Ch) 0.0 22.0 (22.1) 4.3 (4.0) 16.0 (26.2)
P. gounellei (Ph) 0.0 40.0 (15.7) 0.7 (1.2) 225.0 (146.4)
P. pachycladus (Ph) 37.7 (14.0) 32.3 (26.1) 29.0 (3.6) 6.0 (7.8)
T. inamoena (Ch) 14.0 (24.2) 26.0 (33.5) 123.3 (210.2) 57.3 (96.9)
T. palmadora (Ch) 0.0 75.7 (27.9) 313.7 (210.9) 135.3 (140.7)
Total 196 642 1447 1375
Table 2. Average (and standard deviation) of structural parameters of the study areas and proportion of abundance of Raunkiaer’s life forms sampled in semiarid region of Brazil. A1 = highest rainfall; A2 = medium-high rainfall; A3 = medium-low rainfall; A4 = lowest rainfall; Ph = phanerophyte; Ch = chamaephyte; AD = absolute density; H = mean height; DGL = mean diameter at ground level; H’ = Shannon-Wiener diversity index (a, b, and c in decreasing order of importance, represent areas whose diversity differs significantly (p <0.05)); J’ = Pielou evenness index; V = volume of cactus.
A1 A2 A3 A4
Ph/Ch 78/22% 41/59% 7/93% 53/47%
AD (ind/ha) 63.3 (16.9) 209.0 (47.8) 474.3 (178.9) 447.3 (160.0) H (m) 4.9 (2.0) 1.6 (0.6) 0.8 (0.6) 1.0 (0.1) DGL. (cm) 13.3 (3.0) 9.0 (0.9) 4.3 (0.8) 5.5 (0.6)
H’ 0.95c 1.64a 0.88c 1.21b
J’ 0.86 0.91 0.49 0.67
V (m3) 7.1 (1.7) 6.9 (7.9) 1.6 (1.8) 2.3 (1.4)
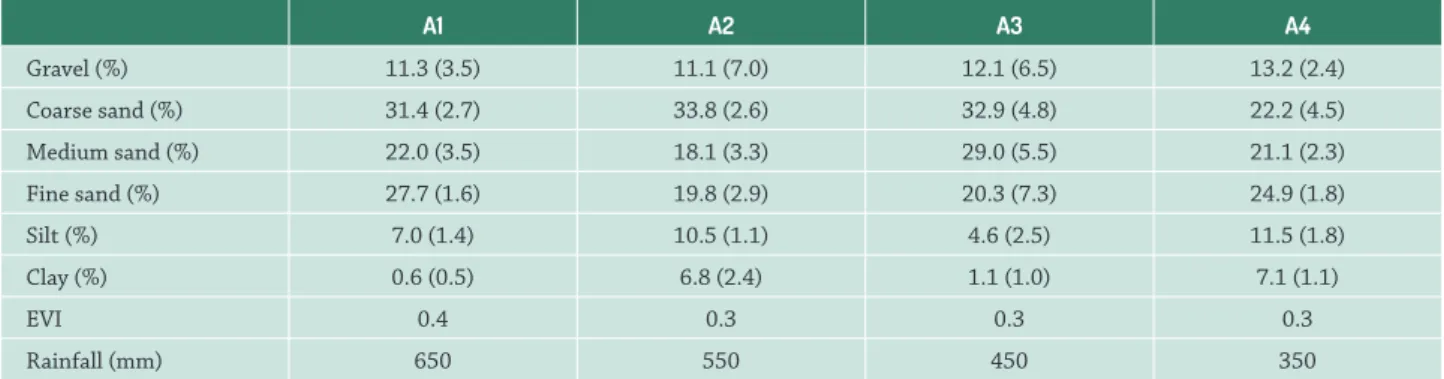
Table 3. Average (and standard deviation) of environmental variables in relation to study areas sampled in semiarid region of Brazil. A1 = highest rainfall; A2 = medium-high rainfall; A3 = medium-low rainfall; A4 = lowest rainfall; EVI = enhanced vegetation index.
A1 A2 A3 A4
Gravel (%) 11.3 (3.5) 11.1 (7.0) 12.1 (6.5) 13.2 (2.4) Coarse sand (%) 31.4 (2.7) 33.8 (2.6) 32.9 (4.8) 22.2 (4.5) Medium sand (%) 22.0 (3.5) 18.1 (3.3) 29.0 (5.5) 21.1 (2.3) Fine sand (%) 27.7 (1.6) 19.8 (2.9) 20.3 (7.3) 24.9 (1.8) Silt (%) 7.0 (1.4) 10.5 (1.1) 4.6 (2.5) 11.5 (1.8) Clay (%) 0.6 (0.5) 6.8 (2.4) 1.1 (1.0) 7.1 (1.1)
EVI 0.4 0.3 0.3 0.3
Rainfall (mm) 650 550 450 350
Structural datashowed that A1 wasmainly characterized by tallerindividuals(4.9+2.0 m), with larger diameters (13.3+3.0 cm) and greater mean volume (7.1+1.7 m3) than the other areas. A2 had the greatest diversity (H’ = 1.64; p<0.01) and evenness (J’ = 0.91), with a mean volume close to that of A1 (6.9+7.9 m3). A3 had the lowest values for diameter (4.3+0.8 cm), height (0.8+0.6 m), diversity (H’ = 0.88), evenness (J’ = 0.49) and volume (1.6+1.8 m3). Finally, A4 showed, in most cases, intermediate values between A2 and A3 (Tab. 2). Of the four areas analyzed, the lowest values of abundance and richness were seen in A1, which had the highest mean annual rainfall (650 mm). The other areas
had equivalent species richness, but abundance increased gradually with decreasing rainfall (Tab. 3).
Th epredictive model produced by the BIO-ENV analysis foundthat the variablesmost correlated with an infl uence on the structureof the cactuscommunities studied were clayandEVI(r = 0.74; p < 0.001, the greatest values of correlation). CCA eigenvalues were 0.275 for axis 1 and 0.091 for axis 2, and together they explained a total of 51.06% (axis 1 = 38.33% and axis 2 = 12.73%) of the variation among cactus communities in relation to environmental variables (Fig. 3).
Speciesstructurepatternsdiff ered with regard to the ordination axesgiven by theBIO-ENV predictive model. C. jamacaru and P. pachycladus proved to be positively correlated with the variables EVI and precipitation, whereas M. zehntneri and P. gounellei were positively correlated with soils with the highest percentage of clay and silt. Th e structure patterns for T. inamoena were negatively correlated with percentage of medium-sized sand, whereas T. palmadora had no patterns correlated with the variables given by BIO-ENV.
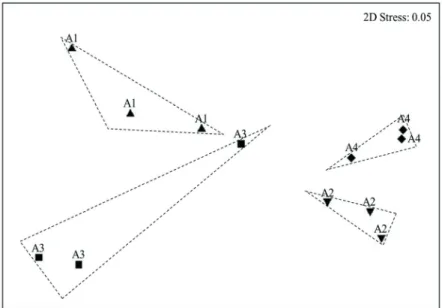
Figure 2. Non-metric multidimensional scaling (MDS) of study areas in relation to the environmental factors tested.
Discussion
Cacti species richness did not vary greatly among areas. This may be because we did not consider the entire extent of the temperature gradient. The greatest distance between study areas was approximately 40 km, which we expected to be the correct scale for limitation of species distributions (Godínez-Álvares et al. 2003). However, all areas except A1 (highest rainfall) possessed the same six common species of the Caatinga ecosystem. Variation among these cactus communities was therefore related to differences in the proportion of life forms, abundance, height, and diameter, possibly because of their different environmental preferences, as demonstrated by the different values for density and volume.
Despite variation in the proportions of Raunkiaer’s life forms, we did not find a consistent pattern in relation to the gradient tested in our research (Tab. 2). However, the apparent increasing importance of chamaephytes with decreasing rainfall, and the opposite for phanerophytes, is interesting. Further investigation of this result is needed, and should incorporate a greater number of samples and encompass a greater extent of the gradients in semiarid regions, including Caatingas that exist in different geological parts of the semiarid region (see Moro et al. 2016).
MDSrevealedthe separationof the samplesinto four groupswith astress levelof 0.09,which demonstratesa good representation of the data, and minimalinformation loss causedby the decrease indimensions of thetwo-dimensional representation itself(Clarke &Warwick2001). The analysis
suggested that the groups reflected differences in structural characteristics and abundance among areas, which could be correlated with environmental variables in each case. The structural data showed that the highest diversities (H’) of cacti were in A2 and A4, which had a mean annual rainfall of less than 650 mm and higher percentages of fine soil particles (clay and silt), which supposedly allows for a greater water-retention capacity than do other soil particle sizes (Nobel 2003; Gurevich et al. 2009). More studies are needed to infer about the relationship between granulometry and water retention in Brazilian soils, but some studies have found a tendency for soils with a greater proportion of fine particles to possess a greater capacity for water retention (Oliveira et al. 2002; Costa et al. 2013).
The arrangement of cactus species according to environmental factors (CCA) with low eigenvalues (<0.5), indicated that the variation among communities was related to differences in species abundance and not necessarily to their replacement (Braak 1995). Thus, structures of the cactus communities are linked to specific physiological mechanisms of species adapted to certain environmental factors. Some species were positively correlated with environments with more available moisture, such as P. pachycladus and C. jamacaru. Other species, such as, M. zehntneri and P. gounellei, are better suited to environments
where the soil has a greater water-storage capacity. Tacinga inamoena was correlated with sandier soils and T. palmadora was the most abundant species among the habitats analyzed. Differences indiversity values among areas were due tovariation in cactispeciesdominance (Gurevich et al.
2009). The dominance of T. palmadora in A3 (medium-low rainfall) might be related to the Allee effect at both the intra- and interspecific levels (Courchamp et al. 1999). Its strong capacity for vegetative propagation (Meiado 2012), suggests a decrease in the importance of intraspecific competition. Furthermore, its presence in association with large expanses of Bromelia laciniosa, with which it shares pollinators (birds) (Leal et al. 2006), may be explained by optimal foraging theory (OFT), which postulates that the choice of feeding areas by birds is determined by the availability of resources, under the premise of maximizing energy (Begon et al. 2007). Cereus jamacaruis a species with a wide distribution in the Brazilian semiarid ecosystem (Zappi et al. 2016), however, it was always observed in low abundance in this study (107 individuals). This can be partly explained by the anthropogenic pressure it suffers by being used for forage during prolonged droughts (Cavalcanti & Resende 2006; Gonçalves et al. 2016). The genus Pilosocereus is also well represented in surveys of Brazil’s semiarid region (Zappi et al. 2016), and is often represented by P. pachycladus in environments with mean annual rainfall over 500 mm (Silva et al. 2010; Pereira Júnior et al. 2012) or by P. gounellei in environments with mean annual rainfall lower than 500 mm (Oliveira et al. 2009; Santos et al. 2009; Santos & Melo 2010; Tölke et al. 2011) or by both species, as was the case in the present study.
The association of the abundance of M. zehntneri and P. gounellei with areas with higher percentages of clay and silt, suggests that these species have a stronger preference for semiarid areas with rocky soils and large fine particles. However, this result needs to be verified with studies that add new parameters to focus on understanding the distribution of these species in areas with exposed rocks (Fabricante et al. 2010; Zappi et al. 2011b) and the specific physiological mechanisms involved.
The presenceof P. pachycladus at sites of increased precipitation and higher EVI values, corroborates studies showing that this cactus occurs in semiarid areas that have greater rainfall (Alcoforado-Filho et al. 2003; Silva et al. 2010) and sandy soils, common characteristics of the Caatinga (Andrade-Lima 1981).
Conclusions
particles (M. zehntneri and P. gounellei) and high rainfall (C. jamacaru and P. pachycladus), and a negative relationship with coarse soil particles (T. inamoena). These data are important for understanding the formation of distribution patterns and diversity among cactus communities. They also indicate that cactus communities can be used as indicators throughout the unique environmental heterogeneity of the Brazilian semiarid region. Finally, our data suggest the need for further research aimed at filling in the gaps this study has identified in understanding species ecology.
References
AESA - Agência Executiva de Gestão das Águas do Estado da Paraíba. 2014. http://site2.aesa.pb.gov.br/aesa/medicaoPluviometrica.do?metodo= listarClimatologiasMensais. 23 Jun. 2014.
Alcoforado-Filho FG, Sampaio EVSB, Rodal MJN. 2003. Florística e Fitossociologia de um remanescente de vegetação caducifólia espinhosa arbórea em Caruaru, Pernambuco. Acta Botanica Brasilica 17: 287-303. Alves JJA. 2009. Caatinga do Cariri Paraibano. Geonomos 17: 19-25. Anderson MJ, Gorley RN, Clarke KR. 2008. PERMANOVA + for PRIMER:
guide to software and statistical methods. Plymouth, PRIMER-E. Andrade-Lima D. 1981. The caatingas dominium. Revista Brasileira de
Botânica 4: 149-153.
Begon M, Townsend CR, Harper JL. 2007. Ecologia de indivíduos a ecossistemas. 4th. edn. Porto Alegre, Artmed.
Braak CJF. 1995. Ordination. In: Jongman RHG, Braak CJF, Tongeren OFR. (eds.) Data analysis in community and landscape ecology. Cambridge, Cambridge University Press. p. 91-173.
Buhanan ML, Briggs JM. 2010. Phenotypic plasticity in response to short term nutrient availability in Cylindropuntia fulgida (Cactaceae). Haseltonia 16: 91-100.
Buxbaum F. 1950. Morphology of cacti. Pasadena, Calif, Abbey Garden Press.
Cavalcanti NB, Resende GM. 2006. Consumo do mandacaru (Cereus jamacaru P. DC.) por caprinos na época da seca no semiárido de Pernambuco. Revista Caatinga 19: 402-408.
Clarke KR, Warwick RM. 2001. Changes in marine communities - An approach to statistical analysis and interpretation.2nd. edn. Plymouth, PRIMER-E.
Costa A, Albuquerque J A, Almeida JA, Costa A, Luciano RV. 2013. Pedotransfer functions to estimate retention and availability of water in soils of the state of Santa Catarina, Brazil. Revista Brasileira de Ciências do Solo 37: 889-910.
Courchamp F, Clutton-Brock T, Grenfell B. 1999. Inverse density dependence and the Allee effect. Tree 14: 405-410.
Fabricante JR, Andrade LA, Marques FJ. 2010. Caracterização populacional de Melocactus zehntneri (Britton & Rose) Luetzelburg (Cactaceae) ocorrente em um inselbergue da Caatinga paraibana. Biotemas 23: 61-67.
Forzza RC, Baumgratz JFA, Bicudo CEM,et al. 2012. New Brazilian floristic list highlights conservation challenges. BioScience 62: 39-45. Freitas RM, Arai E, Adami M, et al. 2011. Virtual laboratory of remote
sensing series: visualization of MODIS EVI2 data set over South America. Journal of Computational Interdisciplinary Sciences 2: 57-64. <http://www.dsr.inpe.br/laf/series/index.php>. 18 Dec. 2014. Godínez-Álvarez H, Valverde T, Ortega-Baes P. 2003. Demographic trends
in the Cactaceae. The Botanical Review 69: 173-203.
Gomez VGN, Quirino ZGM, Machado IC. 2013. Pollination and seed dispersal of Melocactus ernestii Vaupel subsp. ernestii (Cactaceae) by lizards: an example of double mutualism. Plant Biology 16: 315-322. Gonçalves PHS, Albuquerque UP, Medeiros PM. 2016. The most
commonly available woody plant species are the most useful for human populations: A meta-analysis. Ecological Applications. doi: 10.1002/eap.1364
Gotelli NJ, Ellison AM. 2011. Princípios de estatística em ecologia. Porto Alegre, Artmed.
Gurevitch J, Scheiner SM, Fox GA. 2009. Ecologia Vegetal. Porto Alegre, Artmed.
Huete A, Didan K, Miuira T, Rodriguez EP, Gao X, Ferreira LG. 2002. Overview of the radiometric and biophysical performance of the MODIS vegetation indices. Remote Sensing of Environment83: 195-213.
INMET - Instituto Nacional de Meteorologia. 2014. <http://www.inmet. gov.br>. 01 May 2014.
Leal FC, Lopes AV, Machado IC. 2006. Polinização por beija-flores em uma área de caatinga no Município de Floresta, Pernambuco, Nordeste do Brasil. Revista Brasileira de Botânica 29: 379-389.
Meiado MV. 2012. Propagação sexual e assexual estruturando populações de Tacinga palmadora (Britton & Rose) N. P. Taylor & Stuppy, um cacto endêmico da Caatinga. Revista de Biologia Neotropical 9: 6-13. Menezes MOT, Taylor NP, Zappi DC, Loiola MIB. 2015. Spines and ribs of
Pilosocereus arrabidae (Lem.) Byles & G.D. Rowley and allies (Cactaceae): Ecologic or genetic traits? Flora: Morphology, Distribuition, Functional Ecology of Plants. 214: 44-49.
Mera AG, Orellana JAV, Perea EL, Cruz JC, Vera CT, Benavides FV. 2012. Patrones de distribución de las comunidades de Cactáceas en las vertientes occidentales de los Andes peruanos. Caldasia 34: 257-275. Moro MF, Lughadha EN, Filer DL, Araújo FS, Martins FR. 2014. A catalogue
of the vascular plants of the Caatinga phytogeographical domain: a synthesis of floristic and phytosociological surveys. Phytotaxa 160: 001-118.
Moro MF, Silva IA, Araújo FS, Lughadha EN, Meagher TR, Martins FR. 2015. The role of edaphic environment and climate in structuring phylogenetic pattern in seasonally dry tropical plant communities. PLoS ONE. 10(3): 1-18. doi:10.1371/journal.pone.0119166 Moro MF, Lughadha EN, Araújo FS, Martins FR. 2016. A phytogeographical
metaanalysis of the semiarid Caatinga domain in Brazil. Botanical Review 82: 91-148.
Nobel PS. 2002. Cacti. Biology and uses. Berkeley and Los Angeles, University of California Press.
Nobel PS. 2003. Environmental Biology of Agaves and Cacti. Cambridge, Cambridge University Press.
Oliveira LB, Ribeiro MR, Jacome PK, Rodrigues JVV. 2002. Funções de pedotransferência para predição da umidade retida a potenciais específicos em solos do Estado de Pernambuco. Revista Brasileira de Ciência do Solo 26: 315-323.
Oliveira PTB, Trovão DMBM, Carvalho ECD, Souza BC, Ferreira LMR. 2009. Florística e fitossociologia de quatro remanescentes vegetacionais em áreas de serra no Cariri paraibano. Revista Caatinga 22: 169-178. Pereira Júnior LR, Andrade AP, Araújo KD. 2012. Composição florística
e fitossociológica de um fragmento de caatinga em Monteiro, PB. Holos 6: 73-87.
Rodal MJN, Costa KCC, Silva ACBL. 2008. Estrutura da vegetação caducifólia espinhosa (Caatinga) de uma área do sertão central de Pernambuco. Hoehnea 35: 209-217.
Rodal MJN, Sampaio EVSB, Figueiredo MA. 2013. Manual sobre métodos de estudos florístico e fitossiciológico: Ecossistema Caatinga. Brasília, Sociedade Botânica do Brasil.
Santos ACJ, Melo JIM. 2010. Flora Vascular de uma área de caatinga no estado da Paraíba – Nordeste do Brasil. Revista Caatinga 23: 32-40. Santos MFAV, Guerra TNF, Sotero MC, Santos JIN. 2009. Diversidade e
densidade de espécies vegetais da caatinga com diferentes graus de degradação no município de Floresta, Pernambuco, Brasil. Rodriguésia 60: 389-402.
Santos RM, Barbosa ACMC, Almeida HS, et al. 2011. Estrutura e florística de um remanescente de caatinga arbórea em Juvenília, norte de Minas Gerais, Brasil- MG. Cerne 17: 247-258.
Shepherd GJ. 2010. FITOPAC 2.1.2. Campinas, Departamento de Biologia Vegetal, Universidade Estadual de Campinas.
Tölke EEAD, Silva JB, Pereira ARL, Melo JIM. 2011. Flora vascular de um inselbergue no estado da Paraíba, Nordeste do Brasil. Revista Biotemas 24: 39-48.
Zappi D, Taylor N, Santos MR. 2011a. Conservação das Cactaceae do Brasil. In: Silva SR. (org.) Plano de ação nacional para a conservação das cactáceas. Vol. 24. Brasília, ICMBIO, Série Espécies Ameaçadas. p. 29-30.
Zappi D, Taylor N, Santos MR. 2011b. Domínios Fitogeográficos. In: Silva
SR. (org.) Plano de ação nacional para a conservação das cactáceas. Vol. 24. Brasília, ICMBIO, Série Espécies Ameaçadas. p. 30-38. Zappi D, Taylor N, Santos MR, Larocca J. 2016. Cactaceae in Lista de