Water resources resilience and social perception of water scarcity in Tacloban, Philippines
Rita Marteleira, Researcher, PhD Candidate, CICS.NOVA – Interdisciplinary Center of Social Sciences, New University of Lisbon (corresponding author)
[email protected] (+351) 917 755 016
Av. De Berna, 26C
1069-061 Lisboa, Portugal
Pedro Santos Coelho, Assistant Professor, DCEA – Department of Environmental Engineering, Faculty of Sciences and Technology, New University of Lisbon Maria José Roxo, Full Professor, CICS.NOVA – Interdisciplinary Center of Social Sciences, New University of Lisbon
Abstract
Tacloban, Philippines, the city most harshly devastated by typhoon Haiyan in 2013, faces severe water supply constraints, particularly on the northern relocation sites which are expected to accommodate part of its population in a near future. Consequently, relocated families are moving back to storm-surge prone areas in the city.
Under a holistic view of resilience, the urgency of the development of water supply infrastructures on northern Tacloban was confirmed via a household survey, incorporating the social perception as a factor of resilience. In this context, a household survey was conducted, and from the 282 respondents, 55.0% pointed water supply as a top priority to be developed so as to increase their household resilience. Moreover, from mapping these results it became evident that almost the totality of households in the relocation areas in Tacloban North stressed water supply as a top priority issue to be solved.
The main goal of this research was to quantify the impacts of climate change on the hydrological system on which the city relies for water supply purposes. QSWAT was used to evaluate the rivers flows which represent potential sources of water for the supply solutions currently being considered. Results showed that, regardless of the chosen supply solution, for certain time periods (most severely for the trimester of March to May) the percentage of days in which the river flows were insufficient to meet the proposed water catchment rates was significant. Moreover, it became evident that Pongso and Cabayugan Rivers on northern Leyte represent a resilient water source to supply the new resettlement areas.
This work is expected to contribute to the enforcement of the role of hydrological models in resilience studies - specifically in the developing world countries where data collection is scarcer – and to support the resilience-enhancing practices on local water resources planning and management.
Introduction
perturbation - in fact, the origin of this word is in Latin, where resilio means to jump back. During the last decade, the concept of resilience has conquered some space in a variety of academic disciplines discussions and the idea of resilience enhancement has experienced an increase in popularity during climate change (CC) discussions, especially those regarding adaptation (Duijnhoven e Neef 2014). Consequently, it has become more and more present on the vocabulary of related organizations, either of worldwide, regional or local scope. Hence, resilience appears as a concept with a direct application potential, especially when moving from disaster recovery towards hazards prediction, disaster prevention and preparedness (Klein, Nicholls e Thomalla 2003). Amongst the difficulties of enhancing resilience is the fact that natural hazards are often unpredictable and the complexity of social responses to them makes it hard to anticipate them properly and support robust resilience-enhancement strategies. Additionally, it is frequent that disasters achieve such a magnitude that surpasses existing models and regular response plans – with resilience efforts frequently underestimating the disaster consequences and their indirect impacts on other sectors (Duijnhoven e Neef 2014).
In the hazards discussions, the resilience models often focus solely the improvement of infrastructures (robustness, redundancy, resourcefulness and rapidity) to reduce their probability of failure. From this perspective, critical infrastructure systems (such as water, power or transport utilities) have a determinant role in the communitywide disaster mitigation, thus being high-priority targets for resilience enhancement.
However, some authors distinguish between hard and soft resilience – the former linked to the “direct strength of structures or institutions when placed under pressure”, and the latter defined as “the ability of systems to absorb and recover from the impact of disruptive events, depending on their flexibility and adaptive capacity of the system as a whole”, rather than just strengthening infrastructures (Proag 2014). In fact, frequently the models focusing only on hard resilience do not comprehend antecedent social factors that are observable at the local level (Cutter, et al. 2008), as resilience can come from several sources and is thus relevant to look holistically at them.
Resilience indicators for water resources focus mostly on water scarcity or quality degradation issues. Possible indicators for water scarcity are average precipitation, average river flows, and average soil moisture or groundwater level – these are examples of components which can be accurately studied through hydrological modeling, facilitating the benchmarking of various scenarios and the development of a sensitivity analysis to better understand the weight of each variable. Whilst CC has recently become a matter of the utmost importance in water studies, hence it is capable of altering water availability worldwide by the variation of rainfall patterns, the coupling of hydrological and climate studies is a relatively young discipline (Teutsschbein 2013).
Case study presentation
to ever make a landfall) which roared ashore on November 8th, 2013, causing catastrophic destruction and over 6000 casualties (NDRMMC 2014).
To the present day, the city is undergoing major relocation efforts towards a northern territory that will create new residential, institutional and commercial areas on a supposedly storm-surge-safer zone. However, this resettlement area that will accommodate circa 40% of Tacloban’s population in 2018, is lacking a solid water supply solution and some solutions are still being evaluated. As a consequence, relocated families are fleeing back to the city, rebuilding their homes in markedly dangerous flood-prone areas, as Santos and his colleagues have foreseen it could happen (Santos, et al. 2016).
The goal of this research was, therefore, to quantify the impacts of CC on the hydrological system on which Tacloban relies for water supply purposes. Under a holistic view of resilience, the urgency of the development of water supply infrastructures on northern Tacloban (acknowledged on field trips) was confirmed via a household (HH) survey, incorporating the social perception as a factor of resilience.
This work is expected to contribute to the enforcement of the role of hydrological models in resilience studies - specifically in the developing world countries where data collection is scarcer – and to support the resilience-enhancing practices on local water resources management.
Methods
Tacloban’s household survey
The Oscar M. Lopez Center is a non-profit organization, based in Manila, Philippines, which strives to generate science-based solutions to adapt to the risks and impacts of CC and various other climate-related hazards. After Haiyan, OML Center has conducted several studies in Tacloban city and its surrounding municipalities, one of which WaCE – Weather, Climate and Ecosystems Program, which aims at improving Leyte communities’ resilience by making climate information usable.
In this context, a household (HH) survey was conducted in the City of Tacloban from March 14th to 18th, 2016, comprising 282 households across 53 of the city’s 138 barangays (the smallest administrative unit in the Philippines, approximately the common concept of neighborhoods). The survey covered the following topics: 1) HH information; 2) knowledge and awareness on weather, climate change and hazards; 3) social cohesion and community connectedness; 4) personal wellbeing, beliefs and values; and 5) HH and community resilience. The most relevant data consisting of the HH GPS coordinates was also noted, which allowed geo-referencing of the survey results.
Hydrological Modeling with QSWAT
QSWAT, a QGIS-based version of SWAT – Soil and Water Assessment Tool, was used to replicate Tacloban’s surrounding water lines behavior under climate change impacts (for more detail on QSWAT functioning, set up and outputs visualization options, refer to the work of Dile et al. (2016)).
Regarding data sources, the 30 meters DEM (Digital Elevation Model) raster file was obtained from Earth Explorer, a database from the US Geological Survey, whilst the streams shapefile downloaded from DIVA-GIS - it was determined that a threshold of 50 km2 for delineating watersheds was adequate to match the created stream network, providing sufficient detail for the objectives of the study. The required land use map was downloaded from the WaterBase database, a service provided by the United Nations University, whilst the soil map used was one from FAO. Tacloban city’s weather station is installed 2.71m above the sea level in the peninsula that hosts the city airport (11º12’32.21”N, 125º01’29.92”E) and is managed by the Philippine Atmospheric, Geophysical and Astronomic Services Administration - PAGASA. Daily data records from this station, for the period of January 1st, 1979, to December 31st, 2010, were collected for: precipitation (mm), temperature (min and max, ºC), relative humidity (%) and wind speed (m/s). Only the solar radiation series was extracted from the Global Weather database hence these records were not available for Tacloban - assuming that using solar radiation data from a different station would not have significant impacts on the modeling outputs, considering the proximity of the stations, similar elevation and no relevant orographic occurrences between them. With these climatic series, the Weather Generator Tables (WGEN) were created according to Neitsch et al (2011) model description.
The annual, monthly and daily rainfall data collected from a synoptic station are random variables (assuming that rainfall events are independent from each other) which are only useful if validated through a statistical analysis. If a sufficiently long series of rainfall records is available, one can determine which probability distribution function is closer to the empirical distribution of the data. One of the main advantages of adjusting such function is that it further allows extrapolating values with a return period superior than the period of the analyzed sample (with a comfortable confidence degree, usually around 1-α=0.95). The statistical validation of the precipitation series was performed, by adjusting a Gaussian distribution function to the annual average records and the quality of this adjustment tested with the Chi-Squared and the Kolmogorov-Smirnov tests.
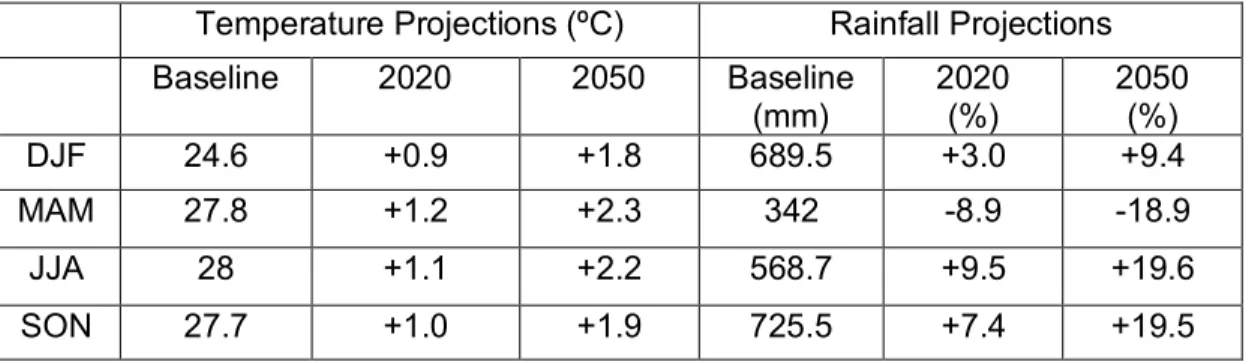
This analysis comprised the following modeling scenarios: baseline (1980-2010), CC2020 (2007-2036) and CC2050 (2037-2065). The two new series for projected CC scenarios of 2020 and 2050 were created consistently with PAGASA’s official projections for Leyte, summarized on Table 1, obtained via the UK’s Met Hadley Center Regional Climate Model data, considering a baseline period of 1971 to 2000.
Table 1 - Seasonal temperature increases (ºC) and rainfall variation (%) in 2020 and 2050 under medium-range emission scenario for Leyte, Region 8 (adapted)
(PAGASA 2011)
Temperature Projections (ºC) Rainfall Projections
Baseline 2020 2050 Baseline (mm)
2020 (%)
2050 (%)
DJF 24.6 +0.9 +1.8 689.5 +3.0 +9.4
MAM 27.8 +1.2 +2.3 342 -8.9 -18.9
JJA 28 +1.1 +2.2 568.7 +9.5 +19.6
SON 27.7 +1.0 +1.9 725.5 +7.4 +19.5
The QSWAT modeling results for Tacloban were then calibrated using a series of observed monthly average flow gauge records for the Sapiniton Gauging Station, from 1985 to 2003, measured by USAID local teams. To assess the similarity of observed and obtained results, simple correlation functions were applied.
Water resources resilience analysis
In accordance with the supply constraints that Tacloban faces and the supply proposals currently considered, two supply solutions were evaluated:
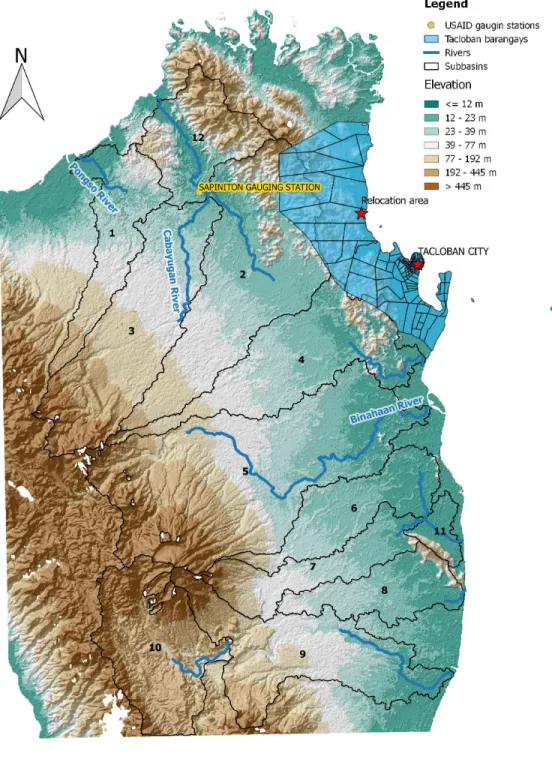
• the ‘business-as-usual’ scenario, in which the local water utility keeps extracting water from Binahaan River to supply the whole community (including Tacloban City and the seven supplied municipalities of Dagami, Palo, Pastrana, Sta. Fé, Tabontabon, Tanauan and Tolosa, plus the Tacloban North resettlement areas) - considering a withdrawal rate of 0.72 m3/s;
• and the USAID-proposed complementary solution of resorting to the northern Leyte rivers (with an extraction rate of 0.58 m3/s), Pongso and Cabayugan, to supply the new resettlement areas - whilst the City of Tacloban and surrounding municipalities continued to receive water from the Binahaan River (0.72 m3/s).
The modeled daily flows for the three scenarios, and for the three rivers relevant to the considered supply solutions, were subject of a resilience analysis: it was determined the number of days in which the rivers flows were lower than the proposed water withdrawal, expressed in a percentage of total days and discretized into four trimesters to assess possible seasonal variations of water availability (Equation 1).
% 𝑜𝑓 𝑑𝑎𝑦𝑠 = *+ ,-./ 012+2 3450671+2/154, 58 7+9:2/72+
Results and Discussion Tacloban’s household survey
These results confirmed the opinions collected during the fieldtrips to Tacloban, either from the community in general, either from the local government. This way, it was considered that the exercise of using hydrological modeling to evaluate new potential water sources for Tacloban North was of the utmost importance.
Moreover, it should be stressed that, after the water supply urgency, the improvement of water quality and sewage/sanitation aspects were the following most representative, with 40.4% and 36.5% of respondents, respectively. Electricity was only chosen by 9.9% of HH, whilst 15.6% chosen other issues that needed further development to increase their HH resilience.
Hydrological Modeling with QSWAT
As for the model calibration, the comparison between the flow series generated by QSWAT and the USAID’s Sapiniton Gauging Station measurements returned encouraging correlations: this was true for the monthly average series, in m3/s, which returned a correlation of 0.899 and for the watershed runoff, in mm, with a correlation of 0.830. The ratio between the averages of these runoff series (167.2 mm and 132.9 mm for the USAID and QSWAT series, respectively) obtained was of 0.79 – which was consistent with the ratio between the two compared subbasins’ areas, of 0.72. Intuitively, hence the subbasin delineated by QSWAT was relatively smaller, so it should be the amount of superficial runoff generated to the same extent, which was verified. Based on these satisfactory correlations, it was assumed that no further calibration measures were required and that the modeling results were valid and trustworthy.
Water resources resilience analysis
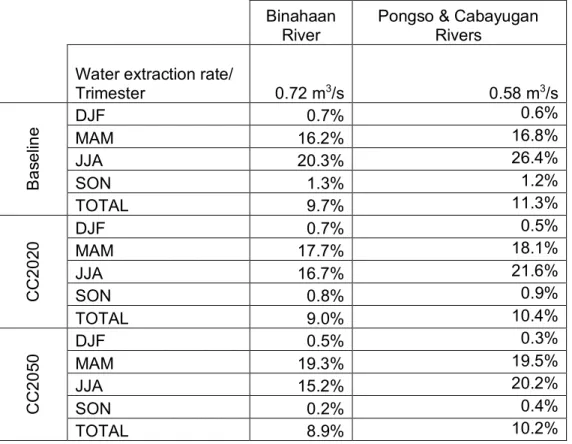
The resilience of Binahaan, Pongso and Cabayugan Rivers as water sources for Tacloban was evaluated as, for a certain time period, the percentage of days in which the river flows did not meet the water extraction rates predefined for that river catchment. Table 2 summarizes the obtained results.
Table 2 - Resilience of supply results: percentage of days below extraction rate
Binahaan River
Pongso & Cabayugan Rivers
Water extraction rate/
Trimester 0.72 m3/s 0.58 m3/s
Ba
s
e
lin
e DJF 0.7%
0.6%
MAM 16.2% 16.8%
JJA 20.3% 26.4%
SON 1.3% 1.2%
TOTAL 9.7% 11.3%
CC2
0
2
0
DJF 0.7% 0.5%
MAM 17.7% 18.1%
JJA 16.7% 21.6%
SON 0.8% 0.9%
TOTAL 9.0% 10.4%
CC2
0
5
0
DJF 0.5% 0.3%
MAM 19.3% 19.5%
JJA 15.2% 20.2%
SON 0.2% 0.4%
TOTAL 8.9% 10.2%
most favorable trimesters (only 0.7% and 1.3% of days, respectively). However, the March-April-May (MAM) and June-July-August (JJA) trimesters evidence some water shortage probability, with 16.2% and 20.3% of days, respectively, where the river flow of Binahaan is insufficient to meet the withdrawal demand. Nevertheless, concerning the future scenarios, overall (on a yearly basis) this situation tends to evolve favorably due to the general increase of precipitation for Leyte, with the yearly number of supply gaps decreasing to 9.0% for the CC2020 scenario and to 8.9% for CC2050. However, the breakdown in trimesters revealed that, for the MAM period, due to the PAGASA’s forecasted decrease in rainfall, the availability of water on this river actually worsens, with as much as 19.3% of days with insufficient flow. From these results, it becomes evident that Binahaan River, during the March to August period, cannot be considered a resilient water source.
Therefore, considering an additional water catchment from the northern rivers to supply the Tacloban resettlement areas, as proposed by the development agency USAID, may be seen as a pertinent alternative. Assuming an extraction rate of 0.58 m3/s for these northern rivers, a similar response to the one aforementioned for Binahaan River was observed that the yearly resilience of these rivers to be used as supply sources evolved from 11.3% of days not meeting the demand at baseline data to 10.4% for the CC2020 scenario and 10.2% for CC2050. However, for the JJA trimester, water withdrawal from these rivers may be insufficient in circa 20.2% of the days in CC2050.
Either for Binahaan or Pongso & Cabayugan Rivers’ solutions, the significant percentage of days pointing to water scarcity for the MAM and JJA trimesters was indicative of the necessity of a flow regulation infrastructure, such as a small dam. The pre-dimensioning of such structure as a function of the existing flow regimes is one possible future development of this work. Likewise, considering land cover changes could be also interesting, hence, as demonstrated by Tolentino and her colleagues, after Haiyan, the reduction of forests on these watersheds conducted to a decrease of a third of the groundwater infiltration – and thus increasing the potential runoff (Tolentino, et al. 2016). Additional studies could include the evolution of Tacloban’s demographics, and its consequences on the city’s water uses and demand.
Conclusions
After super typhoon Haiyan’s catastrophic destruction in late 2013, Tacloban City, Philippines, is undergoing major relocation efforts to create new residential, institutional and commercial areas further North. However, a definitive water supply solution for these new areas is still unavailable and relocated families are moving back to storm-surge prone areas in the city.
From thereon, the region’s hydrological system was modeled using QSWAT to evaluate the impacts of climate change and thus assess the existing rivers resilience as supply sources. Results show that, regardless of the chosen supply solution, for certain time periods (most severely for the trimester of March to May) the percentage of days in which the river flows were insufficient to meet the proposed water catchment rates was significant. Outputs suggest that Binahaan River, where current water catchment is located, may fail in providing sufficient water to the region for future scenarios. However, it should be enhanced that Pongso and Cabayugan Rivers on northern Leyte can represent a resilient water source to supply the new resettlement areas. Additional studies could include the evolution of Tacloban’s demographics, and its consequences on the city’s water uses and demand.
Overall, this work has reinforced the importance of the emerging role of hydrological modeling in climate change impact studies, and also contributed to the definition of a more holistic concept of resilience by crossing it with the social perception of the problem.
References