The Healthy Migrant Effect on Depression:
Variation over Time?
Zheng Wu
Christoph M. Schimmele Department of Sociology University of Victoria
Victoria, British Columbia, Canada
Abstract
Growing international evidence supports the epidemiological paradox that immigrants have better overall health than non-immigrants, including lower levels of depression. But whether length of residence in the host population modifies this effect on depression is not well understood. We examine a large, heterogeneous sample of Canadians to investigate three possible trajectories of depression within the immigrant population. We present hypotheses testing if the depression rate among immigrants improves, deteriorates, or undergoes non-linear change over time. Our results confirm the so-called “healthy migrant effect” and show that visible minority immigrants are especially healthy. However, soon after arrival in Canada, depression among immigrants increases for several decades. Policy implications of the findings are discussed.
272 Résumé
De plus en plus d'études internationales importantes supportent le paradoxe épidémiologique qui démontre que les immigrants sont en général en meilleure santé et souffrent moins de dépression que les non-immigrants. Mais nous ne comprenons pas encore bien si le nombre d’années de résidence au sein de la nouvelle population modifie cet effet. Nous avons examiné un large échantillon hétérogène de Canadiens pour étudier trois trajectoires d’évolution possibles de la dépression au sein de la population immigrante. Nous présentons différentes hypothèses pour évaluer si la dépression chez les immigrants s’améliore, se détériore ou continue de façon non-linéaire au fil des années. Nos résultats confirment ce qui est appelé « l’effet de l’immigrant en bonne santé » et démontrent que la santé des immigrants appartenant aux minorités visibles est encore meilleure que celle des autres immigrants. Cependant, peu après leur arrivée au Canada, le taux des dépressions chez les immigrants augmente pendant plusieurs décennies. Les implications des ses résultats au niveau des polices sont discutées.
Mots-clés: Dépression, immigrants, l’effet de l’immigrant en bonne santé
Introduction
The healthy migrant effect is an important finding considering that many opponents of liberal immigration policies argue that large in-flows threaten to over-burden the health care system. The available literature offers crucial policy implications, to be sure, but our knowledge of the processes surrounding the healthy migrant effect remains incomplete in several key respects. One major dimension of the healthy migrant effect that requires further specification is whether duration in the host country (length of residence) modifies this health advantage. This gap in the literature represents a serious conceptual limitation because the current information suggests that this health advantage is concentrated among recent arrivals from “non-traditional” source countries (Pérez 2002). These observations force us to contemplate whether the healthy migrant effect is indeed a reliable general concept, for the effect may be a temporary phenomenon, attenuating or disappearing over time, and is perhaps peculiar to specific ethnic sub-groups of immigrant population.
Using National Population Health Survey Data, the present study investigates a nationally representative sample of Canadians, which includes 10,972 foreign-born and 59,566 domestic-foreign-born individuals, to answer the following question: is the healthy migrant effect on depression a general or temporary phenomenon? Reliance on a single conceptual approach for examining depression and other mental health disorders among immigrants is inappropriate considering the heterogeneous profile of the immigrant population (Acharya 1998). Being a novel concept, the healthy migrant effect needs to be dissected in order to establish the extent to which a reliable theoretical framework can be extrapolated from empirical findings on this phenomenon. This study questions whether the terminological phrase “healthy migrant effect” is justifiable in that it represents a general trend? or is this phrase confounding because it represents a health advantage restricted to specific immigrants? Focusing on depressive disorders, this study contributes to the literature on immigration and health by unpacking the healthy migrant effect across various length of residence categories.
The Healthy Migrant Effect
274
than non-immigrants because of these health advantages. The average life expectancy at birth for the Canadian-born is roughly 74 years for men and 80 years for women. By comparison, the life expectancy for European immigrants is about 76 years for men and 82 years for women. Non-European immigrants have the longest life expectancies, with the men expected to live 80 years and the women 86 years (Chen, Wilkins, and Ng 1996).
Though far more limited, the literature also implies that the healthy migrant effect applies to mental health. In an examination of Asian migration to the U.S., Kou and Tsai (1986) argue that psychological “hardiness” (defined by a willingness to take chances and the ability to negotiate difficult circumstances) is an important selection factor in the migration process. The authors observe that having a robust personality suppresses depression among immigrants because it endows these individuals with the capacity to effectively cope with various kinds of social stress, including adaptation problems, and also provides them with a sense of personal security that minimizes the harmful effects of stressful events and situations. A recent review article by Escobar, Hoyos-Nervi, and Gara (2000) provides support for this thesis. Examining immigration research between 1980 and 1999, Escobar, Hoyos-Nervi, and Gara conclude that, despite having socioeconomic disadvantages, Mexican-born immigrants have better mental health profiles than non-immigrants with Mexican ethnic origins. According to Ali (2002), a similar pattern exists in Canada, with immigrants, especially recent arrivals and those from Asian countries, having a lower depression rate than non-immigrants.
Most research speculates that a “selection” effect in the migration process appears to explain this epidemiological phenomenon. As classical migration theory observes, a considerable proportion of immigrants are selected into the migration process because they possess personal characteristics (e.g., good physical health, youth, above average educations) that foster their ability to respond to the push-pull factors that motivate voluntary cross-border movements (Lee 1966). As the literature confirms, these selection factors also happen to be well-established depression variables (Mirowsky and Ross 1992; Rodin and Voshart 1986; Turner and Lloyd 1999), and thus human capital and socio-demographic differences may account for the variance in depression between immigrants and non-immigrants. There is compelling evidence for the selection effect hypothesis for aspects of physical health because the health advantage immigrants have over host populations is also superior to the average health ratings among individuals in their native populations (Sharma, Michalowski, and Verma 1990).
underdeveloped. But this health advantage does indeed appear to gradually deteriorate over time for crucial aspects of physical health. In 2000-01, the prevalence of all chronic conditions was 37 percent for immigrants with 0-4 years of residence in Canada, 43 percent for those with 5-9 years, 51 percent for those with 10-14 years, 55 percent for those with 15-19 years, 65 percent for those with 20-29 years, and 78 percent for those with 30 years and more (Peréz 2002). Even though immigrants, except those with 20+ years of residence, retain their physical health advantage over time, this advantage does attenuate with length of residence. The long-term trajectory of physical health within the Canadian immigrant population suggests that the healthy migrant effect is a temporary phenomenon. Even though depressive disorders are triggered by different pathogens than chronic conditions, the acute deterioration of physical health among immigrants is enough to warrant concern about their long-term mental health.
Hypotheses
A recent Canadian health report observes that immigrants have lower rates of depression than non-immigrants, even after adjusting for differences in age, gender, marital status, income, and education (Ali 2002). This pattern is also independent of language barriers and community integration. Studies on the healthy migrant effect report that this epidemiological phenomenon (for physical health) is strongest among immigrants residing in Canada fewer than 10 years (Pérez 2002). For example, after adjusting for age, household income, and health risk behaviors, the number of chronic conditions among immigrants increases over time, although the risk of having a chronic condition remains lower among immigrants than non-immigrants until 20 years of residence in Canada. The effect also appears to be concentrated among immigrants from non-European countries (Chen, Ng, and Wilkins 1996). We control for ethnic status because length of residence may represent birthplace, meaning that the healthy migrant effect could be a spurious effect of an ethno-cultural health advantage.
276
H2. We presume that most of the stressful situations encountered in the migration process present short-term challenges. We believe that it reasonable to expect that most immigrants will successfully integrate into Canadian society, particularly since the national cultural emphasizes ethnic pluralism, and will establish themselves in the labor market and reconstruct their social networks. We therefore hypothesize that any increase in depression will be concentrated early in the migration experience.
H3. On the other hand, there is sufficient evidence to hypothesize that acculturative stress presents a long-term source of social stress. Previous research indicates that cultural alienation from the host population is a source of stress, and increases in the level of acculturation sometimes elevate emotional stress (Kaplan and Marks 1990). Length of residence can also damage mental health because acculturation is associated with intergenerational conflicts and other family problems (Acharya 1998).
H4. There is other evidence that compels us to hypothesize that the healthy migrant effect may improve over time (e.g., Pernice and Brook 1996). For example, the good mental health among immigrants may be bolstered by new opportunities and a higher standard of living. Moreover, as psychological “hardiness” is a migration selection factor, voluntary migration implies the willingness to confront major life changes, and this attitude dampens social stress encountered in the migration process (Kou and Tsai 1986).
In summary, our analysis considers hypotheses that investigate several potential trajectories the healthy migrant effect on depression may travel over time, with the main problem being whether this effect increases, decreases, or remains stable over length of residence.
Data and Methods
Data
request. The two official languages, English and French, and nine other languages were used in the interviews. The respondents were asked detailed questions on their health status, socioeconomic status, social resources, demographic profile, and family characteristics. See Statistics Canada (2002) for further information on NPHS survey design and data collection methods. Our study excludes children under 12 years of age (mental health information was not collected on them) and cases where any dependent mental health measure was missing. Our study sample consists of 10,972 women and 59,566 men with these restrictions.
Measurement
We measure depression as the number of depressive symptoms and experience of major depressive episode (MDE). Candidates for depression and MDE were identified with two screening questions. The respondents were asked if they “felt sad, blue, or depressed” or had “lost interest in most things” most of the time for two continuous weeks in the previous 12 months. A positive response to either question triggered a series of questions on depressed mood (see Diverty and Beaudet 1997). The NPHS depression scale is based on a nine-item subset (Cronbach’s alpha = .92) of questions on depressive symptoms listed in the
Diagnostic Statistical Manuel of Mental Disorders (DSM-III-R). We measure depressive symptoms on a numerical scale based on the number of symptoms derived from answers to these questions. We measure MDE with a dummy variable. Following Statistics Canada guidelines, we establish a minimum threshold for the likelihood of a positive diagnosis of MDE using scoring from the depressive symptom scale. We created a dichotomous variable to identify respondents with a .9 or higher probability of caseness, or those having at a 90 percent or greater probability for a positive diagnosis of MDE. In the NPHS, a probability of .9 was assigned to respondents who answered positively to a screening question and reported five or more depressive symptoms.
Place of Birth <1961 1961-1970 1971-1980 1981-1990 1991-2001*
United States 3.9 6.3 6.7 4.0 2.8
Central and South America 0.7 2.3 6.7 9.9 6.3
Caribbean and Bermuda 0.8 5.7 9.8 6.6 4.6
United Kingdom 24.3 21.5 13.5 5.8 2.3
Other Northern and Western Europe 27.8 11.6 6.0 4.4 3.1
Eastern Europe 15.1 4.9 3.2 10.1 9.0
Southern Europe 23.2 31.2 13.5 5.3 5.1
Africa 0.5 3.2 5.8 5.7 7.6
West-central Asia and Middle East 0.5 1.8 3.2 7.3 8.9
Eastern Asia 2.0 4.9 10.4 14.9 23.1
Sotheast Asia 0.3 1.9 11.5 15.3 10.1
Southern Asia 0.4 3.6 8.2 9.7 16.1
Oceania and other 0.4 1.2 1.5 1.0 0.8
Total 100.0 100.0 100.0 100.0 100.0
*Includes data up to May 15, 2001.
Source: Statistics Canada (2005). Online: http:/www.statcan.ca/english/Pgdb/demo24a.htm.
Period of Immigration Table 1
Percentage Distribution of Immigrant Population by Place of Birth and Period of Immigration for Canada: 2001
From 1971-80, Europe and the U.S. contributed 43 percent of new arrivals, meaning that most immigrants now came from non-traditional source countries. This trend would intensify in the following decades. From 1981-90, about 70 percent of new immigrants came from Eastern Asia, South East Asia, South Asia, and other non-traditional sources. Once restricted entry, Asian peoples formed 58 percent of the immigrant population arriving in Canada from 1991 to 2001. By contrast, only 5 percent came from the U.K. and Northern Europe.
Our primary independent variable is length of residence in Canada. We measure this variable in two respects. We use nine dummy indicators to measure varying categories of duration with the reference group being non-immigrants. Table 2 illustrates the percentage distribution of years lived in Canada by each block. We also measure years in Canada as a numerical variable (in years), which we use in our separate analysis of the immigrant population. We include a quadratic term because the effects of length of residence on mental health may be non-linear, as indicated in our third hypothesis. The average length of residence in Canada for immigrants in the target population is 24 years.
Table 2
Percentage Distribution of Residence Duration in Canada: 1996-97
Years in Canada Percent Number
Less than 5 years 1.70 756
5-9 2.96 1,358
10-14 1.77 795
15-19 1.76 865
20-24 2.00 1,051
25-29 1.80 1,160
30-34 1.42 916
35-39 1.15 771
40 years or more 3.52 3,300
Native-born 81.91 59,566
Total 100.0 70,538
280
Our analysis also considers if any changes in the healthy migrant effect over time represent factors related to the acculturation process. We define and measure acculturation using two proxy indicators, age at immigration and speaking ability of English or French. We measure age at immigration in years. Table 3 shows that the mean age at immigration is 22 years. We include a dummy variable indicating whether the respondent can speak English or French. Our data show that over 97 percent of Canadian immigrants can speak English or French.
We measure ethnicity in five groupings: Chinese, Other Asians, South/East Europeans, North/West Europeans, and Others. These categories obviously conflate peoples with diverse cultural and national backgrounds. We purposely use the term “grouping” (not group) to indicate that our ethnic selections are “taxonomic categories” and not necessarily communities with “substantial relations of connection” (see Sayer 1992 for definition of these concepts). In general, our selected ethnic categories represent the pattern of ethnic organization in Canada, and are essentially accurate groupings in context of differential exposure to social structural health risks. We control the effects of ethnicity in our final models because this variable influences depression (Wu et al. 2003). See Table 3 for the definitions and distributions for these and all other variables.
We use a dichotomous variable to measure and control the effects of gender on depression. We introduce this control variable because of the strong relationship between gender and the exposure to mental health risk factors and depression (Mirowsky and Ross 1995).
Our measurement and definition of socioeconomic status includes family income, education, and a dummy variable identifying low-income households. Family income is measured with an 11-level ordinal variable, ranging from no reported income to $80,000 or more. Education is measured on an ordinal scale ranging from no formal schooling to graduate schooling. To measure low income, we use the NPHS income adequacy scale, which is based on income relative to household size (Statistics Canada 1998). Finally, we include a dichotomy indicating if the respondent lost employment in the past 12 months. We control for socioeconomic status as this variable has well-established effects on depression (McLeod and Kessler 1990; Turner and Lloyd 1999).
Variable Variable Definition & Code Immigrants Mean or %
Non-Immigrants Mean or %
Female Dummy indicator (1 = yes, 0 = no) 50.7% 51.3%
Race/Ethnicity
Chinese Dummy indicator (1 = yes, 0 = no) 11.2% 0.7%
Other Asian Dummy indicator (1 = yes, 0 = no) 8.3% 0.5%
South/East European Dummy indicator (1 = yes, 0 = no) 13.6% 4.0%
Other Dummy indicator (1 = yes, 0 = no) 38.0% 29.9%
North/West European Reference group 28.9% 65.00%
Family Income Family income in 11 levels (1 = none, …
11 = 80,000 or more) 7.40 7.59
Education Educational attainment in 12 levels
(1=no schooling, … 12 = Masters or above) 6.63 6.16
Low Income Income was inadequate (1 = yes, 0 = no) 15.6% 12.60%
Loss of Employment Dummy indicator (1 = yes, 0 = no) 5.8% 5.0%
Social Support Perceived social support (high = greater perceived social support, Cronbach's á = 0.95)a
3.68 3.80
Social Contact Average frequency of social contact
(high = more contact)a 3.93 4.14
Health Self-reported health status in five levels
(1 = poor, 5 = excellent) 3.71 3.80
Chronic Condition Dummy indicator (1 = having any chronic
conditions, 0 = otherwise) 54.5% 58.0%
Age Age in years 45.54 40.32
Age square (**100) Quadratic term of age 2379.7 1956.4
Marital Status
Separated/Divorced Dummy indicator (1 = yes, 0 = no) 7.0% 6.9%
Widowed Dummy indicator (1 = yes, 0 = no) 5.7% 5.0%
Never Married Dummy indicator (1 = yes, 0 = no) 21.6% 32.6%
Married/Cohabiting Reference category 65.7% 55.5%
Children under 6 Dummy indicator (1 = yes, 0 = no) 17.8% 15.3%
Rural Residence Dummy indicator (1 = yes, 0 = no) 7.8% 19.7%
Age at Immigration Age at immigration in years 22.27
--Speak English/French Dummy indicator (1 = yes, 0 = no) 97.20%
--N 10,972 59,566
Note: Weighted means or percentages, unweighted N.
a See text for detailed description.
Table 3
282
neighbors over 12 months. We control for social resources because these have a well-known “buffering” effect on stress outcomes (Ross and Mirowsky 1989).
We use two indicators to measure physical health. Self-reported health status is measured on an ordinal scale having five possible responses: “poor,” “fair,” “good,” “very good,” and “excellent.” We use a dummy variable to indicate if the respondent experienced any chronic health problem, such as asthma, arthritis or rheumatism, diabetes, heart disease, high blood pressure, migraine headaches, and Alzheimer’s disease or other dementia. We introduce controls for self-reported health status and chronic conditions because poor physical health is inextricably linked to poor mental health (Rodin and Voshart 1986).
We include several demographic variables. We add a quadratic term of age because the relationship between age and depression may be non-linear. We add controls for age because there are age patterns in the social distribution of poor mental health (Mirowsky and Ross 1992). Marital status is measured using a four-level categorical variable: never married, widowed, separated or divorced, and married or cohabiting. We control for marital status because the married and cohabiting have better overall health than the single, separated and divorced, and widowed (Wu and Hart 2002). We use dummy variables to indicate the presence of children under six and if the respondent lives in a rural area. We control for the presence of young children and rural residence because these variables confound mental health outcomes (Ross, Mirowsky, and Huber 1983; Wasylenki 2001).
We use generalized linear model (GLM) techniques in the data analysis (McCullagh and Nelder 1989) because we have one continuous and one binary dependent variable in our analytical model. For the continuous variable, we assume that the distribution function be normal with an identity link function (an OLS model). We estimated the models with alternative distribution assumptions and link functions (e.g., a Poisson distribution with a log link function) because the distribution of the response variable is skewed with a significant number of respondents having no depressive symptoms. The results are consistent with those reported in this study. We use linear regressions because the results are simple for non-statisticians to understand. For the binary variable, we assume the distribution function to be binomial with the logit link function (a logistic model).
Results
confirming if the healthy migrant effect applies to depression and MDE. Model 1 in Table 4 shows that immigrants generally have fewer depressive symptoms than non-immigrants. Model 1 in Table 5 shows that immigrants have lower risks of experiencing a MDE than non-immigrants. The MDE rate is about 25 percent ([e-.294-1] 100) lower for immigrants. Our initial results thus confirm that the healthy migrant effect applies to depression. To examine if the healthy migrant effect is variable over time (duration), we disaggregated the immigrant population by length of residence in Canada in our subsequent models in Tables 4 and 5. The final models include these duration variables and all control variables.
Model 2 in Table 4 indicates that immigrants residing in Canada less than 5 years, 5-9 years, 30-34 years, and 40 years or more have fewer depressive symptoms than non-immigrants. All other immigrants have similar levels of depression as non-immigrants. Model 3 repeats the analysis in model 2 with controls for ethnic status, socioeconomic status, social resources, physical health, and demographic characteristics. Model 3 shows that immigrants who have resided in Canada less than 5 years, 5-9 years, 10-14 years, 15-19 years, and 30-34 years have fewer depressive symptoms than non-immigrants. Those immigrants residing in Canada 20-29 years and over 34 years are similar to non-immigrants.
As model 2 in Table 5 shows, the results for MDE are virtually identical to those for depressive symptoms, with recent (under 10 years of residence) and some long term (30-34 years and 40+ years of residence) immigrants being healthier than immigrants and all other immigrants having MDE rates similar to non-immigrants. In model 3, which includes all other variables, recent immigrants and those residing in Canada for 15-19 and 30-34 years have lower MDE than immigrants. Otherwise, immigrants do not have lower MDE rates than non-immigrants.
In Tables 4 and 5, model 3 shows how our control variables influence mental health, with the findings being consistent with prior expectations, with one exception. Both measures of depression appear to be elevated among individuals with higher education. Although education is thought to lower depression, this relationship is not straightforward, and may be confounded by unmeasured heterogeneity of our study sample. Other Canadian studies (e.g., Wu et al., 2003) report a similar finding.
Independent Variable Model 1 Model 2 Model 3
Immigrant (1=yes) -0.076*** --
--Years in Canada
Less than 5 years -- -0.112* -0.196***
5-9 years -- -0.104** -0.193***
10-14 years -- -0.034 -0.094#
15-19 years -- -0.073 -0.118*
20-24 years -- 0.038 0.007
25-29 years -- -0.004 -0.024
30-34 years -- -0.102* -0.086#
35-39 years -- -0.065 -0.045
40 years or more -- -0.126 0.019
Native Born (1=yes)a -- --
--Female (1=yes) -- -- 0.198***
Race/Ethnicity
Chinese -- -- -0.177**
Other Asian -- -- -0.099*
South/East European -- -- -0.004
Other -- -- -0.027*
North/West Europeana -- --
--Family Income -- -- -0.021***
Education -- -- 0.010***
Low Income (1=yes) -- -- 0.079***
Loss of Employment (1=yes) -- -- -0.004
Social Support -- -- -0.150***
Social Contact -- -- -0.083***
Health -- -- -0.189***
Chronic Condition -- -- 0.116***
Age -- -- 0.008***
Age square (x100) -- -- -0.020***
Marital Status
Separated/Divorced -- -- 0.251***
Widowed -- -- 0.082***
Never Married -- -- 0.054***
Married/Cohabitinga -- --
--Children under 6 (1=yes) -- -- -0.033*
Rural Residence (1=yes) -- -- -0.031*
Intercept 0.338*** 0.338*** 1.927***
Log Likelihood -121708 -121700 -119626
a
Reference group #p=.05 (one-tailed test)
*p < .05; **p < .01; ***p < .001 (two-tailed test)
Generalized Linear Models of Depression on Years in Canada and Selected Independent Variables: Canada, 1996-1997
Independent Variable Model 1 Model 2 Model 3
Immigrant (1=yes) -0.294*** --
--Years in Canada
Less than 5 years -- -0.434* -0.618**
5-9 years -- -0.442** -0.705***
10-14 years -- -0.021 -0.239
15-19 years -- -0.232 -0.382*
20-24 years -- 0.092 0.006
25-29 years -- -0.115 -0.193
30-34 years -- -0.429* -0.400*
35-39 years -- -0.214 -0.053
40 years or more -- -0.524*** 0.157
Native Born (1=yes)a -- --
--Female (1=yes) -- -- 0.746***
Race/Ethnicity
Chinese -- -- -0.793**
Other Asian -- -- -0.316*
South/East European -- -- -0.001
Other -- -- -0.091*
North/West Europeana
Family Income -- -- -0.055***
Education -- -- 0.022***
Low Income (1=yes) -- -- 0.076
Loss of Employment (1=yes) -- -- -0.028
Social Support -- -- -0.338***
Social Contact -- -- -0.231***
Health -- -- -0.582***
Chronic Condition -- -- 0.459***
Age -- -- 0.057***
Age square (x100) -- -- -0.110***
Marital Status
Separated/Divorced -- -- 0.594***
Widowed -- -- 0.576***
Never Married -- -- 0.054***
Married/Cohabitinga -- --
--Children under 6 (1=yes) -- -- -0.144*
Rural Residence (1=yes) -- -- -0.088
Intercept -3.028*** -3.028*** 0.328
Log Likelihood -121804 -12795 -11101
aReference group
#p=.05 (one-tailed test)
Table 5
Generalized Linear Models of MDE Years in Canada and Selected Independent Variables: Canada, 1996-1997
286
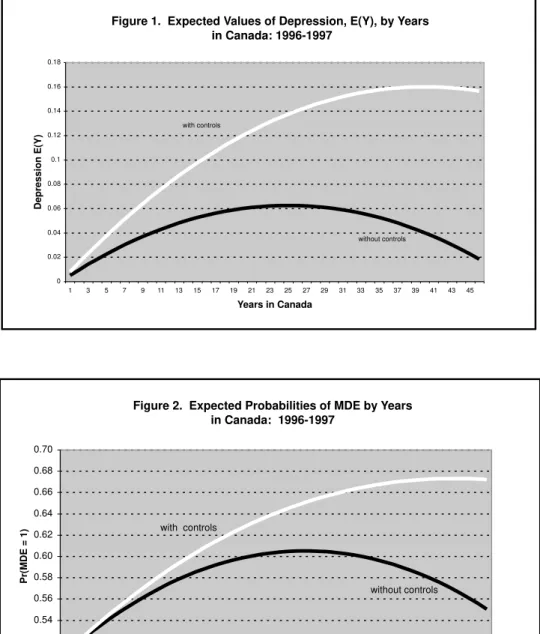
In Table 6, we restrict our analysis to the immigrant population in an additional examination of how length of residence modifies depression. Panel A (without controls) indicates that length of residence has a non-linear, inverted U-shaped effect. In other words, recent and very long-term immigrants tend to have better mental health profiles than others. In Panel B, which includes controls, this non-linear effect remains significant.
Table 6
Generalized Linear Models of Depression (MDE) on Years in Canada For Canadian Immigrants: 1996 - 1997
Controls
Dependent Variable
Depression MDE
A. Without Controls
Years in Canada 0.005** 0.032**
Years in Canada square
(x 100) -0.010*** -0.060***
Intercept 0.227*** -3.534***
Log Likelihood -17605 -1646
B. With Controlsa
Years in Canada 0.008*** 0.034**
Years in Canada square
(x 100) -0.010** -0.040#
Intercept 1.572*** 0.621
Log Likelihood -17364 -1449
a
Models control for the explanatory variables shown in Table 3.
Both curves (with controls) indicate that depression and MDE increase sharply after arrival in Canada and peak at around 35-40 years of residence, after which they gradually decline.
Finally, in Table 7, we examine if changes in the healthy migrant effect over time are related to the acculturation process. Except for the main effects of length of residence, which become non-significant (see panel B), the new estimates are similar to those reported in Table 6. In general, these results indicate that changes to the healthy migrant effect over time are not a function of the acculturation process. However, age at immigration does appear to affect the mental health of younger immigrants. Panel B shows that individuals who immigrated at age 17 and under have more depressive symptoms and a greater risk of having a MDE compared with immigrants who arrived in Canada at older ages. These findings suggest that the acculturation process is dependent on age at migration, with younger individuals more likely to assimilate than integrate into the host society.
Discussion and Conclusion
For Canada, immigration is an important source of population growth, promotes economic expansion, and decreases the dependency ratio (Klymchuk 2003). Although immigrants are good for Canada, coming to Canada may not be good for immigrants. The present study considered the relationship between length of residence and depression among the immigrant population. Most research on the healthy migrant effect focuses on physical health outcomes and does not examine this phenomenon by length of residence in the host country. The present study contributes to the literature by illustrating trajectories of mental health (total depressive symptoms and major depressive episode rates) within the immigrant population over different lengths of residence in Canada. Our initial analysis confirms that immigrants are less depressed than non-immigrants, a finding consistent with the literature (Pérez 2002). But our study also presents findings that question whether this health advantage is uniform across different immigrant groups. We conclude that length of residence is an important factor in the healthy migrant effect, which appears to be disproportionately concentrated among recent immigrants.
Controls Model 1 Model 2 Model 3 Model 4
A. Without Controls
Years in Canada 0.005* 0.005** 0.025* 0.031**
Years in Canada square (x100) -0.010*** -0.010*** -0.060*** -0.060***
Age at Immigration
Under 6 years 0.066 -- 0.165
6 - 17 years 0.030 -- 0.062
18-24 years -0.075 -- -0.309
25-34 years -0.135 -- -0.684
35-44 years -0.128 -- -0.691
45-54 years -0.148 -- -0.471
55-64 years -0.253 -- -1.264
65 years and overa
Speak English/French (yes = 1) -- 0.044 -- 0.271
Intercept 0.314* 0.185* -3.130*** -3.795***
Log Likelihood -17582 -17805 -1625 -1646
B. With Controls
Years in Canada (x100) 0.020 0.008*** 0.020 0.034**
Years in Canada square (x100) -0.010*** -0.010** -0.060*** -0.040#
Age at Immigration
Under 6 years 0.386* -- 1.709*
6 - 17 years 0.314* -- 1.412*
18-24 years 0.143 -- 0.737
25-34 years 0.048 -- 0.213
35-44 years 0.012 -- -0.047
45-54 years -0.066 -- -0.046
55-64 years -0.172 -- 1.099
65 years and overa
Speak English/French (yes = 1) -- -0.014 -- 0.039
Intercept 1.390*** 1.586*** -0.019 0.584
Log Likelihood -17360 -17364 -1448 -1449
aReference group b
Models control for the explanatory variables shown in Table 3; Models 1 and 3 exclude age and age square. #p=.05 (one-tailed test), *p < .05; **p < .01; ***p < .001 (two-tailed test).
Dependent Variable
Depression MDE
Table 7
Generalized Linear Models of Depression (MDE) on Years in Canada Age at Immigration and English/French Language for Canadian Immigrants: 1996-1997
Figure 1. Expected Values of Depression, E(Y), by Years in Canada: 1996-1997
0 0.02 0.04 0.06 0.08 0.1 0.12 0.14 0.16 0.18
1 3 5 7 9 11 13 15 17 19 21 23 25 27 29 31 33 35 37 39 41 43 45
Years in Canada
Depression E(Y)
with controls
without controls
Figure 2. Expected Probabilities of MDE by Years in Canada: 1996-1997
0.50 0.52 0.54 0.56 0.58 0.60 0.62 0.64 0.66 0.68 0.70
1 3 5 7 9 11 13 15 17 19 21 23 25 27 29 31 33 35 37 39 41 43 45
Years in Canada
Pr(MDE = 1)
with controls
290
34 years have fewer depressive symptoms than the native-born. Further, immigrants having lived in Canada for 0-9 (this represents two separate groups), 15-19, and 30-34 years have a lower risk of experiencing a MDE than non-immigrants. These results appear to indicate that the healthy migrant effect is primarily associated with immigrants who landed in Canada in the mid-1970s and thereafter. This finding parallels previous research that shows the healthy migrant effect on physical health is the most pronounced among recent immigrants (Ali 2002; Chen, Ng, and Wilkins 1996).
Our main objective was plotting the course the health migrant effect on depression travels over an extended time period. To fulfill this objective, we conducted separate analysis examining the immigration population apart from the non-immigrant population. The results illustrate that the effect travels along a non-linear trajectory over time. For both dimensions of depression, the effect deteriorates for several decades upon arrival in Canada, stabilizes for several years, and then begins to improve. These results provide some support for first hypothesis, which suggested that the effect would diminish over time, and our third hypothesis, which suggested that the pattern of decline would be long-term. The depression rate within the immigrant population sharply increases for the first 30-35 years of residence in Canada (see Figure 1 and 2). Moreover, even though recent immigrants (0-9 years of residence) are the healthiest group, the depression rate among these individuals appears to increase immediately upon arrival. Our results therefore disconfirm the second hypothesis, which suggested that any increase in depression would be short-term, and also the final hypothesis, which proposed that the effect would improve over time. The effect does begin to increase after about 40 years in Canada, but the rate of improvement is not nearly big enough to compensate for the long period of deterioration.
other immigrants. Unfortunately, data limitations prevented a more comprehensive examination of the acculturation hypothesis.
This study addressed an unanswered question on the healthy migrant effect, but there are some limitations to our findings. There are problems with measuring depression across different ethno-cultures. Some ethno-cultures tend to express depressive symptoms as physical health problems (somatization), which means that our findings may not fully capture the extent of depression among immigrants, particularly those from non-European countries. Moreover, our findings cannot definitively show how the healthy migrant effect changes over time as they are based on cross-sectional data. The actual trajectory of the effect may be somewhat different from that predicted here because of return or repeat migration. For example, repeat migration by the healthiest segments of the foreign-born population could be responsible for a portion of the deterioration in the size of the effect. The appropriate data (longitudinal) to test this assumption is unavailable. Finally, our results should be interpreted with caution because period effects in the ethnic composition of our length of residence categories may confound the conclusions presented here. But we doubt if panel data would significantly change our conclusions because the healthy migrant effect appears decrease in each year of residence over a period lasting 35 years.
292 Acknowledgements:
The authors gratefully acknowledge financial support from a Canadian Institute for Health Information (CIHI) grant. Additional research support was provided by the Department of Sociology, the University of Victoria. Direct all correspondence to Zheng Wu, Department of Sociology, the University of Victoria, P. O. Box 3050, Victoria, British Columbia, V8W 3P5 Canada. E-mail:
References:
Acharya, M. P. (1998) Chronic social stress and emotional well-being: An analysis of mental health of immigrants in Alberta. Canadian Studies in Population, 25, 1-27.
Ali, J. (2002) Mental health of Canada’s immigrants. Health Reports, 13 (Supplement), 101-113.
Berry, J. W., Kim, U., Minde, T., and Mok, D. (1987) Comparative studies of acculturative stress. International Migration Review, 21, 491-511.
Burnam, M. A., Hough, R. L., Karno, M., Escobar, J. I., and Telles, C. A. (1987) Acculturation and lifetime prevalence of psychiatric disorders among Mexican Americans in Los Angeles. Journal of Health and Social Behavior, 28, 89-102.
Chen, J., Ng, E., and Wilkins, R. (1996) The health of Canada’s immigrants in 1994-95. Health Reports, 7, 33-45.
Chen, J., Wilkins, R., and Ng, E. (1996) Health expectancy by immigrant status, 1986 and 1991. Health Reports, 8, 29-37.
Diverty, B. and Beaudet, M. P. (1997) Depression: An undertreated disorder?
Health Reports, 8, 9-18.
Dunn, J. R. and Dyck, I. (2000) Social determinants of health in Canada’s immigrant population: Results from the National Population Health Survey. Social Science and Medicine, 51, 1573-1593.
Finch, B. K., Kolody, B., and Vega, W. A. (2000) Perceived discrimination and depression among Mexican-origin adults in California. Journal of Health and Social Behavior 52: 571-583.
Harker, K. (2001) Immigrant generation, assimilation, and adolescent psychological well-being. Social Forces, 79, 969-1004.
Hyman, I. (2001) Immigration and Health. Ottawa, Canada: Health Canada.
Kaplan, M. S. and Marks, G. (1990) Adverse effects of acculturation:
Psychological distress among Mexican American young adults.” Social Science and Medicine, 31, 1313-1319.
Kelly, N. and Michael Trebilcock, M. (1998) The Making of the Mosaic: A History of Canadian Immigration Policy. Toronto, Canada: University of Toronto Press.
Klymchuk, D. (2003) Should we close our borders? Canada’s immigration policy. Frontier Centre Policy Series, 17, 1-12
Kou, W. H. and Tsai, Y. (1986) Social networking, hardiness, and immigrants’ mental health. Journal of Health and Social Behavior, 27, 133-149.
Lay, C. and Verkuyten, M. (1999) Ethnic identity and its relation to personal self-esteem: A comparison of Canadian-born and foreign-born Chinese Adolescents. Journal of Social Psychology, 139, 288-299.
Lee, E. S. (1966) A Theory of Migration. Demography, 3, 47-57.
Lin, N. 1989. Measuring depressive symptomatology in China. Journal of Nervous and Mental Disease, 177, 121-31.
McCullagh, P. and Nelder, J. A. (1989) Generalized Linear Models. Second Edition. London, England: Chapman and Hall.
McKay, L., Macintyre, S., and Ellaway, A. (2003) Migration and Health: A Review of the International Literature. Glasgow: Medical Research Council Social and Public Health Sciences Unit.
294
McLeod, J. D. and Kessler, R.C. (1990) Socioeconomic differences in vulnerability to undesirable life events. Journal of Health and Social Behavior, 31, 162-172.
Mirowsky, J. and Ross, C. E. (1992) Age and depression. Journal of Health and Social Behavior, 33, 187-205.
---. (1995) Sex Differences in Distress: Real or Artifact? American Sociological Review, 60, 449-68.
Noh, S. and Avison, W. R. (1996) Asian immigrants and the stress process: A study of Koreans in Canada. Journal of Health and Social Behavior, 37, 192-206.
Noh, S., Kaspar, V., and Chen, X. (1998) Measuring depression in Korean immigrants: Assessing validity of the Translated Korean Version of CES-D Scale. Cross-Cultural Research, 32, 358-77.
Pérez, C. E. (2002) Health status and health behaviour among immigrants.
Health Reports, (Supplement) 13, 98-109.
Pernice, R. and Brook, J. (1996) The mental health pattern of migrants: Is there a euphoric period followed by a mental health crisis? International Journal of Social Psychiatry, 42, 18-27.
Porter, J. (1965) The Vertical Mosaic: An Analysis of Social Class and Power in Canada Toronto, Canada: University of Toronto Press.
Razum, O., Zeeb, H., and Gerhardus, A. (1998) Cardiovascular mortality of Turkish Nationals residing in West Germany. Annals of Epidemiology, 8, 334-41.
Rodin, G. and Voshart, K. (1986) Depression in the Medically Ill: An Overview.
American Journal of Psychiatry, 143, 696-705.
Rogler, L. H., Cortes, D. E., and Malgady, R. G. (1991) Acculturation and mental health status among Hispanics. American Psychologist, 46, 585-597.
Ross, Catherine E. and John Mirowsky. (1989) “Explaining the social patterns of depression: Control and problem-solving or support and talking?”
Ross, C. E. and Mirowsky, J. (1999) Refining the association between education and health: The effects of quantity, credential, and selectivity.
Demography, 36, 445-460
Ross, C. E., Mirowsky, J., and Huber, J. (1983) Dividing work, sharing work, and in-between: Marriage patterns and divorce. American Sociological Review, 48, 809-823.
Sayer, A. (1992) Method in Social Science: A Realist Approach. New York, NY: Routledge.
Sharma, R. D., Michalowski, M., and Verma, R B. P. (1990) Mortality differentials among immigrant populations in Canada. International Migration, 28, 443-450.
Statistics Canada. (1998) National Population Health Survey Overview 1996/97. Ottawa: Statistics Canada.
---. (2002) National Population Health Survey. Ottawa: Statistics Canada.
---. (2003) Immigrant population by place of birth and period of immigration.
Canadian Statistics: The People. Online: http://www.statcan.ca.
Stephens, T. and Joubert, N. (2001) The economic burden of mental health problems in Canada. Chronic Diseases in Canada, 22, 18-23.
Thoits, P. (1995) Stress, coping, and social support processes: Where are we? what next? Journal of Health and Social Behavior, 35, 53-79.
Turner, R. J. and Lloyd, D. A. (1999) The stress process and the social distribution of depression. Journal of Health and Social Behavior, 40, 374-404.
Wasylenki, D. A. (2001) Inner-city health. Canadian Medical Association Journal, 164, 214-215.
Wu, Z. and Hart, R. (2002) The effects of marital status and nonmarital union transition on health. Journal of Marriage and the Family, 64, 420-432.