TEMAS LIVRES FREE THEMES
1 Escola Nacional de Saúde Pública Sergio Arouca, Fiocruz. R. Leopoldo Bulhões 1480, Manguinhos. 21041-210 Rio de Janeiro RJ Brasil.
[email protected] 2 Sociology and
Anthropology Faculty, Georgia Southern University. Georgia GA EUA.
3 Programa de Computação Científica, Fiocruz. Rio de Janeiro RJ Brasil.
Distribution of pulmonary tuberculosis in Rio de Janeiro
(Brazil): a spatial analysis
Distribuição da tuberculose pulmonar no Rio de Janeiro (Brasil):
uma análise espacial
Resumo O objetivo deste estudo foi analisar a
dis-tribuição espacial da tuberculose (TB) endêmica no Rio de Janeiro 2002-2011. Estudo retrospectivo realizado no Estado do Rio de Janeiro, 2002-2011. Técnicas de análise espacial foram utilizadas para descrever a distribuição de incidência de tuber-culose no estado. Modelo de regressão multinível de Poisson foi utilizado para acessar a relação de tuberculose e os fatores: “sexo”, “faixa etária” e “ano de diagnóstico” (fatores de nível individu-al). A “Densidade demográfica” e o “município de residência” também foram incluídos no modelo como fatores de nível contextual. Houve redução da tuberculose endêmica ao longo dos anos. As maiores taxas de incidência se concentraram no litoral sul do estado, abrangendo capital e cidades vizinhas. Observamos a formação de cluster sig-nificativo com altas taxas de incidência de TB no litoral sul do estado e cluster de baixa incidência na região nordeste do estado. O risco de tuberculo-se foi maior no início de 2000, no tuberculo-sexo masculino e na faixa etária 40-59. As megacidades são áreas de risco importantes para a disseminação da tu-berculose. Estes achados poderiam ser usados para planejar medidas de controle de acordo com as ca-racterísticas de cada região.
Palavras-chave Tuberculose, Análise espacial, Incidência, Epidemiologia, Análise multinível
Abstract The aim of this study was to analyze
the spatial distribution of the tuberculosis endem-ic in Rio de Janeiro State from 2002 to 2011. A retrospective study was conducted in the state of Rio de Janeiro from 2002 to 2011. Spatial analysis techniques were used to describe the distribution of tuberculosis incidence in the state. Multilevel Poisson regression model was used to access the relationship of tuberculosis and the following factors: “sex”, “age-group” and “diagnostic year” (individual-level factors). Demographic density and municipality were also included in the model as contextual-level factors. A reduction in endem-ic tuberculosis was observed over the years. The highest incidence rates were concentrated on the south coast of the state, covering Rio de Janeiro City (capital) and neighboring cities. We detected a significant clustering of high TB incidence rates on the south coast of the state and a cluster of low incidence in the northeastern region of state. The risk of tuberculosis was higher in early 2000s, in males and in 40-59 age group. Metropolitan re-gions are important risk areas for the spread of tuberculosis. These findings could be used to plan control measures according to the characteristics of each region.
Key words Tuberculosis, Spatial analysis, Inci-dence, Epidemiology, Multilevel analysis
Nádia Cristina Pinheiro Rodrigues 1
Mônica Kramer de Noronha Andrade 1
Gisele O’Dwyer 1
Matthew Flynn2
José Ueleres Braga 1
Andréa Sobral de Almeida 1
Leonardo Soares Bastos3
R
odr
igues NCP Introduction
Spatial analysis studies are important tools for epidemiological surveillance. Their use in public health provides a better understanding of the dy-namics of the disease processes and diffusion as well as the relationship between the disease and the environment1. Some studies have evaluated
tuberculosis (TB) distribution using spatial anal-ysis tool2-7. In Portugal, the spatial distribution
of TB incidence rates (2004-2006) showed high values in large cities (Porto, Lisbon and Setúbal Peninsula), in north-eastern and in southern Portugal8. A Brazilian study (2002-2009)
detect-ed strong spatial auto correlation of TB rates and remarked that these rates were notably higher in urban areas on the eastern seaboard and in the west of the country9. Sales et al.2, also detected
high incidence rates of childhood TB in the ma-jor metropolitan areas of Espírito Santo State in southeastern Brazil in 2000-2007.
Despite TB’s heterogeneous distribution, with high concentration in vulnerable segments, such as, homeless population, Human Immu-nodeficiency Virus (HIV) positive patients, in-digenous populations, inmates, immigrants and health professionals10-12, studies of spatial analysis
are not frequently found in the literature11,13.
Rio de Janeiro State shows the highest inci-dence of TB in Brazil. The city of Rio de Janeiro (capital), as well as urban areas around the capi-tal, include populations of different social classes and have large percentage of agglomerations liv-ing in slums. Residents of the capital and neigh-boring municipalities are interchangeable popu-lations, which favors the spread of TB in the area. View of this context, the aim of this study was to analyze the spatial distribution of the TB endem-ic in Rio de Janeiro State, between 2002 and 2011.
Materials and Methods
The state of Rio de Janeiro is located in the south-east of Brazil and is the third most populous state of the country. Its administrative structure is composed of 92 municipalities. Its capital is Rio de Janeiro City, on the south coast of the state. Rio de Janeiro City is the second major urban concentration in the country. Niteroi is a big ur-ban center, neighboring the city of Rio de Janeiro. Rio de Janeiro and Niteroi show the best social indicators of the state and present several public and private institutions14,15. The population
den-sity is heterogeneous over state. The major
popu-lation density is detected in the south cost of the state, where is located the major urban centers, while in northeast, we can observe low popula-tion density.
We conducted an ecological study in the state of Rio de Janeiro, using spatial analysis as data processing technique. Municipalities were used as the geographical units of analysis.
Demographic data were obtained from pop-ulation censuses (2000 and 2010), and inter-cen-sus projections. We obtained the information about the number of confirmed pulmonary TB cases per municipality, sex, age and year of diag-nosis (2002-2011) from the Information System for Notifiable Diseases (SINAN). Surveillance of TB cases in Brazil is carried by SINAN. SINAN data come from the notification records and in-vestigation of cases of diseases and disorders set out on national list of notifiable diseases16. Case
information is collected via specific notification form that is filled in the health services.
To reduce the instability of indicators caused by the low number of cases and small population size, we aggregate data incidence into 2-year pe-riods (2002-2003, 2004-2005, 2006-2007, 2008-2009 and 2010-2011) to prepare the thematic maps. The most recent years (2012 and 2013) were not included in the analysis due to delays in the notification system.
Using data obtained from the Brazilian Insti-tute of Geography and Statistics (IBGE), popula-tion density in each municipality was calculated by dividing the population for each year by the area of each municipality (in square kilometers).
Crude and age-sex standardized incidence rates per 100,000 inhabitants were calculated for the geographic units using the number of new pulmonary TB cases (numerator) and the pop-ulation of each municipality (denominator). The 2002 population of the city of Niteroi was used as standard in standardized rates.
Statistical methods
In this paper we apply spatial analysis tech-niques, more specifically the preparation of the-matic maps using indicators of global and local spatial dependence.
We used the georeferenced mesh of munic-ipalities of the state of Rio de Janeiro (shapefile file), available from the “Brazilian Institute of Geography and Statistic” website, to prepare the-matic maps.
e C
ole
tiv
a,
22(12):4125-4134,
2017
To complement the analysis, we used Local In-dicators of Spatial Association (LISA) statistics. LISA Maps were constructed to show potentially distinct spatial correlation regimes in different sub-regions17.
To perform this work, we formulated a binary spatial weight matrix (w), whereas two counties are neighbors if they share a common physical boundary. Queen matrix, which considers two neighboring regions sharing a common border by analyzing also the vertices, was used to com-pute the statistic.
Moran scatter graphs were constructed for each two-year period (2002-2001) to evaluate the spatial association (via Global Moran Index) of the incidence of TB in each unit of area with the average incidence of its neighbors18. The four
quadrants in the graph provide a classification of four types of spatial autocorrelation: high-high (Q1), low-low (Q2), for positive spatial autocor-relation; high-low (Q3) and low-high (Q4), for negative spatial autocorrelation. The points lo-cated in quadrants Q3 (high-low) and Q4 (low-high) can be seen as units that do not follow the same spatial dependence process of the area19.
Multilevel Poisson regression model was used to explain the risk of tuberculosis. “TB cases” was the outcome and the explanatory variables were: 1) “sex”, “age-group” and “diagnostic year”, included as individual-level factors; 2) demo-graphic density and municipality, included as contextual-level factors. A logarithmic link func-tion (logarithm of the populafunc-tion of each munic-ipality) used as an offset was added in the model.
Poisson regression is a known model to modeling count data, but it provides poor fit in overdispersion situations20. By the other hand,
multilevel Poisson regression model, which in-corporates the random effects, is a workaround to circumvent overdispersion restriction of clas-sical Poisson models21.
The residual analysis of the model was per-formed using graphical of rank residuals and quantile-quantile plot of standardized residuals.
Graphical model and maps were used to pres-ent the results. All analyses were performed with TerraView (version 4.2.2.), GeoDa (version 1.4.6) and R-Project (version 3.1.3) software.
This study did not require submission to the Ethics and Research Committee, as it uses public access data, available on the DATASUS website22.
Results
In Rio de Janeiro State, crude rates of TB showed decreasing trends over the 2002-2011 peri-od, ranging from 92/100,000, in 2002-2003, to 68/100,000, in 2010-2011 (26% reduction). Us-ing standardized rates, however, we can detect greater decrease, ranging from 62/100,000, in 2002-2003, to 44/100,000, in 2010-2011 (29% reduction).
Some cities near the capital city of Rio de Janeiro had crude incidence rates greater than 100/100,000. The capital city’s highest rate was 110/100,000, in 2002-2003, and the lowest was 85/100,000, in 2010-2011. The highest incidence rate of TB was observed on the south coast of the state (city of Rio de Janeiro and surround-ing areas). Most of the municipalities with high rates (greater than 100/100,000) in the first two periods (2002-2005), decreased its rates in subse-quent periods. In 2002-2003, Rio de Janeiro City and some surrounding municipalities, which still showed rates lower than 100/100,000, after two subsequent years, increased their rates. In general, after 2004-2005 period there was a grad-ual reduction in the rates. In 2010-2011, only few municipalities showed crude rates higher than 100/100,000. Along the northeast coast of the state, only few municipalities showed rates higher than 79/100,000 in 2004-2005, which de-creased in the subsequent periods. In general, the crude rates of the northeastern region of the state were low, but rates of a particular municipality located at the border of the state (Bom Jesus de Itabapoana) fluctuated during the study period, peaking in 2004-2005 with rates of 120/100,000 (Figure 1).
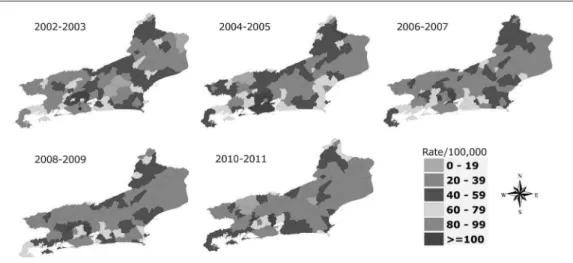
After standardize the rates (Figure 2), we could detect a more homogeneous risk of TB in Rio de Janeiro City and among its neighbors. From 2002 to 2005, most of the municipalities of the south cost of Rio de Janeiro State showed the highest levels of the standardized rates (≥ 100 cas-es per 100,000 inhabitants). The gradual reduc-tion of crude rates (Figure 1) is also detected in standardized rates (Figure 2). However, in 2010-2011, the standardized rates of the south coast of the state were more homogeneous than those observed from the crude rates - there are several municipalities with standardized rates ranging from 80 to 100/100,000 and few municipalities, which the rates were higher than 100/100,000 (Duque de Caxias and Japeri) (Figure 2).
R
odr
igues NCP
with the spatially lagged variable on y-axis and the original variable on x-axis. The highest Mo-ran’s I indexes were observed in 2006-2007 and 2008-2009 (Moran’s I = 0.55, p-value < 0.001). We could detected in the plots that most of the municipalities in the state of Rio de Janeiro are located in quadrants Q1 (high-high) and Q2 (low-low).
The LISA Cluster maps show that over time there was an increase in low-low areas in the northeast region of the state. These areas repre-sent units with low incidence rates following the same spatial dependence process of the area. The city of Rio de Janeiro and its surroundings were configured as high-high areas throughout the study period (i.e. units with high incidence rates
Figure 1. Distribution of crude rates of pulmonary tuberculosis per 100,000 inhabitants in the state of Rio de Janeiro.
*Rio de Janeiro City.
Figure 2.Distribution of standartized* rates of pulmonary tuberculosis per 100,000 inhabitants in the state of
Rio de Janeiro.
e C
ole
tiv
a,
22(12):4125-4134,
2017
following the same spatial dependence process of the area). Little change can be seen over time among the areas located near the south coast of the state. We could detected only few high-low and low-high areas (Figure 3). One municipality (Miguel Pereira), located near the city of Rio de Janeiro, showed as a low-high area in 2002-2003, 2006-2008 and 2010-2011 periods; and between these periods, it became a high-high area.
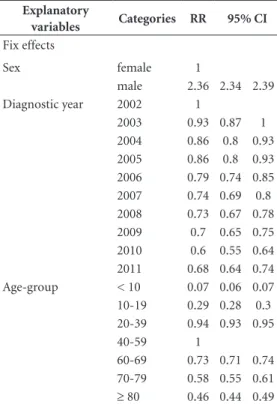
Sex was associated with the incidence of tu-berculosis, independent of age, year of diagno-sis, demographic density and municipality: RR = 2.36 (95% CI 2.34 – 2.39), indicating that men have, at least, twice the risk of getting sick com-pared to women (Table 1).
In Table 1, we could analyze the effect of the diagnostic year on the risk of TB, adjusted by sex, age, demographic density and municipality. The overall trend indicates reduction of the risk of TB over the time, i.e., the risk of TB in 2010 was 40% lower than in 2002 (95% CI 0.55 - 0.64). Com-pared to 2010, we could detect an increase of 15% in the risk of TB in 2011 (95% CI 1.06 – 1.24).
In Table 1, we could examine the effect of the age on the risk of TB, adjusted by sex, diagnostic year, demographic density and municipality. The finds suggest that the maximum risk of TB oc-curred in 40-59 age group (reference category), decreasing gradually, both for people older than 59 years, as for those younger than 40 years. The risk of TB for people aged 70-79 years was 42% lower than for those aged 40-59 years (95% CI
Figure 3. Lisa Cluster map of Empirical Bayesian Local Moran rates of tuberculosis in Rio de Janeiro.
*Rio de Janeiro City.
Table 1. Trends of the risk of tuberculosis in Rio de Janeiro State (Brazil), 2002-2011. A: Period effect on the tuberculosis incidence; B: Age effect on the tuberculosis incidence.
Explanatory
variables Categories RR 95% CI Fix effects
Sex female 1
male 2.36 2.34 2.39
Diagnostic year 2002 1
2003 0.93 0.87 1
2004 0.86 0.8 0.93 2005 0.86 0.8 0.93 2006 0.79 0.74 0.85 2007 0.74 0.69 0.8 2008 0.73 0.67 0.78 2009 0.7 0.65 0.75 2010 0.6 0.55 0.64 2011 0.68 0.64 0.74 Age-group < 10 0.07 0.06 0.07 10-19 0.29 0.28 0.3 20-39 0.94 0.93 0.95
40-59 1
R
odr
igues NCP 0.55 – 0.61). The risk of TB for people aged 10-19
years was 71% lower than for those aged 40-59 years (95% CI 0.28 – 0.30).
Among contextual-level factors, the munici-pality was able to explain more data variability than demographic density (municipality vari-ance was 0.28, while density varivari-ance was 0.02).
The analysis of residuals revealed that the model was fitted satisfactorily.
Discussion
Worldwide, tuberculosis is more prevalent in men than in women and is an important death cause in adults23,24. Corroborating our finds, the
results of a study performed in Poland also not-ed that the risk of TB is higher in men than in women25. Brazilian’s study, which covered young
population of Espírito Santo (Brazil), did not found significant difference of the proportion of TB between male and female2. Some studies
reported direct relationship between the increase of TB incidence and age26,27. The present study
found that the highest TB rates occurred among 20-59 years old. Before and after this stage of life, the risk was lower.
This declining pattern of TB incidence in Rio de Janeiro State over the time reflects the pattern that has been observed in Brazil, Americas and in worldwide. However, TB rates increased, even in some developed countries. Since 1990, incidence rates of TB in the United Kingdom rose, reaching 13.9/100,000 in 200528 and remained higher than
most Western European countries. The most striking increases occurred in sub-Saharan Africa and the former Soviet Union29.
Although the findings indicated that the rates of TB are dropping in the state of Rio de Janeiro, the local control of TB in the state is still recent. Furthermore, as TB is a disease with well-estab-lished treatment and cure protocols, and bearing in mind that the Brazilian government provides free treatment for the whole population, there is no justification for the persistence of such high rates of infection in the country.
Programmatic interventions, such as the im-plementation of DOTS (Directly Observed Ther-apy) and intensive active case-finding targeting population agglomerations, may be associated with recent reductions of incidence rates in Rio de Janeiro State30.
The highest rates of TB observed in this study occurred mainly in the major urban centers of Rio de Janeiro State and its surroundings areas.
These results correspond with findings from Liu et al., 2012, who also detected higher TB inci-dence rate in the urban district of Beijing/China (1997-2001) than in other districts with lower urbanization31.
Due to high population density and extreme social inequality, TB control in big cities is a glob-al chglob-allenge. Severglob-al studies showed that TB is as-sociated with conditions that express vulnerabil-ity to social determinants, such as, HIV co-infec-tion, drug abuse, immigraco-infec-tion, unemployment, low educational level, poor housing quality and crowded living conditions3,4,6. Wong et al.32
ana-lyzing the distribution of TB case notifications in Thailand (2010) according to the population density, observed an overlap of high population density areas in areas with greater amount of TB case notifications.
On the south coast of Rio de Janeiro State, there are areas within big cities, with pockets of poverty and privation, where housing conditions favor the spread of disease. TB incidence rates in these regions are higher than 200/100,00033.
Fasca33, 2008, analyzing the dynamics of TB
transmission in the state of Rio de Janeiro (2000-2002), observed the juxtaposition of the areas with high density of poor people and high rates of TB. These specific areas have been identified as more susceptible to the spread of TB. Pereira34,
analyzing TB in the city of Rio de Janeiro in 2010, also found that neighborhoods with a higher risk of the infection were located mainly in the poor-est areas of the city. Munch et al.6 found positive
association between TB incidence and the fac-tors: unemployment rate and agglomeration.
The risk of TB is even more dramatic in spe-cific populations such as residents of public shel-ters, prisons, and homeless people. In 2004, the incidence rate in a population of inmates in Rio de Janeiro reached an average of 3,137/100,00035.
These rates reflect the conditions of overcrowd-ing and precariousness existovercrowd-ing in these correc-tional institutions. The same happens with oth-ers overcrowded settings. Some studies showed an association between agglomeration and the increase of TB incidence6,36. This association may
be explained by the increase in contact time with the infected person and consequently higher risk of disease transmission.
e C
ole
tiv
a,
22(12):4125-4134,
2017
was around 60-100/km2, while in the regions of
the south coast of the state, population density reached values around 5,000-13,000/km237. The
proportion of residents living in shantytowns is also less frequent in the northeastern part of the state. The resident population in these clusters reaches about 20% in Rio de Janeiro City (south coast), while in Campos de Goytacazes (north-eastern), reaches less than 4%38. Besides, in
small-er municipalities thsmall-ere is greatsmall-er ease in imple-menting and expanding the government-spon-sored Family Health Program, which favors the earlier detection of TB cases and the reduction of disease transmission in these communities. In December 2011, only 35% of the population of the city of Rio de Janeiro was covered by the Family Health Program, while in small munic-ipalities with low population density, coverage strategy was 100%39.
Low-high areas have great potential risk for the increase of TB rates since they represent units with low incidence rates that do not follow the same spatial dependence process of the area. We detected only one municipality (Miguel Pereira) in this study with low incidence, despite high inci-dence rates amongst neighboring municipalities. This municipality fluctuated between low and high incidence over the study period, which may reflect the inefficiency of disease control efforts.
In this study, spatial exploratory data analysis of TB incidence rates revealed significant spatial autocorrelation similar to previous studies. Pri-or Brazilian research identified significant spa-tial autocorrelation of TB incidence from 2002 to 20099. Studies performed in the Republic of
China during the last two decades found global spatial autocorrelation of TB incidence for mi-grants40. In Taiwan (2003-2008), researchers also
demonstrated that there is a spatial dependency of township-level TB incidence41.
In the present study, we detected significant clustering of high TB incidence rates on the south coast of the state. A countrywide study per-formed in Brazil between 2002 and 2009 found that clusters of high-rate municipalities were present in the Central-West Region along the Paraguayan border; in the North Region (Ama-zonas State); along the northeast coastline and on the south/southeast coast, around the metropol-itan areas of Rio de Janeiro, São Paulo and Por-to Alegre9. Others studies performed in Africa’s
countries, like Ethiopia and Gambia also found evidence of significant clustering of TB cases30,42.
TB continues to represent a great public health problem in Brazil. The goal of the World
Health Organization is to cure 85% of new cas-es and to decrease the rate of treatment inter-ruption to less than 5%. However, in 2013, the percentage of cured cases reached only 75.2% in Brazil, and 72.3% in Rio de Janeiro43. The chance
of disease transmission is inversely proportional to the number of successfully treated/cured cases. And with greater disease transmission the oppor-tunity to reduce mortality also declines.
One of the major hurdles of TB control in Brazil is the delay in diagnosis. After the expan-sion of healthcare teams hired by the Brazilian government, there was an improvement in the population’s access to health services; however, the examination of sputum smear microscopy remains a challenge. In 2004, one fourth of new cases in Brazil did not undergo testing for TB diagnosis, and 27.1% of these occurred in the southeast region44.
The rate of treatment dropout in Rio de Ja-neiro State is 10% (2012)45. The reasons for
non-compliance seem to be related to the length of treatment, high dosage of the drugs, previous noncompliance, low educational level, unem-ployment, drug abuse and health service-related factors46,47. The non-adherence of the treatment
results in reduction in the cure rate, since un-treated bacillipherous subjects perpetuate the chain of transmission, further strengthening the endemic. Additional consequences are the in-crease in deaths, the development of more severe clinical forms and multidrug resistance strains47.
The cure, dropout and death rates in Brazil in 2012 were 75.9%, 8.9% and 2.4%, respectively. In Rio de Janeiro State, these rates were 72%, 10% and 5.3%, respectively. In Rio de Janeiro City, the cure rate was even lower, 68%45.
In the last years, there was an increase in resis-tance to the drugs used in TB treatment. Studies indicate that the presence of resistant and multi-drug-resistant TB are related to the performance of TB control in the region, i.e. places with low cure rate and high dropout rate have a greater number of resistant cases. In Brazil, the high per-centage of resistant TB cases is due to acquired resistance. More than half of the cases have a his-tory of three or more previous treatments, 65% of the cases present bilateral cavitary lesions and 7% are coinfected with HIV48.
R
odr
igues NCP certificates. However, the quality of the data from
Brazilian information systems is gradually being improved49.
TB control in metropolitan areas remains a challenge, especially in those with large popula-tion, high density and social inequality. Spatial analysis technique may help to monitor TB con-trol systems, produce hypotheses around trans-mission and guide intervention strategies.
Conclusion
This study showed that big metropolitan areas are important risk areas for the spread of TB. We seek to describe the spatial distribution of the disease in recent years and to analyze its re-lationship with some specific factors, in order to fill part of the gaps of knowledge about TB. Our results can be used as a base for further research-es, and also to plan control measures according to the characteristics of each region.
Collaborations
NCP Rodrigues conceived of the study, partici-pated in its design and coordination, helped to draft the manuscript and performed the statis-tical analysis. MKN Andrade, G O’Dwyer, M Flynn, JU Braga, AS Almeida, LS Bastos and VTS Lino helped to draft the manuscript, read and ap-proved the final manuscript.
Acknowledgements
e C
ole
tiv
a,
22(12):4125-4134,
2017
References
1. Barcellos C, Bastos FI. Are geoprocessing, environment, and health a possible combination?. Cad Saude Publica 1996; 12(3):389-397.
2. Sales CM, Figueiredo TA, Zandonade E, Maciel EL. [Spatial analysis on childhood tuberculosis in the state of Espirito Santo, Brazil, 2000 to 2007]. Rev Sociedade Brasileira de Medicina Tropical 2010; 43(4):435-439. 3. Ribeiro FK, Pan W, Bertolde A, Vinhas SA, Peres RL,
Ri-ley L, Palaci M, Maciel EL. Genotypic and Spatial Anal-ysis of Mycobacterium tuberculosis Transmission in a High-Incidence Urban Setting. Clin Infect Dis 2015; 61(5):758-766.
4. Bishai WR, Graham NM, Harrington S, Pope DS, Hooper N, Astemborski J, Sheely L, Vlahov D, Glass GE, Chaisson RE. Molecular and geographic patterns of tuberculosis transmission after 15 years of directly observed therapy. JAMA 1998; 280(19):1679-1684. 5. Haase I, Olson S, Behr MA, Wanyeki I, Thibert L,
Scott A, A. Zwerling, Ross N, Brassard P, Menzies D, Schwartzman K.Use of geographic and genotyping tools to characterise tuberculosis transmission in Mon-treal. Int J Tuberc Lung Dis. 2007; 11(6):632-638. 6. Munch Z, Van Lill SW, Booysen CN, Zietsman HL,
Enarson DA, Beyers N. Tuberculosis transmission pat-terns in a high-incidence area: a spatial analysis. Int J Tuberc Lung Dis. 2003; 7(3):271-277.
7. Chan-yeung M, Yeh AG, Tam CM, Kam KM, Leung CC, Yew WW, Lam CW. Socio-demographic and geograph-ic indgeograph-icators and distribution of tuberculosis in Hong Kong: a spatial analysis. Int J Tuberc Lung Dis 2005; 9(12):1320-1326.
8. Couceiro L, Santana P, Nunes C. Pulmonary tuberculo-sis and risk factors in Portugal: a spatial analytuberculo-sis. Int J Tuberc Lung Dis 2011; 15(11):1445-1454.
9. Harling G, Castro MC. A spatial analysis of social and economic determinants of tuberculosis in Brazil. Health & place 2014; 25:56-67.
10. Coimbra CE, Basta PC. The burden of tuberculosis in indigenous peoples in Amazonia, Brazil. Trans R Soc Trop Med Hyg 2007; 101(7):635-636.
11. Lindoso JA, Lindoso AA. Neglected tropical diseases in Brazil. Rev Inst Med Trop Sao Paulo 2009; 51(5):247-253.
12. Melo TE, Resendes AP, Souza-Santos R, Basta PC. Spa-tial and temporal distribution of tuberculosis in indig-enous and non-indigindig-enous of Rondônia State, Western Amazon, Brazil. Cad Saude Publica 2012; 28(2):267-280.
13. Belo EN, Orellana JD, Levino A, Basta PC. Tuberculo-sis in Amazonian municipalities of the Brazil-Colom-bia-Peru-Venezuela border: epidemiological situation and risk factors associated with treatment default. Rev Panam Salud Publica2013; 34(5):321-329.
14. Instituto Brasileiro de Geografia e Estatístic(IBGE). [Cities@] Brazil: Instituto Brasileiro de Geogra-fia e Estatística; 2013 [cited 2013 Jan 02]. Available from: http://cidades.ibge.gov.br/xtras/perfil.php?lang =&codmun=330330.
15. Instituto Brasileiro de Geografia e Estatística(IBGE). IBGE BIoGaS. [Estimates of Resident Population in Brazil and Federal Units with Reference Date in July 1st, 2014] Rio de Janeiro/Brazil: IBGE - Brazilian Insti-tute of Geography and Statistics; 2014. [cited 2013 Jan 02].Available from: ftp://ftp.ibge.gov.br/Estimativas_ de_Populacao/Estimativas_2014/estimativas_2014_ TCU.pdf.
16. Brazil. Ordinance n.1271 de 6 june de 2014.It defines the National List of Compulsory Notification of dis-eases, injuries and public health events in public and private health services throughout the national terri-tory, in accordance with the Annex, and makes other provisions. Official Diary of the Union 2014; 06 Jun 17. Moran PAP. The Interpretation of Statistical Maps.
Journal of the Royal Statistical Society Series B (Meth-odological) [Internet]. 1948; [cited 2013 Jan 02] 10:243-251. Available from: http://www.jstor.org/sta-ble/2983777.
18. Anselin L. The Moran scatterplot as an ESDA tool to assess local instability in spatial association. In: Fisher M, Scholten HJ, Unwin DW, editors. Spatial analytical perspectives in GIS. London: Taylor & Francis; 1996. p. 111-125.
19. Druck S, Carvalho MS, Monteiro AVM. Spatial Analysis of Geographic Data. Brasília: Embrapa; 2004.
20. Ismail N, Jemain AA. Handling Overdispersion with Negative Binomial and Generalized Poisson Regression Models. Casualty Actuarial Society Forum [Internet]. Winter 2007:[103-58 pp.]. [cited 2013 Jan 02]. Avail-able from: http://www.casact.org/pubs/forum/07wfo-rum/07w109.pdf.
21. Gelman A, Hill J. Data Analysis Using Regression and Multilevel/Hierarchical Models. New York (United States of America): Cambridge University Press; 2007. 22. Departamento de Informática do SUS (DATASUS).
[Health Information] Brazil2015 [cited 2014 Fev 16]. Ministério da Saúde do Brasil. Available from: http:// www2.datasus.gov.br/DATASUS/index.php.
23. Belo MT, Luiz RR, Hanson C, Selig L, Teixeira EG, Chalfoun T,Trajman A.Tuberculosis and gender in a priority city in the state of Rio de Janeiro, Brazil. J Bras Pneumol. 2010; 36(5):621-625.
24. World Health Organization (WHO). Global Tuberculo-sis Report 2013. Geneva: WHO; 2013.
25. Bai GH, Kim SJ, Lee EK, Lew WJ. Incidence of pul-monary tuberculosis in Korean civil servants: second study, 1992-1994. Int J Tuberc Lung Dis. 2001; 5(4):346-353.
26. Korzeniewska-Koseła M. Tuberculosis in Poland in 2012. Przegl Epidemiol. 2014; 68(2):295-300.
27. Hernández M, Casar C, García P, Morales V, Mamani N, Gómez-Cofré N, Pizarro P, Balcells ME. Latent tu-berculosis infection screening in healthcare workers in four large hospitals in Santiago, Chile. Rev Chilena Infectol 2014; 31(3):254-260.
R
odr
igues NCP 29. Okanurak K, Kitayaporn D, Wanarangsikul W, Koom-pong C. Effectiveness of DOT for tuberculosis treat-ment outcomes: a prospective cohort study in Bang-kok, Thailand. Int J Tuberc Lung Dis 2007; 11(7):762-768.
30. Tadesse T, Demissie M, Berhane Y, Kebede Y, Abebe M. The clustering of smear-positive tuberculosis in Dabat, Ethiopia: a population based cross sectional study. PloS one 2013; 8(5):e65022.
31. Liu Y, Li X, Wang W, Li Z, Hou M, He Y, et al. Investiga-tion of space-time clusters and geospatial hot spots for the occurrence of tuberculosis in Beijing. Int J Tuberc Lung Dis 2012; 16(4):486-491.
32. Wong MK, Yadav RP, Nishikiori N, Eang MT. The asso-ciation between household poverty rates and tubercu-losis case notification rates in Cambodia, 2010. Western Pac Surveill Response J. 2013; 4(1):25-33.
33. Fasca SF. Tuberculosis and living conditions: an analysis in the State of Rio de Janeiro. Rio de Janeiro: Fiocruz; 2008.
34. Pereira AGL. Spatial distribution of tuberculosis and its correlation with socioeconomic variables in the mu-nicipality of Rio de Janeiro in the years 2004-2006. Rio de Janeiro: UFRJ; 2010.
35. Sanchez AR, Massari V, Gerhardt G, Barreto AW, Cesconi V, Pires J, Espínola AB; Biondi E, Larouzé B, Camacho LAB. Tuberculosis in Rio de Janeiro prisons, Brazil: an urgent public health problem. Cad Saude Pu-blica 2007; 23(3):545-552.
36. Barbosa IR, Pereira LMS, Medeiros PFdM, Valentim RdS, Brito JMd, Costa ÍdCC. Spatial distribution anal-ysis of tuberculosis in Northeastern Brazil, 2005-2010. Epidemiol Serv Saúde. 2013; 22(4):687-695.
37. Universidade Federal do Estado do Rio de Janeiro (Unirio). Greipp. The situation of cities in the state of Rio de Janeiro: first results of the 2010 Census. Rio de Ja-neiro, Brazil 2012 [cited 2014 Out 10]. Available from: sfb.org.br/br/wp.../02/Levantamento_Dados_IBGE_ 2010_Final.docx.
38. Instituto Brasileiro de Geografia e Estatística Rio de Janeiro (IBGE). IBGE :Instituto Brasileiro de Geogra-fia e Estatística Rio de Janeiro, Brazil2014 [cited 2014 Out 20]. Available from: http://www.ibge.gov.br/home/ mapa_site/mapa_site.php#geociencias.
39. Brazilian Health Ministry. Primary Care Portal: His-tory of Family Health Coverage. 2014 [cited 2014 Out 16]. Available from: http://dab.saude.gov.br/portaldab/ historico_cobertura_sf.php.
40. Jia ZW, Jia XW, Liu YX, Dye C, Chen F, Chen CS, et al. Spatial analysis of tuberculosis cases in migrants and permanent residents, Beijing, 2000-2006. Emerg Infect Dis 2008; 14(9):1413-1419.
41. Ng IC, Wen TH, Wang JY, Fang CT. Spatial dependen-cy of tuberculosis incidence in Taiwan. PloS one 2012; 7(11):e50740.
42. Touray K, Adetifa IM, Jallow A, Rigby J, Jeffries D, Cheung YB, Donkor S, Adegbola RA, Hill PC. Spa-tial analysis of tuberculosis in an urban west African setting: is there evidence of clustering? Trop Med Int Health 2010; 15(6):664-672.
43. Brasil. Ministério da Saúde (MS) HM. Sistema de In-formação de Agravos de Notificação (SINAN). Brasília, Brazil 2014 [cited 2014 Nov. 11]. Available from: http:// dtr2004.saude.gov.br/sinanweb/index.php.
44. Bierrenbach AL, Gomes AB, Noronha EF, Souza MeF. Tuberculosis incidence and cure rates, Brazil, 2000-2004. Rev Saude Publica 2007; 41(Supl. 1):24-33. 45. Brasil. Ministério da Saúde (MS). Secretaria de
Vigilân-cia em Saúde (SVS). Epidemiological Bulletin - Special Tuberculosis. Brasília: SVS; 2012.
46. Ferreira SMB, Silva AMC, Botelho C. Treatment of bacilliferous pulmonary tuberculosis in Cuiabá, Mato Grosso State, Brazil (1998-2000):spatial distribution. Epidemiol Serv Saúde 2004; 13(3):175-184.
47. Paixao LM, Gontijo ED. Profile of notified tuberculosis cases and factors associated with treatment dropout. Rev Saude Publica 2007; 41(2):205-213.
48. Brazilian Health Ministry. Multidrug-resistant tubercu-losis - Guide to Epidemiological Surveillance. Brazilian: Ministry Health; 2007.
49. Ferreira VMB, Portela MC. Evaluation of under-re-porting of AIDS cases in the city of Rio de Janeiro based on data from the Hospital Information System of the Unified Health System. Cad Saude Publica 1999; 15(2):317-324.
Artigo apresentado em 23/09/2015 Aprovado em 09/05/2016