Sérgio Kiyoshi ISHIKIRIAMA Juan Fernando ORDOÑÉZ-AGUILERA Rafael Massunari MAENOSONO Fernanda Lessa Amaral VOLÚ Rafael Francisco Lia MONDELLI
Universidade de São Paulo, Bauru School of Dentistry, Department of Operative Dentistry, Endodontics and Dental Materials, Bauru, SP, Brazil.
Surface roughness and wear of resin
cements after toothbrush abrasion
Abstract: Increased surface roughness and wear of resin cements may cause failure of indirect restorations. The aim of this study was to evalu-ate quantitatively the surface roughness change and the vertical wear of four resin cements subjected to mechanical toothbrushing abrasion. Ten rectangular specimens (15 × 5 × 4 mm) were fabricated according to manufacturer instructions for each group (n = 10): Nexus 3, Kerr (NX3); Re-lyX ARC, 3M ESPE (ARC); ReRe-lyX U100, 3M ESPE (U100); and Variolink II, Ivoclar/Vivadent (VL2). Initial roughness (Ra, µm) was obtained through 5 readings with a roughness meter. Specimens were then subjected to tooth-brushing abrasion (100,000 cycles), and further evaluation was conducted
for inal roughness. Vertical wear (µm) was quantiied by 3 readings of the real proile between control and brushed surfaces. Data were subjected to
analysis of variance, followed by Tukey’s test (p < 0.05). The Pearson correla-tion test was performed between the surface roughness change and wear (p < 0.05). The mean values of initial/inal roughness (Ra, µm)/wear (µm) were as follows: NX3 (0.078/0.127/23.175); ARC (0.086/0.246/20.263); U100 (0.296/0.589/16.952); and VL2 (0.313/0.512/22.876). Toothbrushing abrasion increased surface roughness and wear of all resin cements tested, although no correlation was found between those variables. Vertical wear was simi-lar among groups; however, it was considered high and may lead to gap formation in indirect restorations.
Keywords: Dental Cements; Resin Cements; Dental Restoration Wear.
Introduction
An ideal luting procedure consists of a stable and long-lasting seal
between an indirect restoration and the tooth, avoiding iniltration and
preventing plaque accumulation.1 Due to high demand by patients for
cosmetic procedures using all-ceramic systems, cements also need to pro-vide adhesion and aesthetics. In this context, resin cements have some advantages, since these materials provide not only aesthetics and adhe-sion but also lower solubility than traditional dental cements based on glass ionomers and zinc phosphate.2,3
Despite these advantages, in a luting procedure, a cement line always
remains,4,5 and the exposure of this cement in the oral cavity makes it
sus-ceptible to degradation, which may occur as a result of intraoral mech-anisms such as water sorption, hydrolysis, dynamic fatigue,6 or even
toothbrushing abrasion.7 As a consequence, increased surface roughness
and wear can promote the retention of dental plaque, leading to a greater
Declaration of Interests: The authors certify that they have no commercial or associative interest that represents a conflict of interest in connection with the manuscript.
Corresponding Author:
Sergio Kiyoshi Ishikiriama E-mail: [email protected]
DOI: 10.1590/1807-3107BOR-2015.vol29.0011
Submitted: May 06, 2014
risk of developing secondary caries, periodontal dis-eases, discoloration, and even loss of the restoration.8
In 2- and 4-year clinical trials,9,10 resin cements have
already shown an increased loss of marginal integrity on indirect restorations, which could lead to premature fail-ure of these restorations. Some authors11,12,13 have already
assessed different characteristics of resin cements for a better understanding of this issue; however, still more evidence is necessary, particularly regarding surface roughness and wear of resin cements. Therefore, the aim of this study was to evaluate in vitro the surface roughness change and the vertical wear of different resin cements after mechanical toothbrushing abrasion.
Methodology
Experimental DesignThis study was performed with 10 experimen-tal specimens per group (n = 10). The following 2 quantitative response variables were obtained: roughness (Ra, µm) and vertical wear (µm). For roughness, two variation factors were present as follows: Resin Cement at four levels, Nexus 3
(NX3) (Kerr, Washington, USA); RelyX ARC (ARC)
(3M ESPE, St. Paul, USA); RelyX U100 (U100) (3M ESPE); and Variolink II (VL2) (Ivoclar/Vivadent, Schaan, Liechtenstein) (Table 1) and Time at two levels (initial and final). For vertical wear, the only variation factor present was Resin Cement at four levels (NX3, ARC, U100, VL2).
Specimen preparation
Ten specimens per group were prepared with a metallic matrix (4 × 5 × 15 mm).14 Light cure was
per-formed at three different points, each for 40 seconds,
to ensure light exposure throughout the sample. The specimen surfaces were polished using a metallo-graphic polishing machine (Arotec, Cotia, Brazil) with silicon carbide papers at 600, 800, and 1200 grit (Buehler, Lake Bluff, USA) and regular cooling water. All specimens were stored hermetically in sealed bottles containing deionized water at 37 ± 1 °C and 100% absolute humidity for 7 days.
Toothbrushing abrasion
Before the abrasive challenge, half of the surface area was protected with isolation tape to serve as the control side. Toothbrushing abrasion was performed in a toothbrushing machine (Elquip, Sao Carlos, Brazil) particularly developed for testing purposes15,16 with
soft-bristle dental brushes (Johnson & Johnson Indus-trial Ltda., Sao José dos Campos, Brazil) and abrasive toothpaste (Colgate Palmolive Ltda., Sao Bernardo do Campo, Brazil). Toothbrushes were positioned to have contact with only half of the specimen surface, and the other half remained protected with isolation tape. In total, 100,000 cycles were performed, at 4.5 cycles per second, with load of 300 g over the toothbrush heads.14,15 Every 2 minutes, a 0.4-mL quantity of
tooth-paste and distilled water (ratio, 1:2) was injected, and the toothbrushes were changed at the end of 50,000 cycles. After abrasion testing, specimens were rinsed under running water and cleaned in a sonic device for 5 minutes and then stored in deionized water (37 °C).
Roughness and vertical wear measurements
Surface roughness was analyzed with a rough-ness meter (Jenoptik AG, Jena, Germany) and Turbo
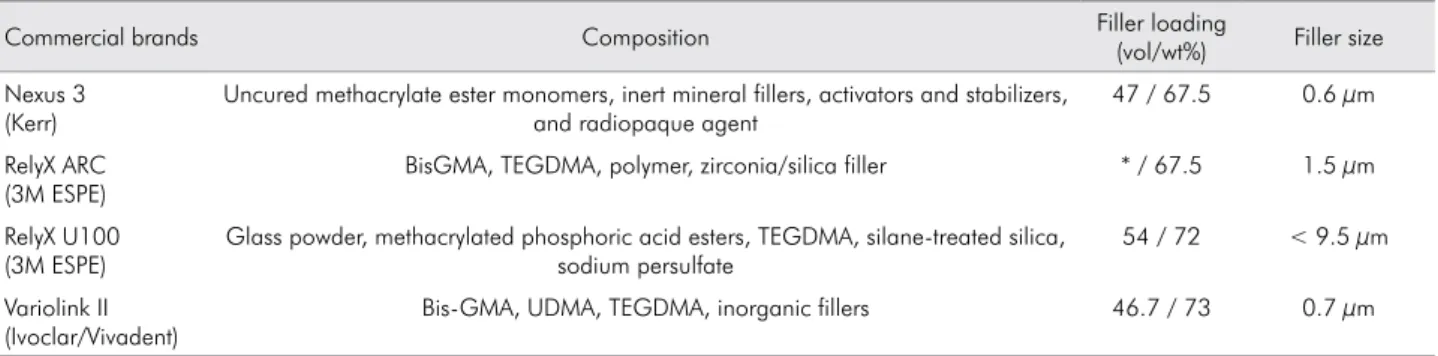
Table 1. Commercial brands, polymerization type, composition, filler size, and ratio of resin cements evaluated.
Commercial brands Composition Filler loading
(vol/wt%) Filler size
Nexus 3 (Kerr)
Uncured methacrylate ester monomers, inert mineral fillers, activators and stabilizers, and radiopaque agent
47 / 67.5 0.6 μm
RelyX ARC (3M ESPE)
BisGMA, TEGDMA, polymer, zirconia/silica filler * / 67.5 1.5 μm
RelyX U100 (3M ESPE)
Glass powder, methacrylated phosphoric acid esters, TEGDMA, silane-treated silica, sodium persulfate
54 / 72 < 9.5 μm
Variolink II (Ivoclar/Vivadent)
Bis-GMA, UDMA, TEGDMA, inorganic fillers 46.7 / 73 0.7 μm
Datawin software (Hommel-Etamic, Schwenningen,
Germany). Five random readings were obtained from each specimen surface, and mean roughness values (Ra) were obtained.17 Initial roughness (baseline) was
performed before the toothbrushing test, while inal
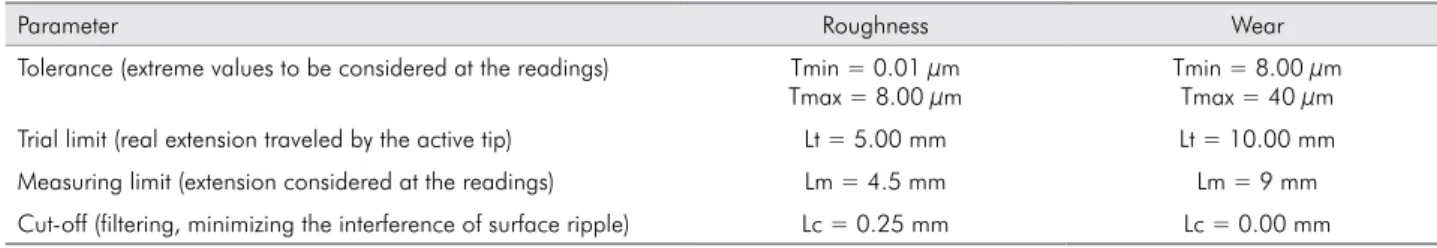
roughness was obtained after the test. The parameters for roughness measurements are listed in Table 2.
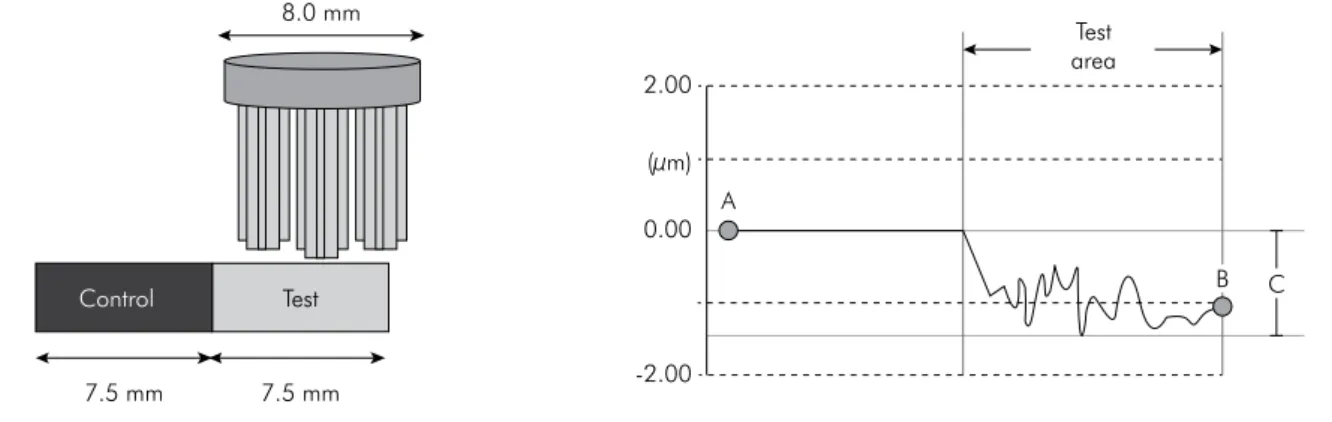
For vertical wear evaluation, the same
equip-ment was used in the proilometer function, and the parameters are also listed in Table 2. Wear was
calculated by the mean of three readings of the real
proile. The active tip of the proilometer traced the
specimen’s surface from the control side to the test side (Figure 1).
Statistical analysis
Roughness data were subjected to repeated-mea-sures analysis of variance (ANOVA), followed by Tukey’s test (p≤ 0.05). Vertical wear data were
ini-tially subjected to the Shapiro–Wilks normality test,
and because data presented a normal distribution, the parametric one-way ANOVA was performed. The Pearson correlation test was also performed for correlation between wear and roughness (p≤ 0.05). All statistical analyses were performed with the soft-ware Statistica 10.0 (StatSoft, Tulsa, USA).
Results
Roughness analysis
Means and standard deviations of roughness (Ra, μm) before and after toothbrushing abrasion for each group are described in Table 3.Both variation
factors (Resin Cements and Time) were signiicant,
with interactions between factors. NX3 and ARC pre-sented lower surface roughness values, while U100 and VL2 presented higher values. Regarding
dif-ferences between initial and inal roughness, ARC,
U100, and VL2 presented higher surface roughness values after toothbrushing abrasion.
Vertical wear analysis
Table 4 presents means and standard deviations of vertical wear (µm) after toothbrushing abrasion. No
sta-tistically signiicant differences were observed (p = 0.052).
Correlation between surface roughness and vertical wear
No correlation was found by the Pearson corre-lation test between vertical wear/initial roughness (p = 0.789) and vertical wear/inal roughness (p = 0.897).
Discussion
Surface roughness is a characteristic of resin cement that plays an important role in the adherence
and maturation of the bacterial bioilm. According to
some authors, surface roughness values higher than
0.2 µm may signiicantly increase plaque adhesion,18
supporting the development of secondary caries and periodontal diseases. In the present study, two of four resin cements showed initial surface roughness values higher than 0.2 µm, and after toothbrushing abrasion, only NX3 presented a satisfactory surface roughness. These results are concerning and empha-size the need for more investigations in this area.
U100 and VL2 presented signiicantly higher surface
roughness values than NX3 and ARC. One possible
explanation is the percentage of iller loading (Table
1). Both U100 and VL2 have a higher percentage of
iller loading, which may lead to {1.1 [EN] Please check
the change} increased surface roughness when asso-ciated with the less viscous resin matrix needed for cements. Some authors have investigated the effect of
toothbrushing abrasion on lowable resin composites,
which are also less viscous than restorative composites.
Table 2. Parameters used for initial and final roughness measurements.
Parameter Roughness Wear
Tolerance (extreme values to be considered at the readings) Tmin = 0.01 μm Tmax = 8.00 μm
Similar results are observed, with increased surface roughness after the toothbrushing test.15
The mechanism by which resin cements become rougher after toothbrushing abrasion is still not well established. The authors hypothesize that mechanical abrasion may degrade the organic matrix and expose filler particles, leading to increased surface roughness, particularly in resin cements with higher filler loading. Analysis such as by atomic force microscopy may be useful for a better understanding of this issue.
In terms of wear, no statistically significant dif-ference was observed (p = 0.052). The great stan-dard deviation determined by this methodology did not provide enough test power, which was con-sidered lower (0.43) than that desired (0.80). Further investigations with this methodology must con-sider a higher number of specimens to avoid the lack of differences between resin cements. Some authors have observed lower numerical values of vertical wear after toothbrushing abrasion of resin cements positioned between layers of lithium dis-ilicate.4 Despite the fact that this situation is more
similar to the clinical usage of resin cements, the ceramic layers could protect resin cements from further wear beyond the positioning of the tooth-brushes, which may have led to the lower wear values.Both results, however, are indicative that resin cements lack significant wear resistance and may be susceptible to the development of gaps in indirect restorations over time. These findings are in agreement with those of a recent controlled clinical trial that reported 90% of small marginal deficiencies, probably caused by increased wear of RelyX Unicem over a 4-year period.9
The authors believe that the mechanisms by which an abrasive challenge leads to the surface roughness change and wear are considerably dif-ferent, which may have resulted in the lack of cor-relation between these response variables. The former response variable may be more related to stability between fillers and organic matrix: for example, some authors have observed that silorane Table 3. Means and standard deviations of initial and final
roughness (Ra, μm) after toothbrushing abrasion.
Groups Initial Roughness Final Roughness NX3 0.078 ± 0.044 aA 0.127 ± 0.043 aA ARC 0.086 ± 0.057 aA 0.246 ± 0.042 bA
U100 0.296 ± 0.125 aB 0.589 ± 0.168 bB VL2 0.313 ± 0.086 aB 0.511 ± 0.110 bB Lowercase letters - analysis between columns (initial × final). Uppercase letters - analysis between rows (group comparison).
Table 4. Means and standard deviations of wear for all tested cements (μm).
Groups Wear
U100 16.95 ± 4.36A
ARC 20.26 ± 6.00A
VL2 22.88 ± 5.22A
NX3 23.18 ± 5.97A
Uppercase letters - analysis between rows (group comparison).
C B Test
area 2.00
A (µm)
0.00
-2.00 8.0 mm
7.5 mm 7.5 mm
Test
Control
resin composites are very stable in aqueous solu-tion, and they show smooth surface roughness even after 1-year water storage.19 Conversely,
verti-cal wear may be more associated with individual characteristics of fillers and organic matrix. Restor-ative resin composites, which have formulations very similar to those of resin cements, present sat-isfactory wear resistance and can be used safely in posterior teeth restorations. They differ from resin cements mainly in filler loading, shape and size, and a higher viscosity of the organic matrix, which may lead to increased wear resistance.
Conclusion
It is possible to conclude that resin cements pres-ent increased surface roughness after toothbrushing
abrasion. Cements with higher percentages of iller
loading presented higher surface roughness values. All cements showed similar but high rates of verti-cal wear after toothbrushing.
Acknowledgements
The authors acknowledge FAPESP (Fundação de Amparo à Pesquisa do Estado de São Paulo) for inancial support (process no. 2010/14111-0).
1. Pegoraro TA, da Silva NR, Carvalho RM. Cements for use in
esthetic dentistry. Dent Clin North Am. 2007 Apr;51(2):453-71.
2. Vrochari AD, Eliades G, Hellwig E, Wrbas KT. Water sorption and solubility of four self-etching, self-adhesive resin luting
agents. J Adhes Dent. 2010 Feb;12(1):39-43.
3. Cruz CAS, Adabo GL, Rettondini WC, Sa DN, Silva Filho FP. Penetration of calcium hydroxide based cements by den-tal enamel conditioning acids. Rev Odontol UNESP. 1990 Jan;19(1):173-82. [Portuguese].
4. Belli R, Pelka M, Petschelt A, Lohbauer U. In vitro wear gap formation of self-adhesive resin cements: a CLSM evaluation.
J Dent. 2009 Dec;37(12):984-93.
5. Prakki A, Cilli R, Da Costa AU, Goncalves SE, Mondelli RF, Pereira JC. Effect of resin luting film thickness on fracture resistance of a ceramic cemented to dentin. J Prosthodont. 2007 May-Jun;16(3):172-8.
6. Cilli R, Mattos MC, Honorio HM, Rios D, Araujo PA, Prakki A. The role of surface sealants in the roughness of
com-posites after a simulated toothbrushing test. J Dent. 2009 Dec;37(12):970-7.
7. Goldstein GR, Lerner T. The effect of toothbrushing on a
hy-brid composite resin. J Prosthet Dent. 1991 Oct;66(4):498-500.
8. Bollen CML, Lambrechts P, Quirynen M. Comparison of surface roughness of oral hard materials to the threshold surface roughness for bacterial plaque retention: a review
of the literature. Dent Mater. 1997 Jul;13(4):258-69.
9. Peumans M, Voet M, De Munck J, Van Landuyt K, Van Ende A, Van Meerbeek B. Four-year clinical evaluation of a self-adhesive luting agent for ceramic inlays. Clin Oral Investig. 2013 Apr;17(3):739-50.
10. Taschner M, Krämer N, Lohbauer U, Pelka M, Breschi L, Petschelt A, et al. Leucite-reinforced glass ceramic inlays luted with self-adhesive resin cement: a 2-year in vivo study.
Dent Mater. 2012 May;28(5):535-40.
11. Calgaro PA, Furuse AY, Correr GM, Ornaghi BP, Gonzaga CC. Influence of the interposition of ceramic spacers on the degree of conversion and the hardness of resin cements. Braz Oral Res. 2013 Sep-Oct;27(5):403-9.
12. Ishikiriama SK, Maenosono RM, Oda DF, Ordoñez-Aguilera
JF, Wang L, Mondelli RF. Influence of volume and activation
mode on polymerization shrinkage forces of resin cements.
Braz Dent J. 2013 July-Aug;24(4):326-9.
13. Jongsma LA, Kleverlaan CJ, Pallav P, Feilzer AJ. Influence of polymerization mode and C-factor on cohesive strength of
dual-cured resin cements. Dent Mater. 2012 Jul;28(7):722-8.
14. Prakki A, Cilli R, Araujo PA, Navarro MF, Mondelli J, Mon-delli RF. Effect of toothbrushing abrasion on weight and
sur-face roughness of pH-cycled resin cements and indirect re -storative materials. Quintessence Int. 2007 Oct;38(9):e544-54. 15. Garcia FC, Wang L, D’Alpino PH, Souza JB, Araujo PA, Mon -delli RF. Evaluation of the roughness and mass loss of the flowable composites after simulated toothbrushing abrasion. Braz Oral Res. 2004 Apr-Jun;18(2):156-61.
16. Mondelli RF, Prakki A, Cilli R, Navarro MF, Mondelli J. Sur-face roughness average and scanning electron microscopic observations of resin luting agents. J Appl Oral Sci. 2003
Dec;11(4):327-31.
17. Prakki A, Cilli R, Mondelli RF, Kalachandra S. In vitro wear, surface roughness and hardness of propanal-containing and diacetyl-containing novel composites and copolymers based
on bis-GMA analogs. Dent Mater. 2008 Mar;24(3):410-7.
18. Quirynen M, Bollen CM. The influence of surface roughness and surface-free energy on supra- and subgingival plaque formation in man. A review of the literature. J Clin Periodon-tol. 1995 Jan;22(1):1-14.
19. Giannini M, Di Francescantonio M, Pacheco RR, Cidreira Boaro LC, Braga RR. Characterization of water sorption, solu-bility, and roughness of silorane- and methacrylate-based