www.bjorl.org
Brazilian
Journal
of
OTORHINOLARYNGOLOGY
ORIGINAL
ARTICLE
Long-latency
auditory
evoked
potentials
with
verbal
and
nonverbal
stimuli
夽
,
夽夽
Sheila
Jacques
Oppitz
a,∗,
Dayane
Domeneghini
Didoné
a,
Débora
Durigon
da
Silva
b,
Marjana
Gois
b,c,
Jordana
Folgearini
b,
Geise
Corrêa
Ferreira
b,
Michele
Vargas
Garcia
b,daHumanCommunicationDisorders,UniversidadeFederaldeSantaMaria(UFSM),SantaMaria,RS,Brazil bUniversidadeFederaldeSantaMaria(UFSM),SantaMaria,RS,Brazil
cFundodeIncentivoàPesquisa(FIPE),SantaMaria,RS,Brazil dUniversidadeFederaldeSãoPaulo(UNIFESP),SãoPaulo,SP,Brazil
Received24June2014;accepted8October2014 Availableonline7September2015
KEYWORDS
Audiology; Electrophysiology; Evokedpotentials, auditory;
Event-related potentials,P300
Abstract
Introduction:Long-latencyauditoryevokedpotentialsrepresentthecortical activityrelated toattention,memory,andauditorydiscriminationskills.Acousticsignalprocessingoccurs dif-ferentlybetweenverbalandnonverbalstimuli,influencingthelatencyandamplitudepatterns.
Objective: TodescribethelatenciesofthecorticalpotentialsP1,N1,P2,N2,andP3,aswell asP3amplitude, withdifferentspeech stimuliandtonebursts,andtoclassifythem inthe presenceandabsenceofthesedata.
Methods:A total of30 subjects withnormalhearing were assessed,aged 18---32 yearsold, matchedbygender.Nonverbalstimuliwereused(toneburst;1000Hz---frequentand4000Hz --- rare);andverbal(/ba/---frequent;/ga/,/da/,and/di/---rare).
Results:ConsideringthecomponentN2fortoneburst,thelowestlatencyfoundwas217.45ms for theBA/DIstimulus;thehighestlatencyfound was256.5ms.For theP3component,the shortestlatencywithtoneburststimuliwas298.7withBA/GAstimuli,thehighest,was340ms. For theP3 amplitude, therewas no statisticallysignificant difference among the different stimuli.ForlatenciesofcomponentsP1,N1,P2,N2,P3,therewerenostatisticaldifferences amongthem,regardlessofthestimuliused.
Conclusion: TherewasadifferenceinthelatencyofpotentialsN2andP3amongthestimuli employedbutnodifferencewasobservedfortheP3amplitude.
© 2015Associac¸ãoBrasileira de Otorrinolaringologiae CirurgiaCérvico-Facial. Publishedby ElsevierEditoraLtda.Allrightsreserved.
夽
Pleasecitethisarticleas:OppitzSJ,DidonéDD,daSilvaDD,GoisM,FolgeariniJ,FerreiraGC,etal.Long-latencyauditoryevoked
potentialswithverbalandnonverbalstimuli.BrazJOtorhinolaryngol.2015;81:647---52.
夽夽Institution:UniversidadeFederaldeSantaMaria(UFSM),SantaMaria,RS,Brazil.
∗Correspondingauthor.
E-mail:[email protected](S.J.Oppitz). http://dx.doi.org/10.1016/j.bjorl.2014.10.005
PALAVRAS-CHAVE
Audiologia; Eletrofisiologia; Potenciaisevocados auditivos;
Potencialevocado P300
Potenciaisevocadosauditivosdelongalatênciacomverbaisenãoverbais
Resumo
Introduc¸ão:Ospotenciaisevocadosauditivosdelongalatênciarepresentamaatividadecortical relacionadaàshabilidadesdeatenc¸ão,memóriaediscriminac¸ãoauditiva.Oprocessamentodo sinal acústicoocorre demaneira diferente entre estímulosverbais enão verbais, podendo interferirnospadrõesdelatênciaeamplitude.
Objetivo:DescreveraslatênciasdospotenciasP1,N1,P2,N2eP3eaamplitudedoP3comos diferentesestímuloseclassificarempresenc¸aeausênciaestasinformac¸ões.
Método: Foramavaliados30indivíduos,comfaixaetáriade18a32anos.Equiparadosquanto ao gêneroenormo-ouvintes. Foramutilizadosestímulosnão verbais(1.000HZ -frequentee 4.000Hz-raro)everbais(/ba/-frequentee/ga/,/da/,/di/-raros).
Resultados: ConsiderandoocomponenteN2,para otoneburstencontrou-seamenor latên-ciaemtornode217,45msepara oestímuloBA/DIamaiorlatênciaemtornode256,5ms. NoquedizrespeitoacomponenteP3,alatênciaencontradacomtoneburstfoiamenorem tornode298,7msecomoestimuloBA/GAamaioremtornode340ms.Paraaamplitudeem P3,nãohouvediferenc¸aestatisticamentesignificanteentreosdiferentesestímulos.Quantoàs informac¸õesreferentesaosvaloresdaslatênciasdoscomponentesP1,N1,P2,N2eP3, inde-pendentedoestímuloutilizadohouvepresenc¸adoscomponentes semdiferenc¸asestatísticas entreeles.
Conclusão:Houvediferenc¸analatênciadopotencialN2eP3entreosestímulos,masnãofoi observadadiferenc¸aparaaamplitudedoP3.
©2015Associac¸ãoBrasileira deOtorrinolaringologiaeCirurgiaCérvico-Facial.Publicadopor ElsevierEditoraLtda.Todososdireitosreservados.
Introduction
Long-latencyauditoryevokedpotentials(LLAEP)havebeen usedinclinical practicetocomplementbehavioral assess-mentsofauditoryprocessing.Theyaredescribedaspositive (P)andnegative(N)peaks,whichrepresentcorticalactivity relatedtoattention, memory,andauditory discrimination skills.
TheLLAEP includethepositive1(P1),negative1(N1), positive2(P2),negative2(N2),andpositive3(P3)waves, andaresubdivided intoexogenouspotentials(P1, N1,P2, N2),whichareinfluencedbythephysicalcharacteristicsof thestimulus,suchasintensity,duration,andfrequency,and theendogenouspotential(P3),predominantlyinfluencedby theeventsrelatedtocognitiveskill.1
Frequent and rarestimuli (oddballparadigm) are used toobtainthecorticalpotentials. Themostusedstimuliin clinicalpracticearethetoneburst,representedbyalower frequency(frequentstimulus)andahigherfrequency(rare stimulus). However,a series of different stimuli, such as vowel,syllable,andwordcontrastsandevensentencescan beusedtoevokethesepotentials.2,3
Some studies4,5 have reported that acoustic signal processing occurs differently between verbal and non-verbalstimuli,whichmayinfluencethepatternsoflatency and amplitude of cortical potentials. Despite the lack of standardization ofcortical potentialswithspeechstimuli, some studies indicate that these stimuli would be ideal for studying the neural basis of speech detection and discrimination,3,6 and for contributing toadditional infor-mationregardingcomplexsignalprocessing.
Speech stimuli have been used to provide speech signal processing information in situations where behav-ioral assessment is not a precise method, helping in the identification of alterations in speech detection or discrimination.7
Basedontheabovementionedfactsandtheneedto char-acterizecorticalpotentials withdifferentstimuli,theaim ofthisstudywastocomparethelatencyofcortical poten-tialsP1,N1,P2,N2,andP3,aswellasP3amplitude,with differentspeechandtoneburststimuli.
Methods
ThisstudywasapprovedbytheResearchEthicsCommittee (REC)underprotocolNo.25933514.1.0000.5346.
Individualssigned the informedconsent,agreeingwith thestudyobjectivesandparticipation.
Atotalof 30individuals,aged18---32years,15 females and 15 males, with normal hearing and no risk history for hearing, neurological, and language alterations were assessed.
Thevisualinspectionoftheexternalauditorycanalwas initiallyperformedusingaclinicalWelch-Allynotoscopeto rule out any alterations that could influence audiometric thresholds.
individualswerethosewiththree-toneaverage(500,1000, and2000Hz)≤25dBHL(decibelhearinglevel).8
Acoustic impedance measurements were performed usinganInteracousticsAT235middleearanalyzertoassess the tympanometric curve and acoustic reflexes. Reflexes were assessed at the frequencies 500---4000Hz bilaterally inthe contralateralmode. The sampleincluded only indi-viduals with type A tympanogram with present acoustic reflexes.9
Two-channelIntelligentHearingSystemsequipmentwas used for the detection of long-latency auditory evoked potentials.Theskinwascleanedwithabrasivepasteandthe electrodeswereplacedusingelectrolyticpasteandadhesive tape, inthe A1(leftmastoid), A2(right mastoid), andCz (vertex)positions, withtheground electrode(Fpz)placed ontheforehead.Theimpedancevalueoftheelectrodeswas requiredtobe≤3k.
The patient wasinstructed to pay attention to differ-entstimuli(rarestimulus)thatappearedrandomlywithina seriesofequalstimuli(frequentstimulus).Thepercentage ofoccurrenceofrarestimuliwas20%,and80%forfrequent stimuli.
Non-verbal stimuli were used (tone burst) at the fre-quenciesof 1000Hz (frequentstimulus) and4000Hz(rare stimulus),aswellasverbalstimuli(syllables/ba/---frequent stimulus and /ga/, /da/,and /di/ --- rare stimulus), pre-sentedbinaurallyatanintensityof75dBHL.Foreachtype ofstimulus(verbal/nonverbal) atotalof 300stimuliwere used(approximately240frequentand60rare)toobtainthe potentials.Thetracingswerenotreplicated,asreplication canturnararestimulusintoafrequentoneforthepatient. TheparametersaredescribedinTable1.
Thestudystartedwiththepairs/ba/and/ga/,followed by/ba/and/di/,/ba/and/da/,andtoneburst,withall speechstimuliandtoneburstpresentedpriortotracing,so thatpatientscouldbecomefamiliarizedwiththedifferent stimuli.Aftertheassessmentofthefirsttwospeechstimuli, patientswereinstructedtorest,sothatfatiguewouldnot influencetheanswersofthelasttwosequencesofstimuli. Latencyvalueswere obtainedbyidentifyingthe waves atthehighestpeakamplitude,withtheP3component con-sideredonlyinthetracingoftherarestimuli,whereasP1, N1,P2,N2wereconsideredinthefrequentstimulus,with norecordedreproductionofthesewaves,asthecollection
Table1 MeanandstandarddeviationfortheP1,N1,P2,N2,andP3componentswithallspeechstimuli(BA-GA/BA-DA/BA-DI) andtoneburst(1000Hz×4000Hz).
Variables Stimuli p§
BA×GA BA×DA BA×DI 1000×4000Hz
n Mean SD n Mean SD n Mean SD n Mean SD
P1
RE 26 62.2 8.1 27 59.8 8.1 25 65.5 18.3 22 62.2 11.9 0.393 LE 25 62.6 10.9 25 60.4 7.0 25 67.2 17.5 21 64.1 13.3 0.382
p-Value§ 0.909 0.944 0.057 0.557
N1
RE 30 103.8ab 10.4 30 103.3ab 11.9 30 107.8a
18.2 30 99.3b 14.7 0.038
LE 30 108.3 10.5 30 103.7 10.9 30 109.3 17.9 30 101.9 16.2 0.067
p-Value <0.001 0.726 0.178 0.135
P2
RE 30 173.2ab 19.9 30 175.7ab 20.4 30 182.7a 26.2 30 171.5b 26.7 0.026
LE 30 176.9b 17.0 30 175.5b 24.5 30 187.1a
24.1 30 175.5b 28.6 0.017
p-Value 0.140 0.945 0.016 0.153
N2
RE 23 245.7ab 37.0 16 237.1b 43.4 14 251.6a 37.7 10 216.4c 34.8 0.006
LE 22 255.3ab 29.6 14 232.6b 38.7 13 261.4a
33.2 13 218.5c 39.2 0.003
p-Value 0.188 0.526 0.720 0.517
P3
RE 26 341.7a 44.2 26 301.5c 47.5 25 324.2b 59.2 25 297.0b 27.3 0.005
LE 26 344.4a 46.5 28 303.4c 46.3 21 329.9ab 63.4 24 300.4b 36.4 0.002
p-Value 0.171 0.325 0.619 0.163
AmplitudeofP3
RE 27 6.2 2.2 30 6.9 5.3 24 6.3 2.8 26 5.8 2.1 0.208
LE 26 6.6b 2.1 28 7.8a 5.4 21 6.7b 2.5 24 6.1c 2.3 0.027
p-Value 0.700 0.095 0.999 0.737
§ Analysisofvarianceforrepeatedmeasures---posthocBonferroni,wheremeansfollowedbythesameletters(inline)donotdiffer
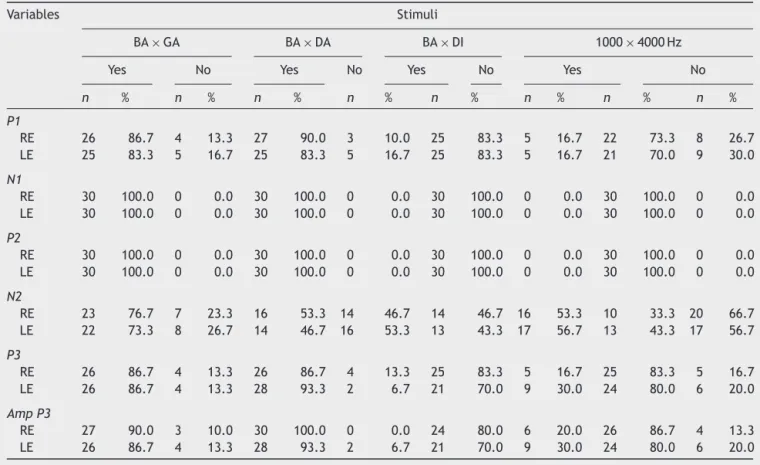
Table2 AbsolutedistributionandrelativetothepresenceandabsenceofinformationonthedataforcomponentsP1,N1,P2, andN2withallspeechstimuli(BA---GA/BA---DA/BA---DI)andtoneburst(1000Hz×4000Hz).
Variables Stimuli
BA×GA BA×DA BA×DI 1000×4000Hz Yes No Yes No Yes No Yes No
n % n % n % n % n % n % n % n %
P1
RE 26 86.7 4 13.3 27 90.0 3 10.0 25 83.3 5 16.7 22 73.3 8 26.7 LE 25 83.3 5 16.7 25 83.3 5 16.7 25 83.3 5 16.7 21 70.0 9 30.0
N1
RE 30 100.0 0 0.0 30 100.0 0 0.0 30 100.0 0 0.0 30 100.0 0 0.0 LE 30 100.0 0 0.0 30 100.0 0 0.0 30 100.0 0 0.0 30 100.0 0 0.0
P2
RE 30 100.0 0 0.0 30 100.0 0 0.0 30 100.0 0 0.0 30 100.0 0 0.0 LE 30 100.0 0 0.0 30 100.0 0 0.0 30 100.0 0 0.0 30 100.0 0 0.0
N2
RE 23 76.7 7 23.3 16 53.3 14 46.7 14 46.7 16 53.3 10 33.3 20 66.7 LE 22 73.3 8 26.7 14 46.7 16 53.3 13 43.3 17 56.7 13 43.3 17 56.7
P3
RE 26 86.7 4 13.3 26 86.7 4 13.3 25 83.3 5 16.7 25 83.3 5 16.7 LE 26 86.7 4 13.3 28 93.3 2 6.7 21 70.0 9 30.0 24 80.0 6 20.0
AmpP3
RE 27 90.0 3 10.0 30 100.0 0 0.0 24 80.0 6 20.0 26 86.7 4 13.3 LE 26 86.7 4 13.3 28 93.3 2 6.7 21 70.0 9 30.0 24 80.0 6 20.0
replicationcouldresultinfatigueandimpairtheassessment outcome,sinceitdependsontheindividual’sattention.
Dataweretabulatedandstatisticallyanalyzed, compar-ing the latencies of components P1, N1, P2, N2, and P3 betweenspeechstimuliandtoneburst.
Results
Theresultsrefertothesampleof30assessedindividuals, withameanageof23.3(±3.5)years,withaminimumof 18and maximumof 32 years.Therewasan equal gender distribution,with50.0%(n=15)formenandwomen.
Mean, and standard deviation measurements were obtainedforthelatencyvaluesofcomponentsP1, N1,P2, N2,andP3asshowninTable1.
ForP1,N1andP2components,therewerenosignificant differencesdetectedbetweenstimuliinboththeREandthe LE.
For the N2 component, a significant difference was observed (p-value 0.006 and 0.003 for RE and LE respec-tively)for the latency measured in response todifferent stimuli,withthelowerlatencyfoundfortoneburstandthe higherlatencyfortheBA/DIstimulus.
RegardingtheP3component,therewasasignificant dif-ference(p-value0.005and0.002forREandLE,respectively) betweentheusedstimuliandobservedlatency.Thelowest latencywasfoundwithtoneburstandthehighestlatency withtheBA/GAstimulus.
Therewas nostatistically significant differenceamong thedifferentstimulifortheamplitudeinP3.
Asfortheinformationregardinglatencyvaluesof com-ponentsP1,N1,P2,N2andP3,forthefourdifferentstimuli, they were classified in the presence and absence of this information.
Regardlessofthestimulusused,therewerecomponents withnostatisticaldifferencesbetweenthem;Table2shows datafortheabsoluteandrelativedistributions.
Discussion
Despite the hemispheric differentiation and undeniable inequality in functional importance of the cerebral hemispheres, therewerenodifferencesbetween the per-formance of the right and leftears in the present study. Other studies have reported the absence of differences betweenears,10---12sothediscussionwillfocusonthe com-parisonbetween speechstimuliand tone burst,regarding thelatencyofexogenouscomponents,andthelatencyand amplitudeoftheendogenouscomponentP3.
This findingcorroboratesthestudy10 thatreportedthat the stimulus used did not evoke any difference for the latency of components N1 and P2, but did influence the latencyofcomponentsN2andP3.Thisfactwasexpected, astheP3componentis acognitivepotentialthat is influ-enced by the stimulus and, therefore, these data are consistent withwhat has been previously reported in the literature.11,13,14
Regarding the comparison of speech and tone burst stimuli,thedifferencebetweenthemwasexpected, consid-ering that the central activations are different for each stimulus, which corroborates the authors10 who reported that the type of stimulus used is an important variable in obtaining the N2 and P3 components. Verbal stimuli constitute a more difficult listening task when compared to non-verbal stimulus discrimination. Some authors15,16 observedthattheP3latencyincreaseswhenthe‘‘targets’’ fordiscriminationaremore‘‘difficult’’thanthestandard, i.e.,latencyissensitivetothetaskprocessingdemand.
This study showed thatthe speechstimulus influenced the N2 component, which has been observed by other authors,17 who mentioned that the N2 component regis-tration appears to be related to the identification and attention processing of the rare stimulus, with a posi-tive correlation between the value of itslatency and the levelofdifficultyofthediscriminationtask.Inonestudy10 the same fact was observed, where N2 was influenced by the speech stimuli and, in that study, the difference betweenstimuliwasobservedbetweenvowelandconsonant contrasts.
Asfor theamplitude,nodifferencewasobservedwhen comparingthestimuli.7,11,13,14,18 Somestudiesdescribethe reductioninamplitudeofcomponentP3withtheincreased level of difficulty of the discrimination task. However, this correlation was not significant in the present study, which corroborates the findings of another study.10 The amplitude of potential P3 has been described as hav-ing greatvariabilityin the literature,19---21 and the normal range for the P300 amplitude is between 1.7V and 19.0V.
Inthisstudy,itwaspossibletoobtaintherecordsofthe cortical and cognitive auditory evokedpotentials P3with speech stimulus with good producibility and morphology, demonstratingthisisaviableproceduretobeappliedin clin-icalpractice.Thisinformationwasalsoreportedbyanother author.1 All assessedcomponents wereobserved with the fourdifferentstimuliin thisstudy(Table2),showing that for young adults,themorphological characteristics of the waves,aswellasthepresenceofcomponentsdonotdepend onthetypeofstimulustobeelicited.
Nevertheless, it is known that the cognitive auditory evokedpotential P3generatedby speechstimulican also beusedtoprovideinformationonspeechsignalprocessing, whichaccordingtotheauthor11helpstoidentifychangesin detectionordiscrimination---informationthatcanguidean individual’stherapeuticrehabilitation.
The BA/GA stimulus brings more difficulty in syllable discrimination due to its proximity, when compared, for instance, to BA/DI syllables. Thus, this study makes an importantcontribution totheclinical andresearch areas, helpingtheprofessionalchoosethemostappropriate stim-ulusforthesubjecttobeassessed.
Conclusion
There was a difference in latency of N2 and P3 poten-tialsbetweenthestimuliused;however,nodifferencewas observedfortheP3amplitude.
Conflicts
of
interest
Theauthorsdeclarenoconflictsofinterest.
References
1.DuarteJL,AlvarengaKF,BanharaMR,MelloADP,SásRM,Filho OAC. Potencial evocado auditivo de longa latência-P300 em indivíduosnormais:valordoregistrosimultâneoemFzeCz. BrazJOtorhinolaryngol.2009;75:231---6.
2.GroenenPAP,BeynonAJ,SnikAFM,VanBP.Speech-evoked corti-calpotentialsandspeechrecognitionincochlearimplantusers. ScandAudiol.2001;30:31---40.
3.KorczakPA,KurtzbergD,StapellsDR.Effectsofsensorineural hearinglossandpersonalhearingaidsoncorticalevent-related potentialandbehavioralmeasuresofspeech-soundprocessing. EarHear.2005;26:165---85.
4.SamsonF,ZeffiroTA,ToussaintA,BelinP.Stimuluscomplexity and categoricaleffectsin humanauditorycortex:an activa-tionlikelihoodestimationmeta-analysis.FrontPsychol.2010;1: 241.
5.UppenkampS,JohnsrudeIS,NorrisD,Marslen-WilsonW, Patter-sonRD.Locatingtheinitialstagesofspeech-soundprocessing inhumantemporalcortex.Neuroimage.2006;31:1---4. 6.KrausN,NicolT.Aggregateneuralresponsestospeechsounds
in the central auditory system. Speech Commun. 2003;41: 35---47.
7.Martin BA, Tremblay KL, Korczak P. Speech evoked poten-tials: from the laboratoryto the clinic. Ear Hear. 2008;29: 285---93.
8.LloydKII,Momenshon-SantosTM,RussoICP,Brunetto-Borgianni LM.Interpretac¸ãodosresultadosdaavaliac¸ãoaudiológica.In: Momenshon-SantosTM,RussoICP,editors.Práticadaaudiologia clínica.SãoPaulo:Cortez;2007.p.215---32.
9.HallJWIII,ChandlerD.Timpanometrianaaudiologiaclínica.In: KatzJ,editor.Tratadodeaudiologiaclínica.SãoPaulo:Manole; 1999.p.281---97.
10.AlvarengaKF, Vicente LC,Lopes RCF, SilvaRA, Banhara MR, Lopes AC,et al. Theinfluence ofspeech stimuli contrastin corticalauditoryevoked potentials.Braz JOtorhinolaryngol. 2013;79:336.
11.MassaCG,RabeloCM,MatasCG,SchochatE,SamelliAG.P300 withverbalandnonverbalstimuliinnormalhearingadults.Braz JOtorhinolaryngol.2011;77:686---90.
12.VenturaLMP,AlvarengaKF,FilhoOAC.Protocoloparacaptac¸ão dos potenciais evocados auditivos de longa latência. Braz J Otorhinolaryngol.2009;75:879---83.
13.BennettKO, BillingsCJ,MolisMR,LeekMR.Neuralencoding andperceptionofspeechsignalsininformationalmasking.Ear Hear.2012;33:231---8.
14.Tampas JW, Harkrider AW, Hedrick MS. Neurophysiological indicesofspeechandnonspeechstimulusprocessing.J.Speech LangHearRes.2005;48:1147---64.
15.LindenDE.TheP300:whereinthebrainisitproducedandwhat doesittellus?Neuroscientist.2005;11:563---76.
16.PolichJ.UpdatingP300:anintegrativetheoryofP3aandP3b. ClinNeurophysiol.2007;118:2128---48.
discrimination task. Electroencephalogr Clin Neurophysiol. 1990;75:255---75.
18.Geal-Dor M, Kamenir Y, Babkoff H. Event related poten-tials (ERPs) and behavioral responses: comparison of tonal stimuli to speech stimuli in phonological and semantic tasks. J Basic Clin Physiol Pharmacol. 2005;16: 139---55.
19.KrausN,McGeeT. Potenciaisauditivosdelongalatência.In: KatzJ,editor.Tratadodeaudiologiaclínica.SãoPaulo:Manole; 1999.p.403---20.
20.McPherson DL. Late potentials of the auditory system. San Diego:SingularPublishingGroup;1996.