TÍTULO
Nome completo do Candidato
Subtítulo
TÍTULO / TITLE
Nome completo do Candidato / Candidate full name
Subtítulo / Subtitle
Dissertação / Trabalho de Projeto / Relatório de Estágio
apresentada(o) como requisito parcial para obtenção
do grau de Mestre em Estatística e Gestão de Informação
Dissertation / Project Work / Internship report presented as partial requirement for obtaining the Master’s degree in Statistics and Information Management
TÍTULO
Nome completo do Candidato
Subtítulo
Dissertação / Trabalho de Projeto / Relatório de
Estágio apresentada(o) como requisito parcial para
obtenção do grau de Mestre em Estatística e Gestão
de Informação
Studying the impact of co-authorship with external researchers:
the case of an Enterprise Information Portal research
community in Portugal using Social Network Analysis
Ana Sofia Gonçalves Ferreira
Trabalho de Projeto apresentado como requisito parcial
para obtenção do grau de Mestre em Estatística e Gestão
de Informação
Dissertation / Project Work / Internship report presented as partial requirement for obtaining the Master’s degree in Statistics and Information Management
TÍTULO
Nome completo do Candidato
Subtítulo
Dissertação / Trabalho de Projeto / Relatório de Estágio
apresentada(o) como requisito parcial para obtenção do
grau de Mestre em Gestão de Informação
Ana Sofia Gonçalves Ferreira
Project Work/Scientific Article presented as partial
requirement for obtaining the Master’s degree in
Information Management
ii
Instituto Superior de Estatística e Gestão de Informação Universidade Nova de Lisboa
STUDYING THE IMPACT OF CO-‐AUTHORSHIP WITH EXTERNAL
RESEARCHERS: THE CASE OF A RESEARCH COMMUNITY IN
PORTUGAL USING SOCIAL NETWORK ANALYSIS
por
Ana Sofia Gonçalves Ferreira
Project Work/Scientific Article presented as partial requirement for obtaining the Master’s degree in Information Management
Orientador: Prof. Dr. Miguel de Castro Neto
iii
ACKNOWLEDGMENTS
To carry out this article, several individuals helped me directly or indirectly, who deserve my thanks and gratitude.
To my supervisor Prof. Miguel de Castro Neto for the dedication, willingness and commitment he showed in the whole work development process, as well as any comments and suggestions noted, thank you.
I would like to leave a word to Institute of Telecommunications for kindly providing the data.
I also thank to all the teachers of the Instituto de Estatística e Gestão de Informação, both at the stage of preliminary definition of the project, highlighting in this aspect Prof. Ana Maria Ramalho Correia, and in the design and research theme / thesis.
Finally, I thank to my family and friends, for all understanding, unconditional support and motivation to complete this project.
v
PREAMBLE
Fundamental developments in information technology (IT) and especially the enormous growth of the Internet are essential drivers for the increasing global interconnectedness of companies and individuals. (Landherr 2010).
The use of powerful IT in this process significantly facilitates the interaction of actors at different locations and information exchange in real time. In this context, services subsumed under the term Web 2.0, such as wikis, blogs, or online social networks in which individuals are connected to each other and share news, experiences, and knowledge, increasingly gain importance (Landherr 2010).
The usage of Web services are a good example since social networks are currently gaining increasing impact especially in the light of the ongoing growth of web-‐based services.
In this context, this article pretends to analyze a researcher’s group behavior over time. All of these researchers are registered in Instituto de Telecomunicações portal. The main idea is to understand how external collaborators establish relations with other permanent researchers and how their behavior can influence the work published by this group of researchers.
This analysis will be described through a “social network analysis”, including the usage of centrality measures (degree, betweenness and closeness). It will be focus on international journals published by this group during 2010.
There has been a vivid interest in scientific collaboration networks in recent years. A growing number of scientists have been focusing in collaboration networks. In particular, co-‐authorship networks have been widely used to examine the patterns of collaborations within an academic community and determine the status and influence of individual researchers (Krichel).
vi
Social Network Analysis is not just a methodology, is the principal tool to examine patterns of collaboration and it is a perspective on how society functions: in this case we will see how a researchers group works. Instead of focusing on individuals and their attributes, or on macroscopic social structures, it centers on relations between individuals, groups or social institutions. This work pretends to analyze how external collaborators influence a specific group of researchers and compare how we can draft a network with or without their presence.
All this analysis it will be done in a journal paper article format since a previous version of this project participated in “CISTI 2011 – 6ª Conferência Ibéria de Sistemas e Tecnologia de Informação” which it was published in “Sistemas e Tecnologias de Informação, Volume I” and this work represents a conclusion of that project.
vii
RESUMO
Actualmente, as actividades desenvolvidas pelos institutos de investigação são financiadas por bolsas ou fundos, que têm possibilitado uma participação temporária de capital humano. Este trabalho pretende utilizar a análise de redes sociais para estudar a presença desse grupo de trabalho num determinado instituto de investigação português – Instituto de Telecomunicações (IT). O estudo será aplicado a dados que listam as participações dos investigadores desse instituto em publicações de artigos científicos a nível internacional e que reportam aos últimos vinte anos de histórico. A base de dados inclui informação proveniente de investigadores permanentes e de força laboral temporária, denominada para este efeito de colaboradores externos. A análise compara a rede social derivada da colaboração entre os vários investigadores e reflete-‐se em dois cenários: uma perspectiva global sobre a rede de investigadores em termos de coesão e uma perspectiva mais detalhada focando o comportamento de cada investigador na rede e a predisposição para estar inserido em subgrupos. A análise de redes sociais irá ajudar-‐nos a compreender como é que poderemos categorizar os vários grupos mediante diferentes cenários tais como localização, produtividade e grupos de trabalho. Este artigo pretende analisar a participação dos colaboradores externos nesta rede social e determinar o seu comportamento com os restantes elementos da rede.
PALAVRAS-‐CHAVE
Análise de Redes Sociais; Co-‐participação; Conhecimento; Produtividade
viii
ABSTRACT
Nowadays research institutions develop a significant amount of their activities financed by research grants and scholarships that sustain a constant human capital flow of temporary research labor. In this work and through the usage of Social Network Analysis we will study the impact of such policies in a Portuguese research institution. This evaluation will be applied to authorship data from papers published in international journals with refereeing covering the last twenty years of research activities involving permanent and temporary researchers from a Portuguese leading research institution in the field of telecommunications -‐ Instituto de Telecomunicações (IT). This study compares the co-‐authorship network and will reflect two main scenarios: a global perspective about this researchers network in terms of cohesion, and a detailed perspective about how the different subgroups are been interacting over time. Social Network Analysis will help us to understand how we can characterize their network behavior grouped by different scenarios as location, productivity and thematic groups. The paper will address the role of temporary researchers in network building and will determine the impact of their presence in this researchers network.
KEYWORDS
ix
x
INDEX
1. Introduction ... 1
2. Literature review ... 3
2.1. Co-‐authorship social network analysis ... 3
3. Methodology ... 8
4. Results ... 11
4.1. Network Evolution ... 11
4.2. SNA Quantitative Measures ... 14
4.3. SNA Centrality Measures ... 15
5. Discussion ... 17
6. Conclusions ... 25
7. Bibliography ... 27
xi
FIGURES INDEX
Figure 1. It scientific output overtime...8
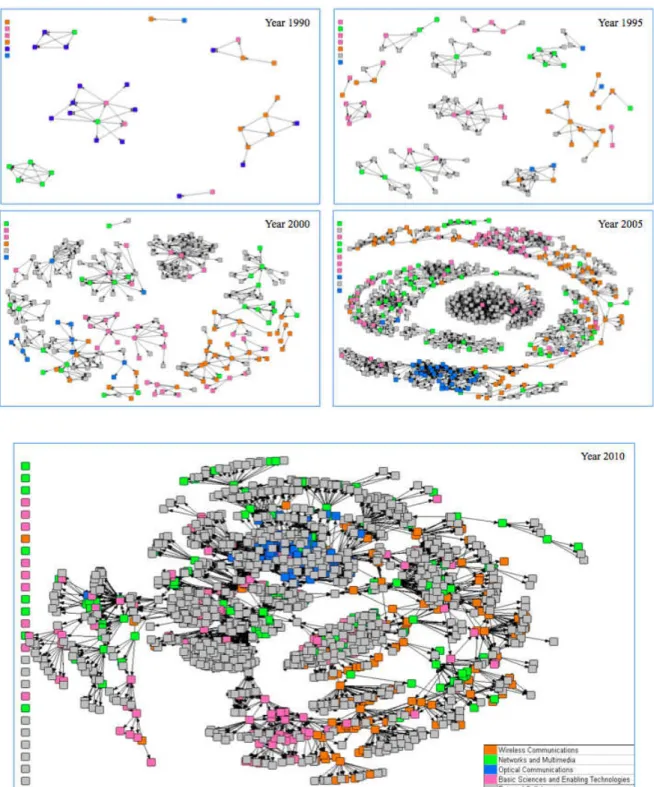
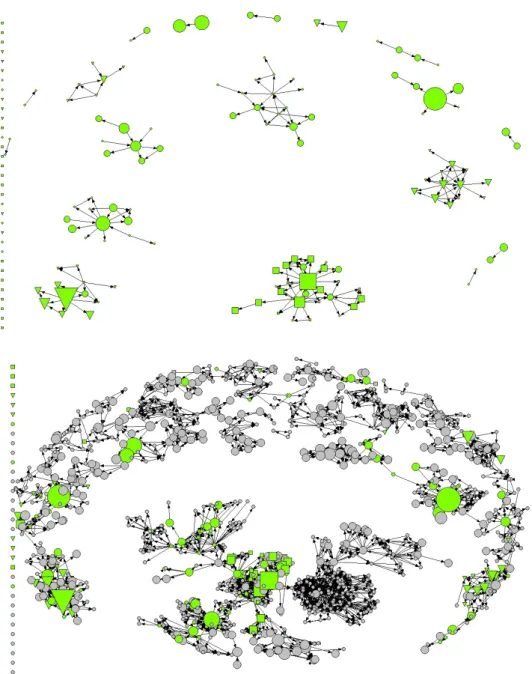
Figure 2. Evolution of the journal papers co-‐authorship social network (1990-‐2010) ...12
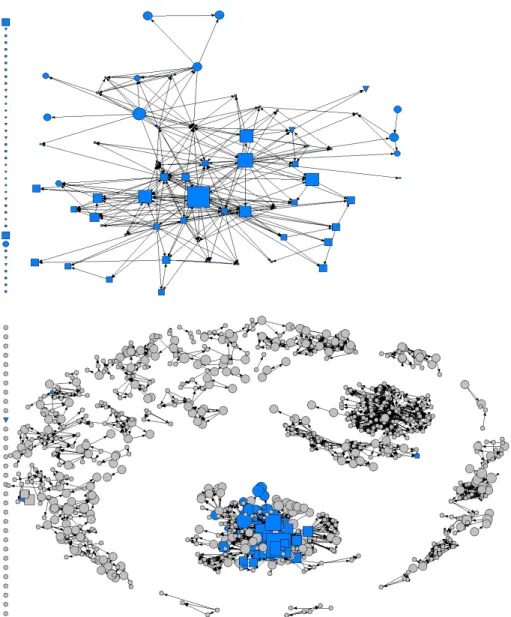
Figure 3. YEar 2010 social network without external collaborators ...13
Fifure 4. Network by research location ...21
figure 5. network and multimedia group with or without external collaborators...22
Figure 6. optical communication group with or without external collaborators ...23
TABLES INDEX
Table 1. Researchers holding a PhD by location………..…..…8Table 2. Quantitative measure with and without external collaborators……….….14
Table 3. 2010 IT Social Network Top Performers by type and centrality measures…18 Table 4. IT Social Network Top Performers by Productivity……….19
xii
ABREVIATIONS
SNA Social Network Analysis
EIP Enterprise Information Portal
IT Instituto de Telecomunicações
1
1.
INTRODUCTION
Social networks are currently gaining increasing impact especially in the light of web-‐based services (Landherr 2010). A number of recent studies have focused in the statistical properties of networked systems such as social networks and the Worldwide Web (Girvan 2002). This development allowed the growth of new ways to share information and support interaction between different people. The distance between people is shorter than in the past. Never like today it is so easy to communicate with another person in the opposite point of the world. Also organizations have access to new platforms and ways to manage data such as Enterprise Information Portals (EIP). EIP systems were pointed out as a technical solution to support organizations in their knowledge management initiatives.
The most modern EIP are supported by data repositories where we can find information not only about the organization and its objectives, but also and more important about the people and the activities they undertake as well as the relations they establish between them along the way (Neto 2010). In this work we will analyze a specific database of researchers from It organization. We would like to study the connections and relationships between researchers from this network and understand: How this group is linked? Who is the researcher with more connections? Has this researcher the biggest number of works published? These types of questions can be analyzed in different ways for different environments. In the present work, the main objective is to analyze a researcher’s co-‐authorship network from a Portuguese research institution. A special attention will be given to the behavior of external collaborators in community building and knowledge management. In summary, it will be presented field research results on evaluating knowledge management and human capital assets based on EIP data repositories using Social Network Analysis (SNA).
As we mentioned, the data used to build the social network was obtained from Instituto de Telecomunicações (IT) EIP backend database. By 31st December 2010, there were 240 papers published in international journals with refereeing involving IT researchers, covering a twenty years period. Based on the knowledge network constructed, we can analyze specific paths through which knowledge sharing occurred and by which knowledge capital was nurtured in this research community.
2
-‐ Study the influence of external collaborators presence in this network;
-‐ Analyze external collaborators in terms of productivity (number of international papers published)
To answer these questions, it will be used SNA. Our analysis will be presented in two perspectives:
-‐ Density analysis/cohesion analysis where two networks are generated: one with permanent researchers plus external collaborators and another considering permanent researchers only;
-‐ Centrality measures analysis where we will consider both networks mentioned above but getting a nodes behavior perspective.
From the first perspective we want to identify network characteristics and understand what results in terms of network cohesion we will have (macro view). In the second perspective, centrality measures will give us the opportunity to understand from a micro perspective: how is the nodes behavior? How do they interact each other and what are the main differences that we can verify including external collaborators in this researchers network.
It members are organized into research groups, with specific scientific backgrounds, covering the whole range of it areas of R&D. The large majority of permanent researchers have a PhD degree. It organization also includes researchers team in a temporary basis such PhD students, MSc students and graduated collaborators. During our analysis temporary researchers will be considered as external collaborators. Two groups are defined: permanent researchers and permanent researchers plus external collaborators.
3
2.
LITERATURE REVIEW
2.1.CO-‐AUTHORSHIP SOCIAL NETWORK ANALYSIS
Sociometric measurement started with things like this: how much “time” does an actor A spends with another actor B? He may spend half as much time with another actor C and three times as much time with another actor D. Or, what is the “spatial distance”(a) between actors A, B, C and D in the course of the same situation and what effect have nearness or distance upon behavior and acting? Or, how frequently do two actors appear simultaneously in a scene and how frequently do they exit together? (Linton 2004) These are some questions made by Jacob Levy Moreno in 1953 (Linton 2004). Since that time, authors like Jacob L. Moreno and Harrison C. White searched theories about groups that worked together (Linton 2004). That was the birth of SNA.
SNA can be defined as the study of social groups as networks of nodes connected by social ties. A network models a system composed of individual components (nodes) and their connections (ties). The shortest number of ties between two nodes is the path length between that pair. “Group” means the network as a whole, or the collection of potentially interacting individuals that are distinguished from other such collections of individuals; the term “node” interchangeably with “individual”, and “tie” with relationship (Wey 2008).
SNA gained importance over the years and today is analyzed in different perspectives. In fact, by getting results across networks, SNA can also be a good tool to use by companies.
Social Network Analysis (SNA) has been employed in different fields of management, and many investigations have concentrated on gaining a better understanding of innovative results by studying relations between individual and organizational actors (Casanueva 2010).
Social networks have been used to identify strengths and weaknesses within and among research institutions, businesses, and nations as well as to direct scientific development and funding policies (Abbasi 2011).
________
(a)“spatial distance”: Let us consider two space–time points (events) which can be connected by a time–like line. What is the distance between them? The most common answer is as follows: connect these points by a time–like geodesic; the natural length of this geodetic segment gives the desired temporal distance.
4
SNA can provide information on the structure of relationships networks and the position of individuals in these networks, and the development of these aspects over time (Van Der Valk 2010). This can help institutions discover who the main actors in a network are and this type of information can be decisive in new projects. Firms will only participate in these networks, if they expect to learn from other network members (complementarity) and if the transfer of knowledge is bi-‐ or multilateral (Canter 2006).
This paper will focus on a research community that published work in international journal with refereeing. In that way, the group will be considered the researchers’ network as a whole, nodes will be each researcher and ties will describe interactions between them trough co-‐authorship.
The interest in the nature and scale of scientific collaboration, including co-‐ authorship, is growing, especially in the way that knowledge creation and sharing processes unfold. One of the possible approaches to assess scientific collaboration is based on the assumption that co-‐authorship creates a social network of researchers that develops over time. Mapping the network of co-‐authorship, using SNA, it is possible to infer the structure of the collaboration that is taking place between the network members (Monteiro 2009).
Co-‐authorship provides a clear indication that joint research is now regarded as providing important opportunities for the exchange of tacit knowledge which can serve as an important means of resolving many of the disputes relating to priority (Choo 2010). Co-‐authorship undoubtedly represents one of the major forms of intellectual cooperation (Evans 2011) and SNA can help us to understand how a specific network works, studying their nodes and discovering trend behaviors between them.
Due to the necessity to keep pace with scientific progress not only at the level of individual researchers but also at the level of countries, most governments are interested in enhancing the level of international collaborations (Abbasi 2011). Since social networks may span disciplinary, organization, as national boundaries, social networks can influence collaborations in multiple ways (Abbasi 2011).
5
a sharp increase in the number of collaborations between scholars (Abbasi 2011). Co-‐ authorship in publications is widely considered as a reliable proxy for scientific publication (Franceschet 2010).
The focus in many journals is now on collaboration and co-‐authorship, both of which are currently on an upward trend (Choo 2010). As a consequence of this trend, there has been increasing academic interest in the phenomenon of collaboration among scientists (Acedo 2006).
We can see that, by jointly publishing papers, researchers show their knowledge sharing activities, which are an indication for knowledge creation (Abbasi 2011). And how this can affect institutions? The reputation of research organizations indirectly affects the society’s welfare, since a high reputation attracts purchases, foreign investments, and highly qualified students from around the world (Abbasi 2011). Like this we can say that collaboration is responsible for the creation of knowledge, which will be represented in new publications, mainly of them journal papers published. In fact, studies show that the total number of publications for US scientists is positively associated with the total number of collaborations (Abbasi 2011).
Going further into the collaboration trend, it was possible to realize that different researcher groups have different behaviors. First, studies show that there is the tendency of scientists to select collaborations within rather than across institutional boundaries. (Evans 2011) This means a geographic constrain. When collaborations span different institutions, they are more likely to involve scientists that are geographically co-‐located than dispersed. Scientists may be more likely to select collaborators with whom they share the same institutional affiliation than others from different institutions. Intra-‐institutional collaborations may be induced by the tendency of scientists to collaborate with others that are geographically co-‐located (Evans 2011).
6
projects and scholarships in biomedical fields, whilst some studies suggest, that ‘soft’ social sciences, applied research and humanities, in particular, generally have lower rates of collaborative scholarships (Choo 2010).
Another important aspect related with “networking” concept is related with knowledge. If we have more connections among researchers maybe we will bring more productivity but this will mean that we will have more knowledge? Knowledge does not exist statically, but emerges only within a context through interactions and evolution. The scientific knowledge is dynamic; it is in constant evolution, like the knowledge itself (Lee 2010). So, if we have more connections between actors, it will be easier to disseminate information and even knowledge inside the group. Collaboration is a fundamental and common feature in scientific research (Franceschet 2010).
Researchers can derive scientific advantages by sharing knowledge, expertise and techniques, jointly controlling the accuracy and the significance of results, restricting isolation and giving substance to the cross-‐fertilization of ideas.
In academic environments, publication brings precognition and promotion for both academics and their institutions (Maritz 2010). The production of new knowledge is easily identified with the individual or group of individuals that generate it. Published research results represent documented new knowledge (Casanueva 2010).
Then, it’s important to understand how the network size and structure can influence the productivity. We will investigate if we can have different network environments with or without specific groups on our network. How a node with more connections can be differentiated from another one with fewer connections? If there are few steps between actors in the network then it should be possible to transmit knowledge quickly to where it can be most valuable.
Also, searching for novel solutions to problems should be relatively easier compared to the situation where many search steps are required to find an answer (Kastelle 2010). So, as less distance we have between a random node A and another random node B, the faster and easier will be to share information.
7
access to scientific funding, to expensive (possibly large-‐scale) equipment, and to unique scientific data (Franceschet 2010) .
8
3.
METHODOLOGY
IT (Instituto de Telecomunicações) is a private and not-‐for-‐profit organization with the mission of creating and disseminating scientific knowledge in the field of telecommunications. IT scientific expertise, from which follow its main research and education activities, spans through the following wide areas: Wireless Communications; Network and Multimedia; Optical Communications; and Basic Sciences and Enabling Technologies. IT is spatially organized around three sites in Portugal: Aveiro, Coimbra, and Lisbon.
Aveiro Coimbra Lisbon
Permanent researchers holding a PdD 59 21 104
Other Collaborators 100 26 106
Table 1: Researchers holding a PdD by location
Resulting from research activities IT presents different publications types: Books (Fully authored books, Editor Books, and book chapter contributions), Journals (Papers in International refereed journals), Conferences (Communications in International and National refereed conferences, MSc (Concluded MSc Theses), and PhD (Concluded PhD Theses). The present paper will focus only on journal papers publication.
Figure 1. IT Scientific Output over time
Advanced laboratory facilities are available in most scientific areas to support applied research, which is carried in the framework of national and international projects in cooperation with similar research institutions worldwide. The high level of scientific research is confirmed by a solid number of peer reviewed international publications.
0 200 400 600 800
1994 1996 1998 2000 2002 2004 2006 2008 2010
Books
Journals
Conferences
MSc Theses
9
From a management perspective it was considered essential to develop an information system that supported IT activities and with that purpose an EIP was launched in order to record all the activities undertaken and support both an internal and public information portal.
All the data registered in this IT EIP backend database concerning IT human resources and their R&D activities includes information about co-‐authorship in the case of publications or team membership in the case of projects or patents. This information could play an important role in terms of supporting a knowledge management initiative since with a SNA approach we can bring to surface valuable information about how the research community evolves over time. This analysis could identify if the researchers work together bridging the scientific areas boundaries, what is the impact of physical distance on collaboration, etc.
This paper will focus on journal papers publications development. As is possible to analyze in the previous figure, IT showed an increase in the number of work published. During the last 15 years, the number of paper journals had a significant development.
In the present work we analyzed only part of the IT EIP available data. In fact the analysis carried out is performed only on the data concerning papers published in international journals with refereeing over the last twenty years (from 1 January 1990 until 31 December 2010, although IT was only created in 1992). Through the “author(s)” data on journals papers it was possible to ascertain and quantify the co-‐ authorship relationships and their unit(s), making it possible to build the relationship matrix for the SNA approach described above.
The data concerning these journals papers and the related authorship information necessary to support the SNA was pre-‐processed in order to produce information on December 31 in five different moments: year 1990; year 1995; year 2000; year 2005; and year 2010. It must be noted that the data is cumulative, e.g., year 2005 includes all the information since 1 January 1990 through 31 December 2005.
This data set supported the construction of five social networks where the nodes were the IT researchers in the different moments and included identification data, scientific research area, site location, and number of journal papers authorship. The ties represented the co-‐authorship relationships with the tie strength representing the number of co-‐authorship for two given connected nodes.
10
considering as nodes only the permanent researchers (excluding external collaborators considered as PhD students, MSc students and graduated collaborators).
For data analysis and presentation was used Netdraw a free social network analysis software.
11
4.
RESULTS
The results will be presented grouped in network evolution; social network analysis quantitative measures; and social network analysis centrality measures.
4.1.NETWORK EVOLUTION
Looking at Figure 2, it is possible to see the network evolution and for 2010 it was made a comparison between two networks (with and without external collaborators). As we can see from the network evolution in figure 2, over the past 20 years the collaboration between authors had a significant increase. During that time, it is important to mention the presence of external collaborators. The results showed subnetworks that had a huge development after Year 2000 and the majority has just one element from IT Research who is linked with many external collaborators. During Year 2005 and Year 2010, these subnetworks increased more and more and in 2010 the network map shows a complex network where external collaborators are completely connected with all the permanent researchers, from all scientific areas. And in many cases, they play an important network role because those nodes are responsible of maintaining the entire network connected.
12
Figure 2. Evolution of the journal papers co-‐authorship social network (1990 until 2010).
13
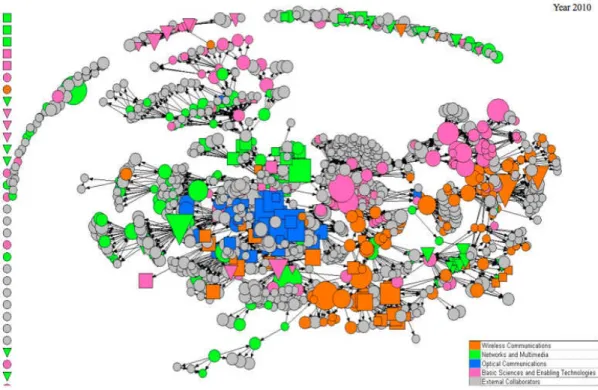
In the present work we are particularly interested in understanding the impact of the different types of researcher’s labor relationship with IT in the social capital built over type through the usage of social network analysis (permanent versus external collaborators). In that sense we will focus with more detail in the most recent information year available: year 2010 and will consider external collaborators as a research group in order to understand their impact.
Figure 3. Year 2010 social network without External collaborators.
As it is possible to see in Year 2010 without external collaborators, the co-‐ authorship network presented several nodes without any connection comparing in Year 2010 with external collaborators. So, we can say that without considering these researchers, the network presents many researchers who apparently do not have any connection and it was supposed that they were working alone. But with this new vision, we can affirm that they are working together and external collaborators are acting like intermediaries between researchers from distinct scientific areas. In other situations, scientific researchers are working only with external collaborators.
14
4.2.SNA QUANTITATIVE MEASURES
The objective is to have a global picture between ‘2010 network with external collaborators group’ and ‘2010 network without external collaborators group’. In this case each network will be considerate as a different one. We would like to understand what the network with more connections is and how collaborative each one is?
Network Density: The density of a network is the total number of actual connections between members divided by the number of possible connections (John Scott 2005). This metric retrieves values between 0 and 1. Higher density indicates a greater degree of interaction among the members. In this case we will compare density value between two groups: one including external collaborators and another one excluding external collaborators. The objective is to understand how external collaborators can influence the network density.
Clustering Coefficient: is the likelihood that any 2 nodes that are connected to the same node are connected themselves (the tendency of the network to aggregate subgroups) (John Scott 2005). This measure shows how one group can be more/less collaborative against another. The overall clustering coefficient is the mean of the clustering coefficient of all the actors.
Through SNA Quantitative Measures, it was possible to calculate different metrics for our network.
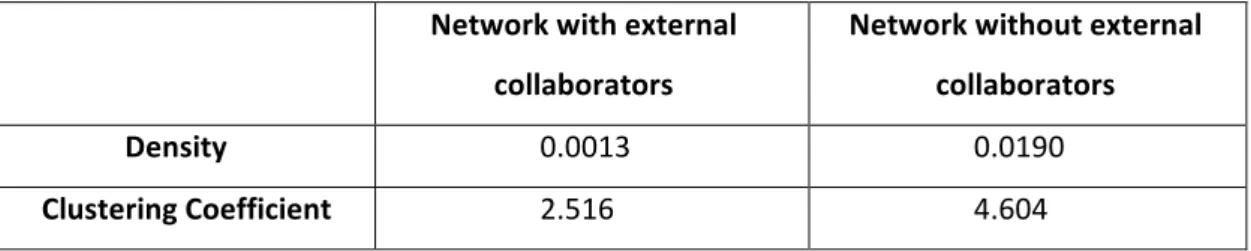
Table 2: Quantitative measure with and without External Collaborators
Network with external
collaborators
Network without external
collaborators
Density 0.0013 0.0190
15
4.3.SNA CENTRALITY MEASURES
It is well known that a wide variety of social network analysis specific measures have been proposed in the literature dating back at least to the 1950s with the work of Katz (Katz 1953). Freeman (Freeman 1979) imposed order on some of this work in a seminal paper that categorized centrality measures into three basic categories – degree, closeness and betweeness.
In the present work we will analyze the network centrality measures for Year 2010 (with/without external collaborators). The main objective is to improve insight knowledge about network nodes. For this study three different perspectives of centrality measures will be investigated: closeness, centrality and betweenness.
Degree Centrality: measures the number of direct connections a node has.
𝐶
! 𝑝! = 𝑎(𝑝!
!
!!!
,𝑝!)
Where a p!,p! =1if and only if p!and p!are connected by a line otherwise 0 Betweenness Centrality: the number of shortest paths that pass through a
node divided by all shortest paths in the network and shows which nodes are more likely to be in communication paths between other nodes.
To determine the overall centrality of a point p!, we sum its partial betweenness values for all unordered pairs of points where i≠j≠k:
C
! p! = b!"
!
!! !
!
(p!)
Freeman (1977) (Carrington 2005) proved that the maximum value taken by
C
! p! achieved only by ithe central point in a star. It is:
n! −3n+2
2
16
C!
! p! = 2C
!(p!) n! −3n+2
Betweenness is useful as an index of the potential of a point for control of communication (Freeman 1979).
Closeness Centrality: The mean length of all shortest paths from a node to all other nodes in the network (i.e. how many hops on average it takes to reach every other node). It is a measure of reach, i.e. how long it will take to reach other nodes from a given starting node. It is useful in cases where speed of information dissemination is a main concern.
The independence of a point is determined by its closeness to all other points in the graph.
As Freeman (1978) showed, we can determine that
C!! p! = n−1
d(p !,p!) !
!!!
With closeness perspective, we assume that the central position in a network would spread throughout the entire network in minimum time.
17
5.
DISCUSSION
Results show a higher density value for the network without external collaborators. We have more nodes in the network but the number of ties is not bigger in the same proportion. We can infer that permanent researchers group is more cohesive comparing with external collaborators group. Although this fact, previous studies showed how external collaborators can work as intermediaries between scientific areas. In fact, scientific areas having more collaboration with external collaborators demonstrated a bigger number of published works. We can realize the presence of subgroups inside our network. In these subgroups, some of them have more or less collaboration with these external researchers. It’s an important step to analyze on this current paper how this presence occurs.
Regarding clustering coefficient, the results present a higher value for the network without external collaborators. Taking in consideration the same conclusion verified in density measure, from a global perspective, permanent researchers subgroup are more collaborative comparing with external collaborators.
So, what is the impact of external collaborators from this point of view? Through Figure 2 and 3 we can see the network evolution and we can realize how different the network is when we include external collaborators. It is true that density degree is higher without this group of Researchers, but network increases a lot when we add these Researchers to the graph. Behind this value, the network can hide different possibilities: if these external collaborators work only with a specific group of Permanent Researchers, or if these Researchers only published one work and do not interact directly with the entire group. At the end if we simply analyze the group from a global picture, we will just understand that number of interactions doesn’t increase in the same proportion when adding the number of external collaborators.
18
To verify how our network with external collaborators can be compared with the same network without external collaborators, it was calculated centrality measures for all the available data.
So, based on the social network of co-‐authorship relationships constructed it was possible to calculate the metrics referred in the previous section for the last year of available data (2010).
Degree Betweenness Closeness
ID Value Type ID Value Type ID Value Type
192 110 P 11 308888 P 1640 7965324 E
97 109 P 316 191009 P 1641 7965324 E
316 91 P 418 158472 E 1838 7965324 E
37 79 P 95 155488 P 1430 7965078 E
325 68 P 192 145255 P 3099 7964051 E
95 67 P 350 137294 E 3100 7964051 E
11 63 P 158 132784 P 1674 7964051 E
388 63 P 355 125991 E 583 7964048 E
421 59 E 97 125594 P 558 7963801 P
111 48 P 160 113193 P 871 7963800 P
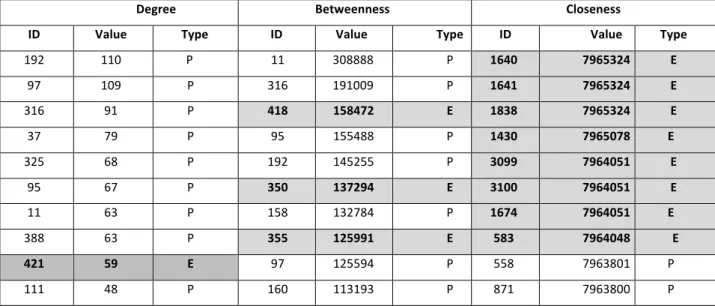
Table 3: 2010 IT Social Network Top Performers by type and centrality measures where P means “permanent researcher” and E means “external collaborator”. Note: Bold and grey
color highlights the presence of external collaborators.
Regarding centrality degree, top 10 performers are almost composed by permanent researchers (9) against 1 external collaborator only. With this metric we can see that permanent researchers are connected to more nodes comparing with external collaborators. Only one node (Node ID 421) is on Top 10 Degree.
19
colleagues. In that way, we can see that although external collaborators have a smaller number of connections between other nodes, they have more presence in betweenness measure which means they are a potential point for control of communications.
The third measure studied, closeness, has a completely different result comparing with others. Here we can see that external collaborators have a presence of 80% in top 10 performers. In this case, we are looking for the Researchers who are closer to another specific Researcher, comparing with all other Researchers in the network. These authors need less time for communicating will all other network members.
Now, if we compare our information by productivity, which means, the number of paper-‐journals produced by each researcher, we will see that all are permanent researchers”
Productivity
ID Nr Papers
2010 Type ID
Nr Papers
until 2010 Type
388 12 P 95 75 P
4 10 P 32 74 P
316 10 P 316 73 P
54 9 P 325 66 P
221 9 P 4 63 P
325 9 P 97 57 P
118 9 P 144 55 P
68 9 P 192 51 P
97 8 P 68 49 P
2537 8 P 111 49 P
Table 4: IT Social Network Top Performers by Productivity where “P” means “permanent researchers”
20
From this table we can conclude that 50% of the Researchers are present in both top productivity results: 2010 and aggregated information since the beginning.
Comparing with our centrality measures results, node 111 appears in “top 10 Productivity” and “top 10 Degree Measure”. This node has a big number of papers produced and has a big number of nodes connected to him. More connections represent, in this case, more co-‐authorship that will be converted in a bigger number of works published/ more productivity.
Looking at the different research groups’ scientific areas, we verified that Optical Communications is the group with the biggest value in centrality degree. It means that these researchers have the highest number of direct links with other network members. It is interesting to realize that this group has a distinctive behavior comparing with other groups: he only has few connections with nodes from other different groups and three members of this group have presence on top 10 productivity board (ID 388, 316 and 325).
Considering Year 2010 betweenness centrality measure we can refer that Researchers come from different groups, so we cannot find a specific group with more presence here.
In the case of closeness measure, top 10 Table shows many results for external collaborators but regarding the two permanent researchers, they come from “Basic Sciences and Enabling Technologies” group.
21
Figure 4. Network by research location
22
Figure 5. Network and Multimedia group with or without external collaborators (grey
nodes indicate external collaborators). Node size shows productiviy. Node shape indicates
23
Figure 6. Optical Communication group with or without external collaborators (grey
nodes indicate external collaborators). Node size shows productiviy. Node shape indicates
researcher location (IT Aveiro: square, IT Coimbra: down triangle. IT Lisbon: circle)
Going deeper in terms of productivity, Optical Communication is the group with more work published. Figure 6 shows how this group is connected. It is interesting to see that they are mainly connected each other in a whole group and with a specific group of external collaborators and they are mainly from IT Aveiro.
24
As we can see and as expected, in any of the different analysis, the most productive researchers do not come from external collaborators group. This result shows that staff who do not represent permanent research, do not produce so many international papers. But, looking to the example from Figure 6, we can see a large network of external collaborators linked to this researchers group.
25
6.
CONCLUSIONS
In this paper it was analyzed network data concerning co-‐authorship research results from IT EIP backend database through SNA with the purpose of understanding if this co-‐authorship work generates a network and what is the impact of external researchers on the community social capital building.
The results obtained showed that several diferences including/excluding external collaborators to researchers’ network structure over time. In fact, including this group the network gained consistency and turned much bigger than before.
Previous studies already suggested how this external researchers group has an interesting behavior in this network. Adding density measures helped to understand our main goal and complete our study.
It is really interesting to realize that in the beginning of this study, if we only take in count the global measure of density, we would say that external collaborators do not interact/do not have many interactions comparing the network without external collaborators. But, going further we could understand that the network size increases and external collaborators group gains a strong presence.
Another interesting aspect resulting from the performed SNA is the fact that external collaborators formed subgroups inside the network and worked especially with “Basic Sciences and Enabling Technologies” and “Optical Communications” scientific areas and these nodes have more connections and a bigger number of works published.
External collaborators group does not appear as the most productive one, but it appears in the top performers in terms of betweeness centrality measure and closeness centrality measure. This means that they are acting like brokers inside the network and they have a central position, one that is not dependent upon others as intermediaries.
Based on our analysis, we can say that:
-‐ External collaborators group members aren’t the most productive ones
-‐ The network with this group included has less density (many researchers are working in small groups/the network is much bigger than without them)
26
In summary, the present work demonstrated the benefits from using SNA to have a better understanding of the role-‐played by external researchers in community building over time and the impact they have on co-‐authorship relationships which translate knowledge creation and sharing benefits.
In future analysis special attention will be given to other types of research activities, such as books, conference papers, patents, projects, etc. since this analysis was only focused on international journal paper and it will be very interesting to continue this study through the rest of the data available in IT EIP backend.
As we demonstrated, the structural characteristics measured through the centrality metrics presented depend on the inclusion/exclusion of external collaborators. Nevertheless it is important to analyze the remaining data to answer some questions: Do we have the same network structure for another data types? Or, as we can see by this study, it will it be generated another completely different network? It is relevant to mention that in general, permanent researchers have more journal paper publications. Although this fact, if we consider other type of work, such has MSc or PhD thesis, maybe we can have a different perspective, where external collaborators will demonstrate the most relevant behavior. These are some questions that can be answered after further studies.
27
7.
BIBLIOGRAPHY
Abbasi, A. A., Jorn; Hossain, Liaquat (2011). "Identifying the effects of co-‐authorship networks performance of scholars: A correlation and regression analysis of performance measures and social network analysis measures." Journal of Informetrics: 594-‐607.
Abbasi, A. A., Jorn; Hossain, Liaquat; Shahadat, Udin; Rasmussen, Kim J.R. (2011). "Evolutionary dynamics of scientific collaboration networks: multi-‐levels and cross-‐ time analysis." Scientometrics 89: 687-‐710.
Acedo, F. J. B., Carmen; Casanueva, Cristóbal; Galán, José Luis (2006). "Co-‐authorship in Management and Organizational Studies: An empirical and network analysis." Journal of Management Studies 43.
Canter, U. G., Holger (2006). "The network of innovators in Jena: An application of social network Analysis." Elsevier Research Policy 35: 463-‐480.
Carrington, P. J. S., John; Wasserman, Stanley (2005). "Models and Methods in Social Network Analysis." Structural Analysis in the Social Sciences.
Casanueva, C. G., Ángeles (2010). "Social capital and individual innovativeness in universtiy research networks." Innovation: mangament, policy and practice 12: 105-‐ 117.
Choo, C. C. H., Wen Ming; Liu, Meng-‐Chun (2010). "Improvements in productivity based on co-‐authorship: a case study of published articles in China." Scientometrics 85: 463-‐470.
Evans, T. S. L., R.; Panzarasa, P. (2011). "Community structure and patterns of scientifc collaboration in Business and Management." Scientometrics 89: 381-‐396.
Franceschet, M. C., Antonio (2010). "The effect of scholar collaboration on impact and quality of academic papers." Journal of Informetrics: 540-‐553.
Freeman, L. C. (1979). "Centrality in social networks: conceptual clarification." Social Networks 1: 215-‐239.
Girvan, M. N., M.E. (2002). "Community structure in social and biological networks." Proceedings of the National Academy of Sciences of the United States of America 99: