CHARACTERIZATION OF THE MAJOR AUTOLYSIN IN
STAPHYLOCOCCUS AUREUS
JOANA FILIPA GOMES DA SILVA
DISSERTATION PRESENTED TO OBTAIN A MASTER DEGREE IN
MEDICAL MICROBIOLOGY
CHARACTERIZATION OF THE MAJOR AUTOLYSIN IN
STAPHYLOCOCCUS AUREUS
JOANA FILIPA GOMES DA SILVA
DISSERTATION PRESENTED TO OBTAIN A MASTER DEGREE IN
MEDICAL MICROBIOLOGY
Supervisor: Dr. Rita Sobral, UCIBIO-FCT/UNL
Co-supervisor: Prof. Ana Madalena Ludovice, DCV-FCT/UNL;
ITQB/UNL
iii
Bibliographic elements resulting from this dissertation
Silva, J., I. Grilo, A. M. Ludovice, H. de Lencastre, R. G. Sobral. Characterization of
the major peptidoglycan hydrolase of Staphylococcus aureus. MicroBiotec’15 –
iv
Agradecimentos
À Doutora Rita Sobral, expresso o meu profundo agradecimento pela orientação, pela disponibilidade para o debate de ideias e apoio que muito elevaram os meus conhecimentos científicos e, sem dúvida, muito estimularam o meu desejo de querer saber mais e a vontade constante de querer fazer melhor.
Agradeço, também, à Professora Ana Madalena Ludovice, pela co-orientação neste projeto. Muito obrigada pelo profissionalismo e pela total disponibilidade que sempre revelou para comigo.
Aos meus colegas de laboratório, Bárbara, Raquel, Ricardo e Vanessa, um muito obrigado pela vossa amizade, companheirismo e ajuda, fatores muito importantes na realização desta tese e que me permitiram que cada dia fosse encarado com um sorriso e particular motivação.
À Inês Grilo, com quem tive o privilégio de colaborar, agradeço toda a disponibilidade e paciência que teve para comigo nas semanas que estive no ITQB/UNL.
Aos colegas do UCIBIO, quero agradecer a disponibilidade para partilha de ideias, pelo auxílio e pelos momentos que relembro com um sorriso nos lábios, em particular à Cynthia Barroco, ao João Caço, ao João Brito, ao Tiago Dias e à Nicole.
Ao José Dias, um agradecimento especial pelo apoio e carinho diários, pelas palavras doces e pela transmissão de confiança e de força, em todos os momentos.
Agradeço, também aos meus amigos que sempre me apoiaram.
À minha família, em especial aos meus pais, um enorme obrigada por acreditarem sempre em mim, pelo esforço e dedicação que sempre tiveram para que eu pudesse terminar esta etapa e por todos os ensinamentos de vida. À minha tia Dulce e às minhas primas-manas Inês e Violeta pelo apoio e pela forma como me acolheram e integraram em Lisboa.
vi
Abstract
For bacterial cells to enlarge and divide, peptidoglycan must be cleaved by specific hydrolases so that new subunits can be incorporated into the mature cell wall. The most important murein hydrolase of the opportunistic human pathogen Staphylococcus aureus is ATL, a 137.5 kDa bifunctional protein with two domains: AM and GL that are extracellularly processed and bind to the staphylococcal surface at precise locations of the equatorial surface rings. Based on observations that showed that atl mutants, constructed in different S. aureus genetic backgrounds, are not all impaired in biofilm formation, and that the GL-DNA interaction impacts biofilm formation in a strain specific way, we hypothesized that the physiological roles of ATL may be strain-specific. Different approaches were used to characterize ATL in different S. aureus strains: (i) the atl gene was sequenced to identify amino acid differences in the protein that could change its activity or undergo different proteolytic cleavage; (ii) the size of the different ATL processed forms and the cell compartment where they accumulate was assessed; (iii) the expression of ATL was analyzed over time by western blotting; (iv) the impact of DNA on GL lytic activity was determined for heat-inactivated cells, cell wall and peptidoglycan, through lytic assays with the GL purified protein.
The results obtained allowed to identify distinct patterns of ATL protein expression and of proteolytic cleavage that may be the basis for the primary phenotypic differences.
Keywords: Autolysin; Staphylococcus aureus; lytic activity; ATL; Glucosaminidase;
vii
Resumo
Para as células bacterianas crescerem e se dividirem, o peptidoglicano sofre clivagem por hidrolases específicas de modo a que novas subunidades possam ser incorporadas na parede celular. A hidrolase mais importante de Staphylococcus aureus, um agente patogénico humano oportunista, é a proteína bifuncional ATL composta por dois domínios, AM e GL, que são processados extracelularmente e se ligam à superfície da bactéria em locais precisos da superfície equatorial. Com base em observações que mostraram que para mutantes de atl, construídos em diferentes linhagens de S. aureus, a formação de biofilme não é em todos prejudicada, colocou-se a hipótese de que os papéis fisiológicos da ATL podem ser específicos da estirpe. Diferentes abordagens foram usadas para caracterizar a proteína ATL em diferentes estirpes de S. aureus: (i) o gene atl foi sequenciado com o intuito de encontrar diferenças de aminoácidos na proteína que poderiam alterar a atividade ou sofrer clivagem proteolítica diferente; (ii) analisou-se o tamanho das diferentes formas processadas do ATL, bem como o compartimento da célula em que o mesmo ocorre; (iii) a expressão de ATL foi analisada ao longo do tempo por Western Blot; (iv) determinou-se o impacto do DNA na atividade lítica do GL em células inativadas, na parede celular e no peptidoglicano, através de ensaios de lise com a proteína purificada GL.
Os resultados obtidos permitiram identificar padrões distintos de expressão da proteína de ATL e clivagem proteolítica que pode ser a base para as diferenças fenotípicas primárias.
Palavras-chave: Autolisina; Staphylococcus aureus; atividade lítica; ATL;
viii Table of Contents
Page
Agradecimentos iv
Abstract vi
Resumo vii
Table of Contents viii
List of Figures x
List of Tables xi
Acronyms xii
Chapter I- Introduction 1
1. Staphylococcus aureus 1
1.1. Pathogenicity 1
1.2. Virulence 1
1.2.1. Multi-drug resistance 2
1.2.2. MRSA epidemiology 3
2. Cell Wall 4
2.1. Peptidoglycan biosynthesis 5
2.2. Hydrolases 7
2.3. ATL – The major autolysin of Staphylococcus aureus 8
2.3.1. Role of ATL in Cell Division 10
2.3.2. Role of ATL in Biofilm formation 11
2.3.3. ATL-DNA association 12
3. Thesis objectives 13
Chapter II – Material and Methods 15
1. Strains 15
2. DNA Methods 16
2.1. PCR and Sequencing 16
3. Fractionation of culture contents 18
ix
4. GL-mediated Lysis Assays 18
4.1. Purification of heat-inactivated cells 19
4.2. Cell wall extraction ...19
4.3. Purification of Peptidoglycan ...20
5. Protein expression and purification ...20
5.1. Expression of ATL-C protein in complex medium for digestion assays ...20
5.1.1. Manual protein purification using Ni-NTA matrix ... 21
5.2. Expression of ATL-C protein in Minimal Medium for NMR analysis ...21
5.2.1. Expression of ATL-C protein in Minimal Medium for 15N NMR analysis 22
5.3. Desalting and protein concentration 22
5.4. Protein quantification 22
6. NMR 23
Chapter III – Results 25
1. Determination of atl gene SNPs 25
2. Determination of alterations in ATL protein sequence 27
3. Determination of ATL protein expression along growth 33
3.1. Expression analysis using anti-GL antibody 34
3.2. Expression analysis using anti-AM antibody 36
4. The association between DNA and GL lytic activity 38
5. Expression of ATL-C protein in Minimum medium for NMR analysis 44
6. NMR analysis 46
Chapter IV – Discussion and Conclusions 49
1. atl gene SNPs affect the protein sequence 49
2. Differences in the expression of ATL protein along growth 50
3. The impact of DNA on GL lytic activity 51
4. NMR 52
5. Conclusion 53
References 55
x
List of Figures
Page
Chapter I- Introduction ....
Figure 1 – Chemical structure of S. aureus peptidoglycan. 5 Figure 2 – Schematic representation of coordinated cell wall biosynthesis
and cell division in S. aureus. 7
Figure 3 – Murein hydrolases targets within S. aureus peptidoglycan. 8 Chapter III - Results
Figure 4 – Domain arrangement of the bifunctional ATL precursor protein. 9 Figure 5 – (A) Structure of the catalytic domain of AmiE amidase
(without repeats R1,2) of S. epidermidis AtlE. (B) Structure of the Atl repeats R2ab. 9
Figure 6 - Model for the function of atl gene products in cell-cell separation. 11 Figure 7 – atl PCR reactions scheme. 25 Figure 8 - Alignment of the two promoter candidates sequences of
ATL of S. aureus 27
xi
List of Tables
Page
Chapter I- Introduction ....
Table 1 –Strains and plasmids used in this study. 15 Table 2– Primers used for PCR amplification 16 Table 3 –Culture volumes taken at different OD’s620nm. 17 Chapter III - Results
Table 4– atl gene fragments amplified and primers used for PCR amplification. 25 Table 5–SNP’s, insertions and deletions in the atl gene from strains
xii
Acronymes
ε Epsilon
AM Amidase
CA-MRSA Community-Associated Methicillin Resistant Staphylococcus aureus
BCA Bicinchoninic Acid Assay
DNA Deoxyribonucleic Acid
EDTA Ethylenediaminetetraacetic Acid
EMRSA Epidemic Methicillin Resistant Staphylococcus aureus
GL Glucosaminidase
GlcNAc N-Acetylglucosamine
h Hour
HA-MRSA Hospital-Associated Methicillin Resistant Staphylococcus aureus
HCl Hydrochloric Acid
HSQC Heteronuclear Single Quantum Coherence
Km Kanamycin
LA Lysogeny Broth Agar
LB Lysogeny Broth
LTA Lipoteichoic Acid
min Minutes
MSSA Methicillin Susceptible Staphylococcus aureus MgSO4 Magnesium Sulfate
MRSA Methicillin Resistant Staphylococcus aureus MurNAc N-acetyl-muramic Acid
MW Molecular Weight
NaCl Sodium Chloride
NaN3 Sodium Azide
xiii Ni-NTA Nickel Nitrile-Triacetic Acid
Nm Nanometer
NMR Nuclear Magnetic Resonance
OD Optical Density
O/N Overnight
PBP Penicillin-Binding-Protein PBS Phosphate Buffered Saline
PCR Polymerase Chain Reaction
pI Isoelectric Point
PP Propeptide
K Kelvin
KH2PO4 Monopotassium Phosphate
kDa Kilodalton
Rpm Revolutions per minute
RT Room Temperature
SCCmec Staphylococcal cassette chromosome mec
SDS Sodium Dodecyl Sulfate
SDS-PAGE SDS-Polyacrilamide Gel Electrophoresis SNP Single-nucleotide Polymorphism
TA Teichoic Acids
TCA Trichloroacetic Acid
TSA Tryptic Soy Broth Agar
TSB Tryptic Soy Broth
UV Ultraviolet
V Volt
1
Chapter I - Introduction
1. Staphylococcus aureus
Staphylococcus aureus are Gram-positive cocci with low DNA G+C content that usually occur as grape-like clusters, and form a fairly large yellow colony on rich medium and are often hemolytic on blood agar. Staphylococci are facultative anaerobes that grow by aerobic respiration or by fermentation that yields principally lactic acid. These bacteria are catalase-positive (converts hydrogen peroxide to water) and oxidase-negative, and can grow at a temperature range of 15 to 45 degrees and at NaCl concentrations as high as 15 percent. They are coagulase positive, a marker that allows the distinction between S. aureus and other Staphylococcus (Kloos, 1997).
1.1. Pathogenicity
S. aureus are frequently found as a commensal in the respiratory tract of humans (Kluytmans et al, 1997) but can also act as an opportunistic human pathogen. They are the major cause of nosocomial infections worldwide (Pfaller et al, 1988).
In colonization, the relationship with the host is benign and asymptomatic, but break of the cutaneous barrier allows the bacteria to internalize and cause diseases such as skin and soft tissue infections (noninvasive infections). As a pathogen, it is considered versatile bacteria, as it can cause a wide spectrum of infections from impetigo and folliculitis to life-threatening invasive infections, such as bacteremia, pneumonia or endocarditis. In addition, intake of toxins from food products colonized by S. aureus, can cause acute gastroenteritis (Boucher et al, 2010; Lee, 2003; Projan & Novick, 1997).
1.2. Virulence
S. aureus expresses many potential virulence factors including toxins, immune-modulatory factors, and exoenzymes (Watkins et al, 2012).
2 polysaccharides; ii) escaping of the host immune system, such as enterotoxins, protein A and leukocidins; and iii) damage of the host including hemolysins, phospholipase C
and α-toxin. Toxins, proteases and superantigens, prevent the development of a strong antibody response by promoting the bacterial attack of the host, preventing the development of an antibody response, compromising the immune memory (Foster, 2005; Projan et al, 1997).
S. aureus is also insensitive to lysozyme (peptidoglycan hydrolase), a bactericidal protein produced by the innate immune system that is present in most human body fluids such as saliva, sweat and tears, and which production is increased during infection (Bera et al, 2005; Levy , 2000; Schindler et al, 1997).
The fact that S. aureus has the ability to easily acquire genetic information also contributes to virulence, mainly through the acquisition of mobile genetic islands that carry virulence determinants.
1.2.1. Multi-drug resistance
S. aureus, the paradigm among the bacteria of this natural phenomenon, has always been a challenge for anti-microbial chemotherapy (Chambers, 2001).
Initially, staphylococci infections were treated with penicillin, a β-lactam antibiotic discovered in 1928 improving the prognosis of patients with staphylococcal infections,
decreasing the extremely high mortality rate. β-lactams inhibit the last step of the cell wall peptidoglycan biosynthesis, inactivating the penicillin binding proteins (PBPs) due to the similarity to their substrate – peptidoglycan terminal D-ala-D-ala. The acquisition
of a plasmid encoding for a β-lactamase protein (penicillinase) led to penicillin
resistance (Abraham and Chain, 1940); this β-lactamase hydrolyzes the β-lactam ring and consequently inactivates the antibiotic (Ghuysen, 1991). In order to overcome the acquired resistance to this natural antibiotic, semi-synthetic compounds (derivatives of
penicillin), modified to resist to β-lactamase action, were developed to combat S. aureus penicillin resistant infections: methicillin and its derivatives oxacillin, nafcillin, among others (Plata et al, 2009; Moellering, 2012).
3 exogeneous mecA gene (Jevons, 1961). The MRSA phenotype is a multifactorial process that occurs by the acquisition of a staphylococcal chromosome cassette (SCCmec) and the expression of several housekeeping auxiliary genes. Besides β -lactams antibiotics (penicillins, cephalosporin and carbapenems), MRSA strains also developed resistance to virtually all other classes of antibiotics that were introduced into clinical practice, such as macrolides, chloramphenicol and tetracycline, that target protein synthesis or fluoroquinolones and rifampicin, that target nucleic acid synthesis (Bambeke et al, 2003).
The major resistance element of SCCmec is the mecA gene. This gene codes for an
extra PBP, PBP2a (Reynolds & Brown, 1985). PBP2a has a very low affinity to β -lactams, allowing cell wall biosynthesis to proceed in the presence of the antibiotic (Hartman and Tomasz, 1984). The mecA gene is not native to S. aureus but was acquired from another species, most probably S. sciuri (Couto et al 1996; Rolo et al 2013), by an unknown mechanism. (Beck et al, 1986) Although mecA is the main genetic determinant for methicillin resistance, recently, a highly divergent mecA gene, mecC, was identified with relatively low prevalence rates (Shore et al, 2011).
The methicillin-resistant phenotype also depends on the expression of more than 32 housekeeping genes - auxiliary factors, frequently associated with the cell wall peptidoglycan biosynthesis and degradation (Roemer et al, 2013; Berger-Bächi et al, 1992; de Lencastre et al, 1999).
1.2.2. MRSA epidemiology
4 In contrast to MRSA infections at hospital settings, in which infected patients have predisposing risk factors such as an immunocompromised immune system, specific
MRSA clones emerged in the community, in the mid and late 1990’s, in healthy
individuals without hospitalization history – the community acquired MRSA (CA-MRSA) (DeLeo et al, 2010; David & Daum, 2010). CA-MRSA strains are usually more virulent and more transmissible, however less resistant to antibiotics in comparison with HA-MRSA. Moreover, CA-MRSA strains carry the smaller SCCmec elements of types IV and V which were associated with lower fitness costs, thus promoting increased toxin production and thereby increased virulence (Chambers & DeLeo 2009; DeLeo et al. 2010; Otto 2012).
Several CA-MRSA backgrounds emerged and spread differently in separate geographical areas, however, nowadays CA-MRSA are not restricted to a specific geographic region. USA400 clone is present in Asia, Europe and the USA, USA300 in the USA and Europe, the Southwest Pacific clone in Australia, Europe and South America, the ST59-V clone in Asia and the USA, the European clone in Europe, Asia and the Middle East, and ST398 clone, first associated with colonization in pigs in France, is currently disseminated worldwide, not only in animals but also in humans (Mediavilla et al, 2012; Monecke et al, 2011; Uhlemann et al, 2012).
The expanding community reservoir of CA-MRSA has led to the inevitable infiltration of CA-MRSA into hospitals. This phenomenon has become a major public health threat and it is postulated that CA-MRSA will become the dominant MRSA strain in hospitals, with competitive exclusion of the traditional HA-MRSA strain (Seybold et al, 2006).
2. Cell Wall
One of the crucial bacterial structures is the cell envelope and its integrity has to be guaranteed.
5 diverse structures, being the peptidoglycan their major component (up to 50%) and the teichoic acids (TAs) the key multi-functional components of the cell wall. Many Gram-positive bacteria, such as S. aureus, contain two types of TAs; wall teichoic acids (WTA), which are covalently linked to the peptidoglycan layer and lipoteichoic acids (LTA), which are embedded in the membrane via a lipid anchor (Reichmann & Grundling, 2011; Xia et al 2010). Besides peptidoglycan and teichoic acids, the cell wall harbors a variety of different polysaccharides, polymers and proteins, like the PBPs.
2.1. Peptidoglycan Biosynthesis
Peptidoglycan, also called murein, is a polymer that consists of long glycan chains of alternated disaccharide units (N-acetyl-glucosamine and N-acetyl-muramic acid) that are cross-linked via flexible peptide bridges to form a strong but elastic structure that protects from lysis due to the high internal osmotic pressure (Ehlert & Holtje, 1996; Holtje, 1998; Nanninga, 1998; Schleifer & Kandler, 1972) (Figure 1).
Figure 1 -Chemical structure of S. aureus peptidoglycan: disaccharide units cross-linked through an inter-peptide bridge consisting of five glycines to connect the ε-amino group of L-Lys in the third position of one stem (bridge-link, highlighted) to the D-Ala in the fourth position of the connected stem (cross-link) with the concomitant cleavage of the terminal D-Ala. (Zhou & Cegelski, 2012)
Peptidoglycan and its biosynthetic pathway is the target of several antibiotic classes
6 In S. aureus, peptidoglycan synthesis begins in the cytoplasm where the precursor UDP-MurNAc-pentapeptide is assembled. It consists of a unit of N-acetyl-muramic acid (MurNAc) that is attached to a pentapetide chain L-alanine-D-glutamate-L-lysine-D-alanyl-D-alanine (Vollmer et al, 2008). Then, UDP-MurNAc-pentapeptide is transferred to a membrane-bound lipid carrier by the action of MraY, forming lipid I. UDP-GlcNAc is added to lipid I by the action of MurG, leading to the formation of lipid II (van Heijenoort, 2007), that is transported through the membrane by the action of FtsW flippase and is polymerized through transglycosylation (to extend the glycan chains) and transpeptidation (crosslinking between stem peptides of different glycan strands). In S. aureus most of the pentapeptide chains of adjacent macromolecules are linked by pentaglycine interbridges between the penultimate D-alanine of one peptide chain and the free amino group of the lysine of the other chain. This is achieved through the transpeptidation activity of the so-called penicillin-binding proteins (PBP’s), which also catalyze the transglycosylation reaction. (Goffin et al, 1998) The peptidyltransferases (FemX, FemA and FemB) are responsible for the addition of the five glycine residues of the bridge, in a reaction catalyzed at the membrane level. (Figure 2)
Additional modifications to the peptidoglycan structure occur in many bacterial species including modifications to the glycan chains, modifications to the stem peptide, such as the amidation of the glutamate residue by the proteins MurT and GatD, and incorporation of cell wall polymers (Figueiredo et al, 2012).
7 Figure 2 – Schematic representation of coordinated cell wall biosynthesis and cell division in S.
aureus(adapted from Roemer et al, 2013).
2.2. Hydrolases
Synthesized peptidoglycan units are incorporated into the intact cell wall layer after cleavage by peptidoglycan hydrolases. A proper balance between peptidoglycan synthesis and degradation during bacterial growth is essential. In general, peptidoglycan hydrolases are thought to play an important role in cell wall turnover, cell division, and
cell separation, and in the lysis of bacteria induced by the β-lactam antibiotics (Biswas et al, 2006).
S. aureus produces several peptidoglycan hydrolases, such as
8 Figure 3 – Murein hydrolases targets within S. aureus peptidoglycan. The arrows indicate the
cleavage sites (adapted from Szweda et al, 2012).
SleI is a 32kDa protein with N-acetylmuramyl-L-alanine activity and is involved in cell separation after division in S. aureus (Heilmann et al, 2005). LytM is a 32 kDa protein with glycylglycine endopeptidase activity, being able to hydrolyse the glycyl-glycine bonds of S. aureus cross bridges. Ramadurai (1997 and 1999) reported that LytM plays a role in cell growth as it is distributed on the cell surface uniformly. Other peptidoglycan hydrolases with N-acetylmuramyl-L-alanine amidases activity were described in S. aureus, including LytA (23 kDa), LytH (33kDa) and LytN (46kDa).
2.3. ATL – The major autolysin of Staphylococcus aureus
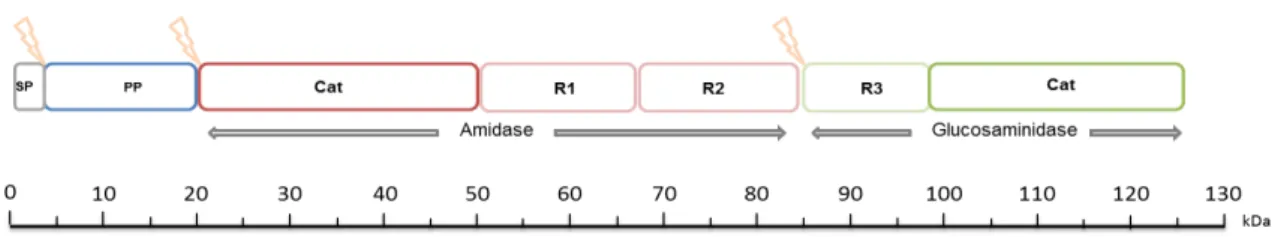
9 Figure 4 – Domain arrangement of the bifunctional ATL precursor protein. Arrows (lightning)
indicate the post-translational cleavage sites. SP- signalpeptide; PP- propeptide; cat- catalytic domains; R1 R2 R3- repeat domains.
The amidase (63.3 kDa) cleaves the amide bond between the N-acetyl muramic acid in the glycan backbone and L-alanine in the stem peptide, contains an enzymatic domain and two repeat domains involved in localization and substrate recognition (R1 and R2, that can each be further divided into an a-type and a b-type subunit) (Biswas, 2006; Marino et al, 2002). The amidase repeats R1R2 are responsible for attaching the enzyme to the cell wall and do not contribute to lytic activity (Oshida, 1995; Biswas, 2006). The structure of AM from Staphylococcus epidermidis is already determined
(Figure 5). This domain, without repeats, adopts a globular, mixed α/β fold, with six
stranded, central β-sheet surrounded by seven α-helices (Zoll et al, 2010). In the center of the recessed area is a zinc ion. R2ab resembles a half-open β-barrel formed by a semi-circular, four stranded β-sheet, and the two subunits are arranged in a similar orientation.
Figure 5 –(A) Structure of the catalytic domain of AmiE amidase (without repeats R1,2) of S. epidermidis AtlE. Helices and strands are shown in green and pink respectively. (B) Structure of the Atl repeats R2ab. R2aand R2bhave a similar β-structure that is connected with a flexible linker with R1a.
(Götz et al, 2013)
10 GL (53.6 kDa) hydrolyzes the bond between N-acetyl-β-D-glucosamine and N-acetyl muramic acid and contains an enzymatic domain and a single repeat domain (R3) (Oshida, 1995). The structure of GL domain has not been elucidated yet.
The differences in structure of the repeat domains of these two enzymes might reflect the differences of the recognition sites on staphylococcal cell walls. The atl gene was probably developed through fusion of AM and GL genes (Oshida, 1995).
2.3.1. Role of ATL in Cell Division
S. aureus is known to occur singly, in pairs, in short chains, and in irregular clusters (Bergey's Manual, 8th ed.), dividing in an unusual way, as it switches division plane in three consecutive perpendicular orientations in successive division cycles (Tzagoloff & Novick, 1977). S. aureus cells divide by forming a septum which is split, becoming the new hemisphere of each daughter cell (Giesbrecht et al, 1976; Amako & Umeda, 1997). The binding of both AM and GL to the staphylococcal surface occurs at precise locations of the equatorial surface rings, not only at the septum of dividing cells but also at a perpendicular surface ring that marks the future cell division site (Sugai et al, 1997; Baba and Schneewind, 1998).
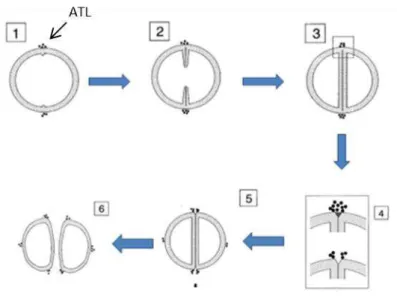
The mechanism by which ATL-hydrolase is targeted to the equatorial surface ring is based on an avoidance strategy by WTAs, which prevents binding of ATL. As WTAs are abundant in the cell wall but not at the cross-wall region, ATL is able to bind to this region. There are at least two possible mechanisms for the specific localization of ATL at the septal sites of the cell surface. One is that ATL protein is synthesized, translocated at the cell division site, and localized with an anchoring component. The other is that ATL is secreted into the culture medium and reabsorbed to an anchoring component via ligand-receptor interaction (Schlag et al, 2010; Yamada et al, 1995). (Figure 6)
11 Deletion mutants of atl form large cell clusters in which the walls of individual cells appear to be interlinked with other cells, indicating a severe defect in cell separation (Biswas et al, 2006).
Figure 6 - Model for the function of atl gene products in cell-cell separation. Localization of atl gene
products at the cell surface for the different cell division phases; 1 – beginning of septum formation; 2 –
septum invagination; 3 – complete septum formation; 4 – detail of murein hydrolysis at the septum limits; 5 - ATL localizes at the future cell division site;6- cell division (adapted from Yamada et al, 1995).
2.3.2. Role of ATL in Biofilm formation
Colonization of human nares, among other surfaces, with S. aureus usually involves the establishment of biofilms (Iwase et al, 2010). These aggregates occur in natural and industrial environments, but also in hospital settings. Biofilm formation begins with the initial adhesion of bacteria to the host epithelial surfaces; subsequent release of bacterial polysaccharides, proteins and DNA leads to the formation of an extracellular matrix that involves the biofilm community. After biofilm growth and maturation, shedding and release of bacterial cells, promotes invasive disease and dissemination into host tissues (Sadykov, 2012; Archer, 2011). Cell death and lysis is a necessary and, apparently, controlled process during the development of S. aureus biofilm (Rice et al, 2007).
12 biofilm (Bose et al, 2012; Houston et al, 2011; Boles et al, 2010; Heilman et al, 1996) and the adhesion characteristics of the deletion mutants resembled those of DNase I-treatedsamples (Das et al, 2010). The currently accepted model for the role of ATL in biofilm formation defends that this protein is directly involved in cellular autolysis and genomic DNA (an important building block of the biofilm matrix) release (Boles et al, 2010). S. aureus biofilms may include bacterial DNA as part of the extracellular matrix (Kaplan et al, 2012; Mann et al, 2009) which its released through the activity of ATL (Houston et al, 2011; Rice et al, 2007). On the other hand, ATL directly contributes to the attachment of cells to the surface during the early stages of biofilm formation (Houston et al, 2011). The repeat domains of ATL have been shown to bind various
host extracellular matrix proteins, including vitronectin and fibronectin (Heilmann et al, 2005; Heilmann et al, 1997; Hell et al, 1998).
The recently reported DNA-binding capacity of the catalytic GL domain of ATL may confer another function for this hydrolase in biofilm development: GL could provide an attachment point between the cell surface and the biofilm matrix (Grilo et al, 2014).
2.3.3. ATL-DNA association
Recently, Grilo et al (2014) reported that ATL is able to bind DNA molecules, suggesting multiple possible roles for such activity. This DNA-binding activity is not
sequence specific and does not require interaction with other proteins. It is present in the
13
3. Thesis objectives
Preliminary observations (Grilo et al, unpublished) showed that atl mutants, constructed in different S. aureus genetic backgrounds, are not all impaired in biofilm formation. Also, a role for GL-DNA binding capacity in biofilm formation was observed for some strains, while not for others (see results in annex 1).
Facing these observations, we hypothesized that the physiological roles of ATL protein are strain-specific.
The main objective of this thesis is to characterize ATL protein regarding strain specificity:
1- The different processed forms and the cell compartment where the cleavage occurs, in different S. aureus backgrounds (MRSA and MSSA strains).
2- Analyze the expression of ATL along time in the different strains.
3- Analyze the impact of DNA on GL lytic activity on the peptidoglycan of several S. aureus lineages.
15
Chapter II - Materials and Methods
1. Strains
In this study, S. aureus strains COL, NCTC 8325, WIS, HDE 288, MW2, UAMS-1 and JE2 were grown at 37ºC with aeration in Tryptic Soy Broth or Agar (TSB/TSA) (Difco Laboratories, USA), and Escherichia coli strains were grown at 37ºC in Lysogeny Broth or agar (LB/LA) (Difco Laboratories). These strains and their genotype are listed in Table 1.
Table 1 –Strains and plasmids used in this study.
Strain or plasmid Genotype or Description Source or
reference Strains
Staphylococcus aureus
COL HA-MRSA; archaic clone, SCCmec type I
Tetr, Strepr Rockefeller University
Collection
NCTC 8325 MSSA Novick, 1991
WIS Taiwan clone, SCCmec type V CA-MRSA O’brien et al, 1999
HDE 288 HA-MRSA; Pediatric clone, SCCmec type
VI AMSr, Cftr, Oxar, Penr Sá-Leão et al, 1999
JE2 CA-MRSA; USA 300 clone Diep et al, 2006
MW2 CA-MRSA; USA400 clone, SCCmec type
IV
CDC, 1999
UAMS-1 MSSA Gillaspy et al, 1995
Escherichia coli
BL21(DE3) F–ompT gal dcm lon hsdSB(rBmB) k(DE3
[lacI lacUV5-T7 gene 1 ind1 sam7 nin5])
Invitrogen
Plasmids
pET28a(+) E. coli expression vector Novagen
pET-GL pET28a(+) expressing GL as a N-terminal
His-tag fusion (fragment amplified with Pexp3 and Pexp4)
Grilo et al, 2014
pET-AM pET28a(+) expressing AM as a N-terminal
His-tag fusion (fragment amplified with
Pexp1 and Pexp5)
16
2. DNA Methods
Chromosomal DNA from strains was extracted using Wizard Genomic DNA Purification kit (Promega, USA) as suggested by the manufacturer, with some modifications, namely, an initial cell lysis step, performed in Tris pH8 supplemented with 10 mg/ml of lysostaphin (AMBI PRODUCTS LLC, USA) and 30 µg/ml of RNase (SIGMA, USA).
2.1. PCR and sequencing
Routine PCR (polymerase chain reaction) amplification was performed with
NZYTaq DNA polymerase (Nzytech, Portugal). The primers used are listed in Table 2.
PCR products were purified with DNA Clean & ConcentratorTM-5 (Zymo Research, USA).
Table 2– Primers used for PCR amplification.
Primer Sequence nt
PAM fw BamHI CCAGGATCCGCTTCAGCACAACCAAGATCAG 31
pGL rv XhoI CCACTCGAGTTTATATTGTGGGATGTCG 28
PreAM fw ATGAATGCCCAATGTCATGC 20
AM rv AGTAGTTACTTTAGGTGTCGC 21
PcompATL fw SalI CGAGTCGACGATTTGTCACGTCACC 25
PAMR2 rv SalI CCAGTCGACTTAGGTAGTTGTAGATTGCG 29
PR1R2R3GL fw NcoI GCTCCATGGCTCCTACTACACCATCAAAACC 31
PAM rv SalI CCAGTCGACTTATTTTACAGCTGTTTTTGG 30
PR2R3GL fw NcoI GCACCATGGCTCCTACACCAACACCTAAGCC 31
pGLSH3 rv SalI CCTGTCGACTTAATGCTTAACATCATTAAAGTTAG
C
36
PGL fw BamHI CGTGGATCCGCTTATACTGTTACTAAACC 29
PGL rv SalI CCAGTCGACTTATTTATATTGTGGGATGTCG 31
PGLSH3fw GATGTTAAGCATGCAATGGATACG 24
PosGL rv ACGTTGCGAATTGATTGAAGC 21
17
3. Fractionation of culture contents
Culture samples were taken over time corresponding to the following OD620nm: 0.1, 0.2, 0.4, 0.6, 1, 2, 3, 4, 6 and at late stationary phase (≈24h). Cells were harvested
by centrifugation (10 000g, for 10 minutes at 4ºC) and the supernatant and the pellet were separately stored at -20ºC and later processed as follows.
Supernatant
The supernatant protein precipitation was performed using 1/10 volume of TCA, during 17h, at -20ºC. The protein fraction was collected by centrifugation at 13 000 rpm 4ºC, 10 minutes (SIGMA 3-16K, 12155 rotor, Sartorius, Germany). The protein pellet was rinsed with ice-cold acetone and centrifuged at 13 000 rpm 4ºC for 10 minutes. The supernatant was discarded and the dried pellet ressuspended in 500µl PBS 1x.
Pellet
In order to obtain the same cell number, different volumes of culture were used, as showed in Table 3. The pellet was washed in 1ml of ice-cold 50mM Tris-HCl (pH7.5)-150mM NaCl and centrifuged at 10 000 rpm, 4ºC for 10 minutes. Then, the membrane-associated proteins were extracted by ressupending the pellet in 100µl of 4% SDS and incubating at room temperature (RT) for 30 minutes with stirring. The SDS suspensions were centrifuged at 13 000 rpm (Biofuge Pico Heraeus), for 15 minutes at RT. The supernatants were stored in aliquots at -20ºC.
Table 3 –Culture volumes taken at different OD’s620nm.
OD620nm Volume (mL)
0.1 50
0.2 25
0.4 12.5
0.6 8.3
1 5
2 2.5
3 1.7
4 1.25
18
3.1. Protein analysis by SDS-PAGE and Western Blot
To verify the integrity of the protein extracts, protein samples were analyzed under denaturing conditions using SDS-polyacrylamide gel electrophoresis (PAGE), with the mini-PROTEAN system (BIO-RAD, USA). Before electrophoresis, the
samples were mixed in a ratio of 1:2 with 19:1 (Laemmli: β-mercaptoethanol) solution, incubated at 95ºC for 5 min and then 10 min on ice. Electrophoresis was performed in running buffer (24 mM Tris-base, 191 mM Glycine, 3.46 mM SDS) at 30 mA for 1-1.5 h. Samples were analyzed in 10% SDS-PAGE along with molecular weight marker (ColorBurst Electrophoresis Marker, Sigma or Precision Plus ProteinTM All Blue Standards, BIO-RAD).
Proteins were transferred to a nitrocellulose membrane (Amersham Hybond ECL Nitrocellulose, 0.45 µm from GE Healthcare, UK) using the Mini Trans-blot electrophoretic transfer cell (BIO-RAD) and transfer solution (25 mM Tris-base, 192 mM Glycine, 10% Ethanol). Blotting was performed at 4ºC for 90 min at 100 V with agitation. After blotting, the membrane was incubated overnight in blocking solution (PBS-Tween and 5% w/v low-fat milk), washed with PBS-Tween and probed with the primary antibody anti-GL or anti-AM (Grilo et al, unpublished), in a ratio of 1:1500 for 2 h and 1:1000 for 5h, respectively. The membrane was then washed, immersed in fresh blocking buffer and incubated with secondary antibody (anti-rabbit IgG) (Perkin Elmer, USA) in a ratio of 1:20000 for 30min. After a final washing step, the membrane was incubated with chemiluminescence detection solution for 1 min (Western Lightning Plus-ECL, PerkinElmer, USA) and exposed to autoradiographic film (Amersham HyperfilmTM ECL GE Healthcare) for appropriate periods of time. The film was processed manually by immersion in developing and fixing reagents.
4. GL-mediated Lysis Assays
Three different substrates were used to analyze the lytic activity of GL: (i) heat-inactivated cells, (ii) cell wall, and (iii) peptidoglycan. Samples were prepared as described in the next sections (4.1 – 4.3). Heat-inactivated cells were diluted to an OD600≈ 0.4 in Tris pH7.5. Cell wall and purified peptidoglycan were prepared Tris
19 the repeat region, Grilo et al, 2014) (5ng/µl) were added to the wells, as needed. Mutanolysin (5µg/mL) and lysostaphin (5µg/mL) were used as positive controls for lytic activity.
Lysis assays were performed in sterile nontreated 96-well microplates (Brandplates®, Brand, Portugal) at 37ºC with shaking for 10h, taking readings (600nm) with 10 minutes interval in a microplate reader Sprectra Max190 (Molecular devices, USA).
4.1. Purification of heat-inactivated cells
S. aureus strains were grown at 37°C with stirring to an OD of ≈0,3 and cells were
harvest by centrifugation at 10 000 rpms at 4ºC for 10 minutes (Sorvall RC-5C 19 Plus, SLA-150 rotor, Kendro Laboratory Products Newtown, USA). The pellets were ressuspended in cold water and cells were boiled in SDS (to a final 4% SDS concentration) for 30 minutes. The cultures were kept at RT O/N. The SDS was removed by washing the cells with hot water until no SDS is detected in the ressuspended pellet through the Hayashi method. The pellet cells were kept in H2O with 0,05% NaN3.
4.2. Cell wall extraction
To extract the cell walls, the procedure of section 4.1. was performed and subsequently the cells were broken by glass beads (Glass beads, acid-washed, 425-600
μm, Sigma) using the Fastprep apparatus (Fastprep FP120, Bio 101 Savant, France), 3 times, 40 seconds at speed 6. The samples were cooled on ice between runs. Glass beads were removed by filtration using a vaccum filter (porosity 3). The filtrate was centrifuge in corex tubes for 5 minutes at 2 000 rpm, RT, to remove unbroken cells and large cellular debris. The supernatant was centrifuged for 15minutes at 15 000 rpm, RT. Pellets were ressuspended in 100mM Tris (pH 7.5).
20 SDS was removed by 2 washes with H2O, centrifuging at 15 000rpm for 15 minutes. The pellet was incubated in 8M LiCl2, for 30 minutes at 37ºC and centrifuged for 15 minutes at 15 000 rpm at RT. The pellet was incubated in 0.1M EDTA (pH 7.0), for 30 minutes at 37ºC and again centrifuged. After 4 washings with H2O the pellet was lyophilized O/N in Speedvac (SavantTM SpeedvacTM Concentrator, USA).
4.3. Purification of Peptidoglycan
Peptidoglycan purification was performed following the procedures of sections 4.1. and 4.2.. The lyophilized pellet (section 4.2) was treated with 48% hydrofluoric acid, for 48h at 4ºC with agitation. After incubation, H2O was added and a pellet was obtained by centrifugation (45min at 20 000 rpm, 4ºC). This step was repeated. The pellet was ressuspended in 10mM Tris (pH 7.0), followed by centrifugation. Three H2O washing steps were performed. The pellet was lyophilized O/N in Speedvac.
5. Protein expression and purification
ATL-C protein (GL domain without the repeat region) (Grilo et al, 2014) was expressed using two different procedures, according to the final objective: i) protein for the lysis assays, and ii) protein for the NMR assays.
5.1. Expression of ATL-C protein in complex medium for digestion assays
ATL-C protein was expressed in E. coli BL21(DE3)+PET28a-ATL-C. Cells transformed with the appropriate recombinant plasmid were grown in LA medium
supplemented with Kanamycin (30 μg/ml of Km) at 37ºC.
A colony was inoculated in 500mL of auto-induction medium (LB medium supplemented with 2mM MgSO4, 10mL 50x5052 (0.5% glycerol, 0.05% glucose and 0.2% lactose), 25mL 20xNPS (see annex 3) and Kanamycin 30µg/ml), grown at 37ºC for 17h and cells were harvested (12000 rpm for 10 min) (Sorvall RC-5C 19 Plus) and ressuspended in 20mL lysis buffer (50mM Na2HPO4; 300mM NaCl; 10mM Imidazole; pH8) and 10 UmL-1 benzonase (Novagen, Germany) (4µL).
21 and membranes by centrifugation (12000 rpm for 1 h), the lysate was subsequently purified as described in the next section.
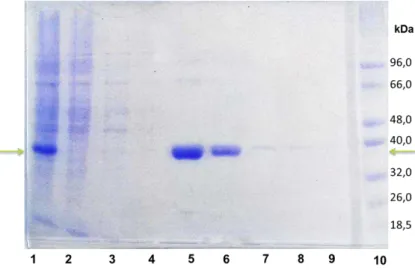
5.1.1. Manual protein purification using Ni-NTA matrix
The column was charged with Ni-NTA agarose (Qiagen, USA) and equilibrated with 20mL of water and 20mL of lysis buffer. The lysate was loaded onto the column and an aliquot was collected (flow-through). 20mL of wash buffer (50mM Na2HPO4; 300mM NaCl; 30mM Imidazole; pH8) was used for the washing steps and 2mL of Elution Buffer (50mM Na2HPO4; 300mM NaCl; 250mM Imidazole; pH8) for collecting 5 elutions. Finally, the column was washed with water and 30% ethanol and stored at 4ºC. Aliquots were collected at each step.
To verify the protein purity level, the protein samples were analyzed under denaturing conditions using SDS-polyacrylamide gel electrophoresis (PAGE), as described before, in section 3.1.
5.2. Expression of ATL-C protein in Minimal Medium for NMR analysis
ATL-C protein was expressed in E. coli BL21(DE3)+PET28a-ATL-C. To test the expression conditions, the assays were performed in small-scale, using 200 ml of bacterial culture, while, to obtain high quantities of protein, expression was performed in large-scale, using 500mL to 1L of bacterial culture. The method of cell disruption adopted was mechanical disruption with French Press as before.
Small-scale:
22 After cell disruption performed using a French Press and removal of cellular debris and membranes by centrifugation, the lysate was subsequently purified as described in 5.1.1 section and analyzed by SDS-PAGE as described in section 5.1.2..
Large-scale:
The procedure was the same as for small-scale, with the corresponding volumes scalled-up for 1L of bacterial culture.
5.2.1. Expression of ATL-C protein in Minimal Medium for 15N NMR analysis
The protein expression procedure was performed as optimized for minimal medium (section 5.2), with the exception that instead of 50mM NH4Cl, labeled 15NH4Cl (Sigma) was added to the same concentration, with the corresponding volumes scalled-up for 500mL of bacterial culture.
5.3. Desalting and protein concentration
Desalting and buffer exchange were performed using PD-10 desalting columns (GE Healthcare) to 100mM Tris (pH7.5). PD-10 Desalting Columns contain Sephadex G-25 Medium, which allows separation of high molecular weight substances from low molecular weight substances; small molecules like salt and other impurities are efficiently separated from the high molecular weight substances of interest.
The samples were concentrated using Amicon® Ultra-4 (10 k) Centrifugal Filter Units (Merck Millipore, USA). This device provides efficient concentration and
desalting of macromolecules by ultrafiltration using Millipore’s Ultracel® YM
regenerated cellulose anisotropic membranes. Centrifugal force drives solvents and low molecular weight solutes through the membrane while the macromolecules remain inside the sample reservoir.
5.4. Protein quantification
23 ProtParam and Compute pI/MW (ExPASy, Bioinformatics Resource Portal) specific for the target protein (ATL-C: ε= 64860 cm-1/M; MW = 39639.6641 Da).
Protein concentration from the extracts (section 3) was measured with BCA assay (Pierce) in a microplate reader.
6. NMR analysis
NMR experiments were performed at 298 K in a Avance II+ 600-MHz spectrometer (Bruker, Germany) equipped with 5-mm TCI cryoprobe. Proton chemical shifts were referenced against external DSS while nitrogen chemical shifts were referenced indirectly to DSS using the absolute frequency ratio. Data was processed using the Topspin 3.1 package (Bruker).
25
Chapter III
–
Results
Preliminary results (see annex1) suggest that the physiological roles of ATL
autolysin and in particular, its association with DNA (Grilo et al, 2014) is dependent on the genetic background of S. aureus. Thus, with the purpose of characterize the S. aureus ATL protein, regarding strain specificity, different approaches were designed and different genetic backgrounds were used, namely strains COL (HA-MRSA, archaic clone), WIS (CA-MRSA, Taiwan clone), HDE288 (HA-MRSA, pediatric clone), UAMS-1 (MSSA, , JE2 (CA-MRSA, USA300), NCTC8325 (MSSA, laboratory strain) and MW2 (CA-MRSA, USA400).
1. Determination of atl gene SNPs
In order to compare the nucleotide sequence of atl gene of the different strains, the atl gene was fully sequenced for strains for which the genome sequence was still undetermined, namely WIS, HDE288 and JE2.
The sequence length of atl gene, including the promoter region, is approximately 4000 bps; amplification of this region was performed in 6 separate DNA fragments (fragments A to F), as shown on Table 4 and Figure 7.
Table 4– atl gene fragments amplified and primers used for PCR amplification.
DNA fragment Primers Length (bps)
A PcompATLfwSalI + PAMR2rvSalI 1431
B PR1R2R3GLfwNcoI + PAMrvSalI 1053
C PR2R3GLfwNcoI + pGLSH3rvSalI 1392
D PGLfwBamHI + PGLrvSalI 1446
E PreAM fw + AM rv 941
26 Figure 7 –atl PCR reactions scheme. The atl sequence, including the promoter was approximately 4500
bps. Six fragments of approximately 1000 pbs, designated A to F, were amplified and sequenced.
27
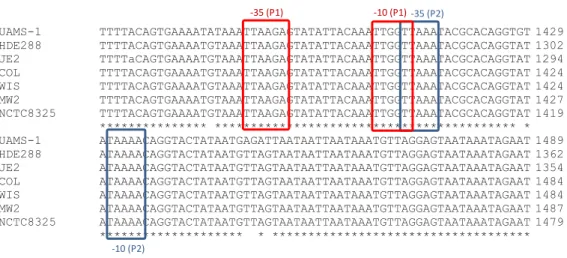
UAMS-1 TTTTACAGTGAAAATATAAATTAAGAGTATATTACAAATTGGTTAAATACGCACAGGTGT 1429 HDE288 TTTTACAGTGAAAATGTAAATTAAGAGTATATTACAAATTGGTTAAATACGCACAGGTAT 1302 JE2 TTTTaCAGTGAAAATGTAAATTAAGAGTATATTACAAATTGGTTAAATACGCACAGGTAT 1294 COL TTTTACAGTGAAAATGTAAATTAAGAGTATATTACAAATTGGTTAAATACGCACAGGTAT 1424 WIS TTTTACAGTGAAAATGTAAATTAAGAGTATATTACAAATTGGTTAAATACGCACAGGTAT 1424 MW2 TTTTACAGTGAAAATGTAAATTAAGAGTATATTACAAATTGGTTAAATACGCACAGGTAT 1427 NCTC8325 TTTTACAGTGAAAATGTAAATTAAGAGTATATTACAAATTGGTTAAATACGCACAGGTAT 1419 *************** ****************************************** * UAMS-1 ATAAAACAGGTACTATAATGAGATTAATAATTAATAAATGTTAGGAGTAATAAATAGAAT 1489 HDE288 ATAAAACAGGTACTATAATGTTAGTAATAATTAATAAATGTTAGGAGTAATAAATAGAAT 1362 JE2 ATAAAACAGGTACTATAATGTTAGTAATAATTAATAAATGTTAGGAGTAATAAATAGAAT 1354 COL ATAAAACAGGTACTATAATGTTAGTAATAATTAATAAATGTTAGGAGTAATAAATAGAAT 1484 WIS ATAAAACAGGTACTATAATGTTAGTAATAATTAATAAATGTTAGGAGTAATAAATAGAAT 1484 MW2 ATAAAACAGGTACTATAATGTTAGTAATAATTAATAAATGTTAGGAGTAATAAATAGAAT 1487 NCTC8325 ATAAAACAGGTACTATAATGTTAGTAATAATTAATAAATGTTAGGAGTAATAAATAGAAT 1479 ******************** * ************************************
Figure 8 - Alignment of the two promoter candidates sequences of ATL of S. aureus strains UAMS-1, HDE288, COL, WIS, MW2, NCTC8325 and JE2 (CLUSTAL Omega). In red are highlighted the Promotor 1 (-35 and -10 regions) and in blue the Promotor 2 (-35 and -10 regions).
2. Determination of alterations in ATL protein sequence
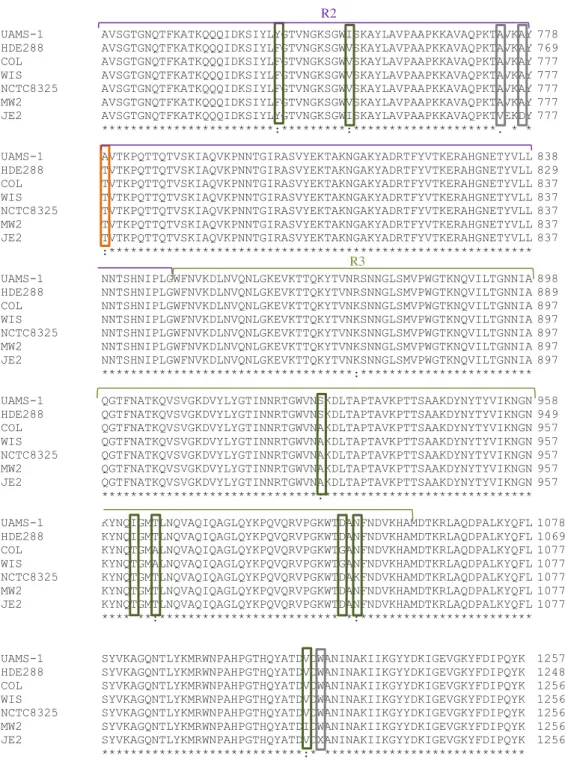
The atl nucleotide sequence of each strain was translated into the corresponding peptide sequence using Expasy Translate tool, and aligned with CLUSTAL Omega software (Figure 9).
In accordance with the differences identified in the nucleotide sequences, the ATL amino acid sequence of UAMS-1 strain was the one that showed less identity to COL, as well as to the other strains. Interestingly, for UAMS-1, most amino acid substitutions occurred in the region corresponding to the pro-peptide (PP). UAMS-1 has one insertion of 9 nucleotides which leads to an insertion of 3 amino acids (KPS) to the protein in the catalytic domain of AM.
The ATL sequence of strain HDE288 showed 5 specific amino acid substitutions, two in the pro-peptide and the one in the R1 repeat, and 8 residues deletion in the PP. The sequence of JE2 showed 5 specific amino acid substitutions, two in the R1 repeat, two in the R2 repeat and the other in the GL domain. Regarding strain WIS, the ATL protein sequence was identical to strain COL, since the two SNPs did not alter the peptide sequence. For strains NCTC8325 and MW2, the ATL sequence was more conserved in comparison to COL: the moderate number of SNP's observed in the gene
-35 (P1) -35 (P2)
-10 (P2)
29
UAMS-1 MAKKFNYKLPSMVALTLVGSAVTAHQVQAAETTQDQTTNKNVLDSNKVKATTEQAKAEVK 60 HDE288 MAKKFNYKLPSMVALTLVGSAVTAHQVQAAETTQDQTTNKNVLDSNKVKATTEQAKAEVK 60 COL MAKKFNYKLPSMVALTLVGSAVTAHQVQAAETTQDQTTNKNVLDSNKVKATTEQAKAEVK 60 WIS MAKKFNYKLPSMVALTLVGSAVTAHQVQAAETTQDQTTNKNVLDSNKVKATTEQAKAEVK 60 NCTC8325 MAKKFNYKLPSMVALTLVGSAVTAHQVQAAETTQDQTTNKNVLDSNKVKATTEQAKAEVK 60 MW2 MAKKFNYKLPSMVALTLVGSAVTAHQVQAAETTQDQTTNKNVLDSNKVKATTEQAKAEVK 60 JE2 MAKKFNYKLPSMVALTLVGSAVTAHQVQAAETTQDQTTNKNVLDSNKVKATTEQAKAEVK 60 ************************************************************
UAMS-1 NPTQNISGTQVYQDPAIVQPKAA-NKTGNAQVNQKVDTTQVNGDTRATQSTTSNNAKPVT 119 HDE288 NPTQNISGTQVYQDPAIVQPKTANNKTGNAQVSQKVDTAQVNGDTRANQSATTNNTQPVA 120 COL NPTQNISGTQVYQDPAIVQPKTANNKTGNAQVSQKVDTAQVNGDTRANQSATTNNTQPVA 120 WIS NPTQNISGTQVYQDPAIVQPKTANNKTGNAQVSQKVDTAQVNGDTRANQSATTNNTQPVA 120 NCTC8325 NPTQNISGTQVYQDPAIVQPKTANNKTGNAQVSQKVDTAQVNGDTRANQSATTNNTQPVA 120 MW2 NPTQNISGTQVYQDPAIVQPKTANNKTGNAQVSQKVDTAQVNGDTRANQSATTNNTQPVA 120 JE2 NPTQNISGTQVYQDPAIVQPKTANNKTGNAQVSQKVDTAQVNGDTRANQSATTNNTQPVA 120 *********************:* ********.*****:********.**:*:**::**:
UAMS-1 KSTNTTAPKTNNNVTSAGYSLVDDEDDNSENQINPELIKSAAKPAALETQYKAAAPKAT- 178 HDE288 KSTSTTAPKTNTNVTNAGYSLVDDEDDNSEHQINPELIKSAAKPAALETQYKAAAP---- 176 COL KSTSTTAPKTNTNVTNAGYSLVDDEDDNSENQINPELIKSAAKPAALETQYKTAAPKAAT 180 WIS KSTSTTAPKTNTNVTNAGYSLVDDEDDNSENQINPELIKSAAKPAALETQYKTAAPKAAT 180 NCTC8325 KSTSTTAPKTNTNVTNAGYSLVDDEDDNSENQINPELIKSAAKPAALETQYKTAAPKAAT 180 MW2 KSTSTTAPKTNTNVTNAGYSLVDDEDDNSENQINPELIKSAAKPAALETQYKAAAPKAAT 180 JE2 KSTSTTAPKTNTNVTNAGYSLVDDEDDNSENQINPELIKSAAKPAALETQYKTAAPKAAT 180 ***.*******.***.**************.*********************:***
UAMS-1 PVAPKAKTEATPKVTTFSASAQPRSAAAAPKTSLPKYKPQVNSSINDYIRKNNLKAPKIE 238 HDE288 ----KAKTEATPKVTTFSTSAQPRSVAATPKTSLPKYKPQVNSSINDYIRKNNLKAPKIE 232 COL TSAPKAKTEATPKVTTFSASAQPRSVAATPKTSLPKYKPQVNSSINDYIRKNNLKAPKIE 240 WIS TSAPKAKTEATPKVTTFSASAQPRSVAATPKTSLPKYKPQVNSSINDYIRKNNLKAPKIE 240 NCTC8325 TSAPKAKTEATPKVTTFSASAQPRSVAATPKTSLPKYKPQVNSSINDYICKNNLKAPKIE 240 MW2 TSAPKAKTEATPKVTTFSASAQPRSVAATPKTSLPKYKPQVNSSINDYIRKNNLKAPKIE 240 JE2 TSAPKAKTEATPKVTTFSASAQPRSVAATPKTSLPKYKPQVNSSINDYIRKNNLKAPKIE 240 **************:******.**:******************** **********
UAMS-1 STTTPTTPSKPSTPSKPSTPSTGKLTVAANNGVAQIKPTNSGLYTTVYDKTGKATNEVQK 478 HDE288 STTTPTTPSKPTTPS---KPSTGKLTVAANNGVAQIKPTNSGLYTTVYDKTGKATNEVQK 469 COL STTTPTTPSKPTTPS---KPSTGKLTVAANNGVAQIKPTNSGLYTTVYDKTGKATNEVQK 477 WIS STTTPTTPSKPTTPS---KPSTGKLTVAANNGVAQIKPTNSGLYTTVYDKTGKATNEVQK 477 NCTC8325 STTTPTTPSKPTTPS---KPSTGKLTVAANNGVAQIKPTNSGLYTTVYDKTGKATNEVQK 477 MW2 STTTPTTPSKPTTPS---KPSTGKLTVAANNGVAQIKPTNSGLYTTVYDKTGKATNEVQK 477 JE2 STTTPTTPSKPSTPS---TPSTGKLTVAANNGVAQIKPTNSGLYTTVYDKTGKATNEVQK 477 ***********:*** .*****************************************
UAMS-1 TFAVSKTATLGNQKFYLVQDYNSGNKFGWVKEGDVVYNTAKSPVNVNQSYSIKPGTKLYT 538 HDE288 TFAVSKTATLGNQKFYLVQDYNSGNKFGWVKEGDVVYNTAKSPVNVNQSYSIKSGTKLYT 529 COL TFAVSKTATLGNQKFYLVQDYNSGNKFGWVKEGDVVYNTAKSPVNVNQSYSIKPGTKLYT 537 WIS TFAVSKTATLGNQKFYLVQDYNSGNKFGWVKEGDVVYNTAKSPVNVNQSYSIKPGTKLYT 537 NCTC8325 TFAVSKTATLGNQKFYLVQDYNSGNKFGWVKEGDVVYNTAKSPVNVNQSYSIKPGTKLYT 537 MW2 TFAVSKTATLGNQKFYLVQDYNSGNKFGWVKEGDVVYNTAKSPVNVNQSYSIKPGTKLYT 537 JE2 TFAVSKTATLGNQKFYLVQDYNSGNKFGWVKEGDVVYNTAKSPVNVNQSYSIKPGTKLYT 537 ***************************************************** ******
UAMS-1 VPWGTSKQVAGSVSGSGNQTFKASKQQQIDKSIYLYGSVNGKSGWVSKAYLVDTAKPTPT 598 HDE288 VPWGTSKQVAGSVSGSGNQTFKASKQLQIDKSIYLYGSVNGKSGWVSKAYLVDTAKPTPT 589 COL VPWGTSKQVAGSVSGSGNQTFKASKQQQIDKSIYLYGSVNGKSGWVSKAYLVDTAKPTPT 597 WIS VPWGTSKQVAGSVSGSGNQTFKASKQQQIDKSIYLYGSVNGKSGWVSKAYLVDTAKPTPT 597 NCTC8325 VPWGTSKQVAGSVSGSGNQTFKASKQQQIDKSIYLYGSVNGKSGWVSKAYLVDTAKPTPT 597 MW2 VPWGTSKQVAGSVSGSGNQTFKASKQQQIDKSIYLYGSVNGKSGWVSKAYLVDTAKPTPT 597 JE2 VPWGTSKQVAGSVSGSGNQTFKASKQQQIDKSIYLYGSVNGKSGWVSKAYLVDTAKPTPA 597 ************************** ********************************:
UAMS-1 PTPKPSTPTTNNKLTVSSLNGVAQINAKNNGLFTTVYDKTGKPTKEVQKTFAVTKEASLG 658 HDE288 PIPKPSTPTTNNKLTVSSLNGVAQINAKNNGLFTTVYDKTGKPTKEVQKTFAVTKEASLG 649 COL PTPKPSTPTTNNKLTVSSLNGVAQINAKNNGLFTTVYDKTGKPTKEVQKTFAVTKEASLG 657 WIS PTPKPSTPTTNNKLTVSSLNGVAQINAKNNGLFTTVYDKTGKPTKEVQKTFAVTKEASLG 657 NCTC8325 PTPKPSTPTTNNKLTVSSLNGVAQINAKNNGLFTTVYDKTGKPTKEVQKTFAVTKEASLG 657 MW2 PTPKPSTPTTNNKLTVSSLNGVAQINAKNNGLFTTVYDKTGKPTKEVQKTFAVTKEASLG 657 JE2 PTPKPSTPTTNNKLTVSALNGVAQINAKNNGLFTTVYDKTGKPTKEVQKTFAVTKEASLG 657 * ***************:******************************************
SP
PP
30
UAMS-1 AVSGTGNQTFKATKQQQIDKSIYLYGTVNGKSGWISKAYLAVPAAPKKAVAQPKTAVKAY 778 HDE288 AVSGTGNQTFKATKQQQIDKSIYLFGTVNGKSGWVSKAYLAVPAAPKKAVAQPKTAVKAY 769 COL AVSGTGNQTFKATKQQQIDKSIYLFGTVNGKSGWVSKAYLAVPAAPKKAVAQPKTAVKAY 777 WIS AVSGTGNQTFKATKQQQIDKSIYLFGTVNGKSGWVSKAYLAVPAAPKKAVAQPKTAVKAY 777 NCTC8325 AVSGTGNQTFKATKQQQIDKSIYLFGTVNGKSGWVSKAYLAVPAAPKKAVAQPKTAVKAY 777 MW2 AVSGTGNQTFKATKQQQIDKSIYLFGTVNGKSGWVSKAYLAVPAAPKKAVAQPKTAVKAY 777 JE2 AVSGTGNQTFKATKQQQIDKSIYLYGTVNGKSGWISKAYLAVPAAPKKAVAQPKTVEKDY 777 ************************:*********:********************. * *
UAMS-1 AVTKPQTTQTVSKIAQVKPNNTGIRASVYEKTAKNGAKYADRTFYVTKERAHGNETYVLL 838 HDE288 TVTKPQTTQTVSKIAQVKPNNTGIRASVYEKTAKNGAKYADRTFYVTKERAHGNETYVLL 829 COL TVTKPQTTQTVSKIAQVKPNNTGIRASVYEKTAKNGAKYADRTFYVTKERAHGNETYVLL 837 WIS TVTKPQTTQTVSKIAQVKPNNTGIRASVYEKTAKNGAKYADRTFYVTKERAHGNETYVLL 837 NCTC8325 TVTKPQTTQTVSKIAQVKPNNTGIRASVYEKTAKNGAKYADRTFYVTKERAHGNETYVLL 837 MW2 TVTKPQTTQTVSKIAQVKPNNTGIRASVYEKTAKNGAKYADRTFYVTKERAHGNETYVLL 837 JE2 TVTKPQTTQTVSKIAQVKPNNTGIRASVYEKTAKNGAKYADRTFYVTKERAHGNETYVLL 837 :***********************************************************
UAMS-1 NNTSHNIPLGWFNVKDLNVQNLGKEVKTTQKYTVNRSNNGLSMVPWGTKNQVILTGNNIA 898 HDE288 NNTSHNIPLGWFNVKDLNVQNLGKEVKTTQKYTVNRSNNGLSMVPWGTKNQVILTGNNIA 889 COL NNTSHNIPLGWFNVKDLNVQNLGKEVKTTQKYTVNKSNNGLSMVPWGTKNQVILTGNNIA 897 WIS NNTSHNIPLGWFNVKDLNVQNLGKEVKTTQKYTVNKSNNGLSMVPWGTKNQVILTGNNIA 897 NCTC8325 NNTSHNIPLGWFNVKDLNVQNLGKEVKTTQKYTVNKSNNGLSMVPWGTKNQVILTGNNIA 897 MW2 NNTSHNIPLGWFNVKDLNVQNLGKEVKTTQKYTVNKSNNGLSMVPWGTKNQVILTGNNIA 897 JE2 NNTSHNIPLGWFNVKDLNVQNLGKEVKTTQKYTVNKSNNGLSMVPWGTKNQVILTGNNIA 897 ***********************************:************************
UAMS-1 QGTFNATKQVSVGKDVYLYGTINNRTGWVNSKDLTAPTAVKPTTSAAKDYNYTYVIKNGN 958 HDE288 QGTFNATKQVSVGKDVYLYGTINNRTGWVNSKDLTAPTAVKPTTSAAKDYNYTYVIKNGN 949 COL QGTFNATKQVSVGKDVYLYGTINNRTGWVNAKDLTAPTAVKPTTSAAKDYNYTYVIKNGN 957 WIS QGTFNATKQVSVGKDVYLYGTINNRTGWVNAKDLTAPTAVKPTTSAAKDYNYTYVIKNGN 957 NCTC8325 QGTFNATKQVSVGKDVYLYGTINNRTGWVNAKDLTAPTAVKPTTSAAKDYNYTYVIKNGN 957 MW2 QGTFNATKQVSVGKDVYLYGTINNRTGWVNAKDLTAPTAVKPTTSAAKDYNYTYVIKNGN 957 JE2 QGTFNATKQVSVGKDVYLYGTINNRTGWVNAKDLTAPTAVKPTTSAAKDYNYTYVIKNGN 957 ******************************:*****************************
UAMS-1 KYNQIGMTLNQVAQIQAGLQYKPQVQRVPGKWTDANFNDVKHAMDTKRLAQDPALKYQFL 1078 HDE288 KYNQIGMTLNQVAQIQAGLQYKPQVQRVPGKWTDANFNDVKHAMDTKRLAQDPALKYQFL 1069 COL KYNQTGMALNQVAQIQAGLQYKPQVQRVPGKWTGANFNDVKHAMDTKRLAQDPALKYQFL 1077 WIS KYNQTGMALNQVAQIQAGLQYKPQVQRVPGKWTGANFNDVKHAMDTKRLAQDPALKYQFL 1077 NCTC8325 KYNQTGMTLNQVAQIQAGLQYKPQVQRVPGKWTDAKFNDVKHAMDTKRLAQDPALKYQFL 1077 MW2 KYNQTGMTLNQVAQIQAGLQYKPQVQRVPGKWTDANFNDVKHAMDTKRLAQDPALKYQFL 1077 JE2 KYNQTGMTLNQVAQIQAGLQYKPQVQRVPGKWTDANFNDVKHAMDTKRLAQDPALKYQFL 1077 **** **:************************* *:************************
UAMS-1 SYVKAGQNTLYKMRWNPAHPGTHQYATDVDWANINAKIIKGYYDKIGEVGKYFDIPQYK 1257 HDE288 SYVKAGQNTLYKMRWNPAHPGTHQYATDVDWANINAKIIKGYYDKIGEVGKYFDIPQYK 1248 COL SYVKAGQNTLYKMRWNPAHPGTHQYATDVDWANINAKIIKGYYDKIGEVGKYFDIPQYK 1256 WIS SYVKAGQNTLYKMRWNPAHPGTHQYATDVDWANINAKIIKGYYDKIGEVGKYFDIPQYK 1256 NCTC8325 SYVKAGQNTLYKMRWNPAHPGTHQYATDVDWANINAKIIKGYYDKIGEVGKYFDIPQYK 1256 MW2 SYVKAGQNTLYKMRWNPAHPGTHQYATDIDWANINAKIIKGYYDKIGEVGKYFDIPQYK 1256 JE2 SYVKAGQNTLYKMRWNPAHPGTHQYATDVDXANINAKIIKGYYDKIGEVGKYFDIPQYK 1256 ****************************:* ****************************
Figure 9 - Alignment of the amino acid sequence of ATL of S. aureusstrains UAMS-1, HDE288,
COL, WIS, MW2, NCTC8325 and JE2 (CLUSTAL Omega). In red are highlighted the amino acid deletions, in purple the insertions. Regarding amino acid substitutions, in orange are highlighted UAMS-1, in purple are JE2. In blue are HDE288 and the remaining strains in green.
R2
31
Table 5–SNP’s, insertions and deletions in the atl gene from strains used in this study, and amino acid substitutions observed.
SNP’s Insertion Delection AA Substitution Position Substitution Position Nucleotide Position Position
NTCT 8325
2039 CT - - - 230 RC
4424 GA - - - 1025 AT
4503 GA - - - 1051 GD
4510 CA - - - 1053 NK
MW2
1868 AG - - - 173 TA
4424 GA - - - 1025 AT
4503 GA - - - 1051 GD
5027 GA - - - 1126 VI
UAMS-1
(SNP’s >100 but
only 24 cause amino acid substitution)
1595 AG 82 TA
1660-1606 84 -
1629 GA 93 SN
1646 GA 99 AT
1674 AC 108 NT
1682 GA 111 AT
1697 AG 116 TA
1702 GA 120 AT
1709 GA 125 SN
1746 CA 133 TN
1889 AC 137 NS
1892 AG 174 TA
1895 GA 179 AT
- - 1893-1894 180 -
1896 AC 181 TP
- - 1897 182 SV
1968 TC 206 VA
2008 AG 209 TA
2140 AT 252 TS
2329 AC 256 KT
3576 TA 742 FY
32
4221 AG 778 TA
4416 GA 1022 TI
4424 GA 1025 AT
1051 GD
2659 ACCATCAAC - 255 KPS
WIS 1109 1197 AGA G - - - - - - - - - -
HDE288
1802 AC - - - 152 NH
1868 AG 174 TA
- - 1868-1992 176-184 -
1946 GA 199 TA
2942 CT - - - 531 PS
3042 AT - - - 563 QL
3147 CT - - - 599 TI
3802 AG - - - 874 KR
4133 GT - - - 928 AS
4416 CT - - - 1022 TI
4424 GA - - - 1025 AT
4503 GA - - - 1051 GD
1071 G - - -
JE2
2619 CG - - - 252 TS
2686 TA - - - 256 KT
2743 AT - - - 597 TA
2942 CT - - - 615 SA
2998 TC - - - 742 FY
3042 AT - - - 752 VI
3147 CT - - - 773 AV
4156 TC - - - 776 AD
4424 GA - - - 1025 AT
33
3. ATL protein expression along growth
In order to analyze the ATL protein expression over time and to determine if the expression pattern and the proteolytic profile varies from strain to strain, the relative amount of AM and GL was assessed by Western blotting, for strains COL, NCTC 8328, WIS, HDE288, JE2, UAMS-1 and MW2. Western blotting (or protein immunoblot) is an analytical technique that can be used to detect specific proteins in a complex extract, using specific antibodies. We used the previously available anti-GL and anti-AM raised antibodies raised against proteins GL-C (GL without repeats domain) and ATL-H (AM without repeats domain) respectively (Grilo et al, unpublished). The amount of ATL protein was assessed in the cell supernatant fraction (spent medium) (Figure 11, panel A) and also in the cell wall fraction (Figure 11, panel B).
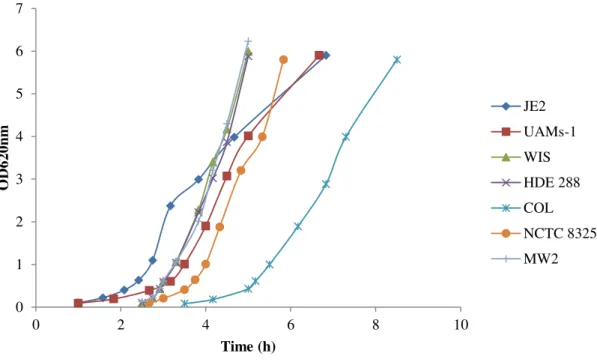
Culture samples were taken at discrete time points along the growth curve (Figure 10).
Figure 10 – Growth curve of strains COL, WIS, HDE288, UAMS-1, JE2, NCTC8325 and MW2 in complex medium at 37ºC.
0 1 2 3 4 5 6 7
0 2 4 6 8 10
34
3.1.Expression analysis using anti-GL antibody
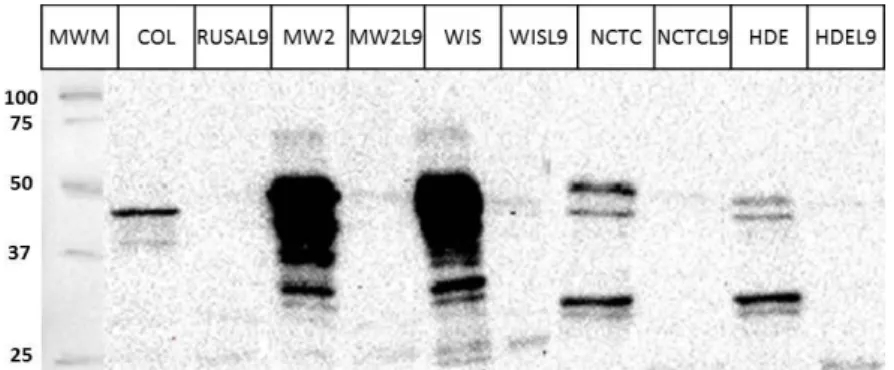
The protein extracts were separated by SDS-PAGE and transferred to a nitrocellulose membrane that was then hybridized with the anti-GL antibody. By analyzing the apparent molecular weight of the bands obtained, the anti-GL antibody was observed to hybridize with the full ATL protein (137.5 kDa), the ATL without the PP (121 kDa) and also with more than one processed form of the GL domain, the full form R3GL (53.6 kDa), and GL (40.5 kDa).
35 Figure 11 – GL expression along time. Western blotting was performed for protein extracts from strains WIS, HDE288, JE2, UAMS-1, COL, NCTC8325 and MW2, using anti-GL specific antibody. (A) Cell supernatant; (B) Cell wall fraction. A- OD 0.2, B- OD 0.4, C- OD 0.6, D- OD 1, E- OD 2, F- OD 3, G- OD 4, H- OD 6, I- OD 11.
Differences not only in the amount of ATL protein produced along time, but also in the number and molecular weight of the protein bands obtained, were observed between the 7 strains analyzed.
Overall, for most strains, ATL protein (the unprocessed form or the AM-R1R2R3-GL form) seemed to accumulate firstly in the supernatant (at OD~0.2-0.4) and only later was the processed GL domain targeted to the cell wall (starting at OD~0.4).
AM-36 R1R2R3-GL form were not observed in the cell wall fraction for the period of growth analyzed.
Regarding GL domain, several processed forms accumulated together with the ATL full protein in the supernatant of most strains except COL. For strains HDE288 and JE2, GL domain began to accumulate in the supernatant during exponential phase (OD-0.1) and later (OD-4) for strains WIS, UAMS-1 and NCTC8325. For strain MW2, GL domain was only detected during late stationary phase (OD-11). At the cell wall level, GL domain was present in one single form (corresponding to one band) for strains HDE288 and MW2 or as several processed bands (corresponding to multiple bands) for strains WIS, JE2, UAMS-1, COL and NCTC8325. These distinct GL bands may correspond to different cleavage events of GL protein.
Regarding the amount of GL domain present in the cell wall fraction, it was interesting to observe three different patterns: for strains WIS, HDE288, JE2 and UAMS-1, GL domain showed an accumulation peak at exponential phase (OD-1) followed by a rapid decrease at OD-2 and finally a steady increase; for strains COL and NCTC8325, GL domain only started to accumulate at late exponential phase (OD~3-4), while for strain MW2, it constantly accumulated along time.
3.2. Expression analysis using anti-AM antibody
38 Figure 12 – AM expression along time. Western blotting was performed for protein extracts from strains WIS, HDE288, JE2, UAMS-1, COL, NCTC8325 and MW2, using anti-AM specific antibody. (A) Cell supernatant; (B) Cell wall fraction. A- OD 0.2, B- OD 0.4, C- OD 0.6, D- OD 1, E- OD 2, F- OD 3, G- OD 4, H- OD 6, I- OD 11.
Differences in the expression pattern of AM domain along time and amongst strains was even more striking than for GL domain.
While WIS, COL and UAMS-1 showed low and poorly consistent amounts of AM in the supernatant, NCTC8325 and MW2 only showed AM presence at late stationary phase (OD 6 to 11). HDE288 did not present AM in the supernatant until late exponential phase (OD 1), and JE2 did not present AM in the supernatant in the stationary phase.
Regarding the amount of AM domain present in the cell wall fraction, it was interesting to observe, as for GL domain, three different patterns: for strains WIS, HDE288 and UAMS-1, AM domain showed an accumulation peak at exponential phase (OD-1) followed by a rapid decrease at OD-2 and finally a steady increase; for strains COL, NCTC8325 and MW2, AM domain did not accumulate at the cell wall fraction; for strain JE2, it constantly accumulated along time.
4. The association between DNA and GL lytic activity