i
Business Intelligence to support NOVA IMS Academic
Services BI System
João Sequeira Marques Ribeiro
i
201
6
Business Intelligence to support NOVA IMS Academic Services BI System
João Sequeira Marques Ribeiro
ii
NOVA Information Management School
Instituto Superior de Estatística e Gestão de Informação
Universidade Nova de Lisboa
BUSINESS INTELLIGENCE TO SUPPORT NOVA IMS ACADEMIC
SERVICES BI SYSTEM
by
João Sequeira Marques Ribeiro
Project Work presented as partial requirement for obtaining the Master’s degree in Information Management, with a specialization in Specialization in Knowledge Management and Business Intelligence
Advisor: Roberto Henriques, Ph.D.
Co Advisor: Jorge Nelson Gouveia de Sousa Neves
iii
ABSTRACT
Kimball argues that Business Intelligence is one of the most important assets of any organization, allowing it to store, explore and add value to the organization’s data which will ultimately help in the decision making process.
Nowadays, some organizations and, in this specific case, some schools are not yet transforming data into their full potential and business intelligence is one of the most known tools to help schools in this issue, seen as some of them are still using out-dated information systems, and do not yet apply business intelligence techniques to their increasing amounts of data so as to turn it into useful information and knowledge.
In the present report, I intend to analyse the current NOVA IMS academic services data and the rationales behind the need to work with this data, so as to propose a solution that will ultimately help the school board or the academic services to make better-supported decisions. In order to do so, it was developed a Data Warehouse that will clean and transform the source database. Another important step to help the academic services is to present a series of reports to discover information in the decision making process.
KEYWORDS
iv
INDEX
1.
Introduction ... 1
1.1. Contextualization ... 1
1.2. Goals ... 2
1.3. Project Approach ... 2
2.
Literature review ... 4
2.1. Introduction ... 4
2.2. Initial Planning ... 5
2.3. Data Warehouse Architectures ... 7
2.3.1.
Introduction ... 7
2.3.2.
Kimball DW Architecture ... 8
2.3.3.
Other Architectures ... 15
2.4. Metadata ... 18
2.5. Optimization and Scalability ... 19
2.6. Management Processes ... 20
2.7. Infrastructure ... 23
2.8. Reporting Tools ... 25
2.9. Trends ... 26
2.9.1.
Cloud BI ... 26
2.9.2.
Big Data... 26
2.9.3.
In Memory Analytics ... 28
2.9.4.
Predictions ... 30
2.10.
Development Methodologies ... 30
2.10.1.
Waterfall ... 30
2.10.2.
Agile ... 31
3.
Methodology ... 34
3.1. Planning ... 34
3.2. Analysis ... 35
3.2.1.
Project Methodology ... 35
3.2.2.
Software ... 36
3.3. Implementation ... 36
3.3.1.
Source Database ... 36
3.3.2.
Data Warehouse Design ... 36
v
3.4. Reporting Design ... 67
3.4.1.
General ... 67
3.4.2.
College Enrolment ... 69
3.4.3.
Course Enrolment Final Grade ... 71
3.4.4.
Partial Grades ... 74
3.4.5.
Work Allocation ... 75
4.
Conclusions ... 77
5.
Bibliography ... 78
vi
LIST OF FIGURES
Figure 1.1
–
Sources of data kept and managed by the Information System of the Academic
Services of a University ... 2
Figure 2.1
–
Core Elements of the Kimball DW Architecture (Kimball & Ross, 2013) ... 9
Figure 2.2
–
Example of Hierarchy (Moody & Kortink, 2000) ... 10
Figure 2.3
–
Generic Structure of a Star Schema ... 12
Figure 2.4
–
Example of a simplified illustration of the independent data mart architecture
(Kimball & Ross, 2013)... 16
Figure 2.5
–
Example of a simplified illustration of the hub-and-spoke Corporate Information
Factory architecture (Kimball & Ross, 2013) ... 17
Figure 2.6
–
Hybrid architecture with 3NF structures and dimensional Kimball presentation
area (Kimball & Ross, 2013) ... 18
Figure 2.7
–
How in-memory analytics, interactive visualization and associative search affect
businesses ... 29
Figure 2.8
–
Example of Waterfall Methodology ... 31
Figure 3.1
–
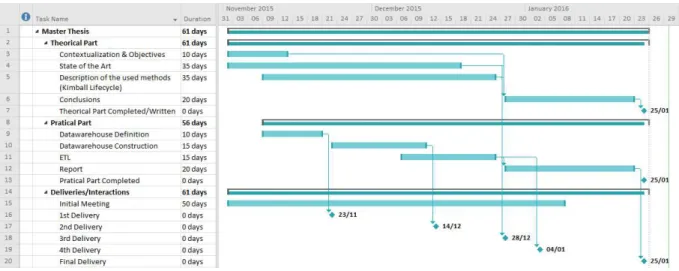
Master Thesis project Gantt chart ... 34
Figure 3.2
–
Star schema diagram for Fact College Enrolment ... 37
Figure 3.3
–
Star schema diagram for Fact Course Enrolment Final Grade ... 37
Figure 3.4
–
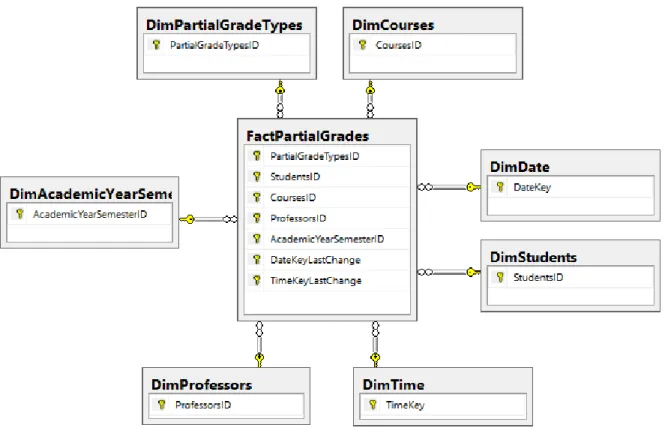
Star schema diagram for Fact Partial Grades ... 38
Figure 3.5
–
Star schema diagram for Fact Work Allocation ... 38
Figure 3.6
–
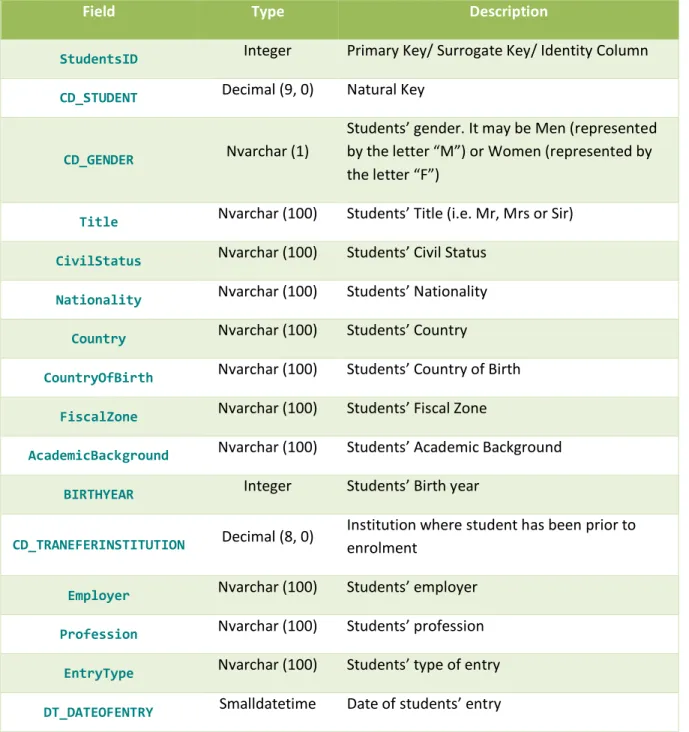
Dimension Students details ... 45
Figure 3.7
–
SSIS Main package ... 51
Figure 3.8
–
SSIS Load Dimensions package ... 51
Figure 3.9
–
SSIS Load Facts package ... 52
Figure 3.10
–
ETL process for Dimension Academic Year Semester ... 53
Figure 3.11
–
ETL process for Dimension Class ... 53
Figure 3.12
–
ETL process for Dimension Courses ... 54
Figure 3.13
–
ETL process for Dimension Date ... 54
Figure 3.14
–
ETL process for Dimension Partial Grade Types ... 55
Figure 3.15
–
ETL process for Dimension Professors ... 56
Figure 3.16
–
Hierarchy from Dimension Programs Specializations Plans ... 56
Figure 3.17
–
ETL process for Dimension Program Specialization Plan ... 57
Figure 3.18
–
ETL process for Dimension Status ... 58
Figure 3.19
–
ETL process for Dimension Students
–
Part 1 ... 59
vii
Figure 3.21
–
ETL process for Dimension Term ... 61
Figure 3.22
–
ETL process for Fact College Enrolment ... 62
Figure 3.23
–
ETL process for Fact Course Enrolment Final Grade ... 64
Figure 3.24
–
ETL process for Fact Partial Grades ... 65
Figure 3.25
–
ETL process for Fact Work Allocation ... 66
Figure 3.26
–
Nova IMS Map of Students Country ... 68
Figure 3.27
–
Total Students by Gender and by Civil Status ... 69
Figure 3.28
–
Courses Approved VS Not Approved by Academic Year and by Study Plan Year
... 70
Figure 3.29
–
Total students enrolled in a Program and Specialisation... 71
Figure 3.30
–
Total Students enrolled by Class Type and the Average Grade of Students by
Year and by Periodicity ... 72
Figure 3.31
–
Total Students and Average Students Grade by Term ... 73
Figure 3.32
–
Number of Course with 130+ Students and Total Students by Course Status .. 74
Figure 3.33
–
Students Partial Grades Table ... 75
viii
LIST OF TABLES
Table 2.1
–
Differences between Operational Database and Data Warehouse (Santos &
Ramos, 2009) ... 7
Table 2.2
–
Differences between ROLAP, MOLAP, and HOLAP (Kimball & Ross, 2013) ... 14
Table 2.3
–
Benefits and Risks of using a Business Intelligence cloud-based solution (Tamer,
Kiley, Ashrafi, & Kuilboer, 2013)... 24
Table 2.4
–
Example of two Business Intelligence Software Solutions (Business-software,
2016) ... 25
Table 2.5
–
Characteristics of In-Memory BI Solutions (Muntean, 2014) ... 30
Table 2.6
–
Manifesto for Agile Software Development (Beedle, et al., 2001) ... 32
Table 2.7
–
Twelve Principles behind the Agile Manifesto (Beedle, et al., 2001) ... 33
Table 3.1
–
Dimension Academic Year Semester details ... 39
Table 3.2
–
Dimension Class details ... 40
Table 3.3
–
Dimension Courses details... 40
Table 3.4
–
Dimension Date details ... 41
Table 3.5
–
Dimension Partial Grade Type details ... 42
Table 3.6
–
Dimension Professors details ... 42
Table 3.7
–
Dimension Program, Specialization and Plan details ... 43
Table 3.8
–
Dimension Status details ... 44
Table 3.9
–
Dimension Term details ... 45
Table 3.10
–
Dimension Time details ... 46
Table 3.11
–
Fact College Enrolment details ... 48
Table 3.12
–
Fact Course Enrolment Final Grade details ... 49
Table 3.13
–
Fact Partial Grades details ... 49
Table 3.14
–
Fact Work Allocation details ... 50
Table 6.1
–
SQL command for select the source data for Dimension Academic Year Semester
... 81
Table 6.2
–
SQL command for select the source data for Dimension Partial Grade Type ... 82
Table 6.3
–
SQL command for select the source data for Dimension Program Specialization
Plan ... 82
Table 6.4
–
SQL command for select the source data for Dimension Students ... 83
Table 6.5
–
SQL command to populate Dimension Time ... 85
Table 6.6
–
SQL command for select the source data for Fact College Enrolment ... 85
ix
Table 6.8
–
SQL command for select the source data for Fact Work Allocation ... 86
Table 6.9
–
SQL command for select the source data for Fact Partial Grades ... 86
Table 6.10
–
SQL command for lookup AcademicYearSemesterID in Fact Partial Grades ... 86
Table 6.11
–
SQL command to select only DimProfessors latest data ... 87
x
LIST OF ABBREVIATIONS AND ACRONYMS
IMS Information Management School BI Business Intelligence
IT Information Technology IS Information Systems EDM Enterprise Data Model DM Data Mart
OLTP On Line Transaction Processing databases DW Data Warehouse
3NF Third Normal Form
DMS Database Management Systems
RDMS Relational Database Management Systems ER Entity Relationship
ERP Enterprise Resource Planning CRM Customer Relationship Management SCM Supply Chain Management
OLAP Online Analytical Processing
MOLAP Multidimensional Online Analytical Processing HOLAP Hybrid Online Analytical Processing
ROLAP Relational Online Analytical Processing CIF Corporate Information Factory
xi SQL Structured Query Language
NoSQL Not Only SQL IoT Internet of Things
1
1.
INTRODUCTION
The aim of this Master thesis project is the development of a business intelligence solution to analyse the data from the Academic Services of Nova Information Management School. Consequently, the objective is to present and review conceptual and practical approaches. Therefore, during this project the chosen business intelligence solution will be implemented, which will be followed by the delivery of dashboards for data analysis, allowing the academic services to have a clearer understanding about the data that is producing.
1.1.
C
ONTEXTUALIZATIONNowadays, organisations are creating and capturing more data than ever before. It is by itself a whole new challenge for companies, which struggle to manage increasingly great amounts of data growing at a rapid rate. In order to deal with this new paradigm, Enterprises turn to Business Intelligence theories and technologies to extract the maximum amount of information from this data so as to make data driven business decisions. In fact, Business Intelligence systems are now quite advanced in some organisations. Therefore, the present project aims at suggesting a Business Intelligence method of developing a Data Warehouse following Kimball’s approach that could be used by Higher Education Institutions to extract and analyse data, and ultimately make better-informed decisions (PwC, 2012).
2 Figure 1.1 – Sources of data kept and managed by the Information System of the Academic Services
of a University
1.2.
G
OALSThe project goal is to provide dashboard(s) to help analyse the extracted data from the NOVA IMS Academic Services Information System using a Business Intelligence approach.
Furthermore, the aim of this project discloses in the following objectives:
1.
Analyse the data provided by the Academic Services of Nova IMS
2.
Build a Data Warehouse oriented to the main data sources of the Information
System of the Academic Services of Nova IMS (College Enrolment, Workout
Allocation, Partial Grades and Course Final Grades)
3.
Build Dashboards for each source of data of the Information System of the
Academic Services of Nova IMS
1.3.
P
ROJECTA
PPROACHBusiness Intelligence is a technique to transform data and to guide decisions for smart business operations. With that in mind, this project will analyse different Business Intelligence approaches so as to find the most appropriate one to help the academic services in their decision making process. Therefore, we will present several Business Intelligence methods and techniques, find the most suitable for the academic services of a University, apply it to the data it currently manages and deliver a dashboard with the chosen reporting tool.
4
2.
LITERATURE REVIEW
2.1.
I
NTRODUCTIONThe term Business Intelligence was firstly defined by the IBM researcher Hans Peter Luhn (1958), as the ability to apprehend the interrelationships of presented facts in such a way as to guide action towards a desired goal (Luhn, 1958).
Later in 1989, Howard Dresner suggested that Business Intelligence was an umbrella term to describe concepts and methods to improve businesses’ decision making by using fact-based support systems. In late 1990s this definition was widespread (Cebotarean, 2011).
Nowadays, data is growing at a rapid rate. Enterprises are turning to Business Intelligence theories and technologies in order to extract the maximum amount of information from this data so as to allow their employees to make better data-driven business decisions (Obeidat, North, Richardson, & Rattanak, 2015). These days, how companies treat their data can determine the success (or failure) of the most important business decisions. The companies that can access the information they need, when they need it – and trust its accuracy – have the upper hand when it matters. Companies today are creating and capturing more information than ever before, which makes their challenge harder, instead of easier (PwC, 2012).
According to Obeidat, North, Richardson, & Rattanak (2015), Business Intelligence applications are periodically used in a popular of search-based applications within a variety of fields, such as Business, Marketing, Law, Education, Visualization, Finance, Engineering, Security Medicine, Health Informatics. Although BI is widely used in private or public organisations for both ordinary business and Internet based business, BI applications are growing in many diverse fields. For instance, in the areas of Mobile Device, Fraud Detection and even in Chronic Disease Management, studies are beginning to designate the benefits of BI applications.
In order to discover different ways on how to handle the subject presented by this project it is important to investigate the current state of art in the Business Intelligence world. Therefore, the investigation will be divided into different sections where different chapters regarding Business Intelligence are presented.
The first section, “Initial Planning”, contains a high-level overview of what steps should be completed in order to start the planning of building a Data Warehouse. This section although very important is sometimes missed when a company starts to design the Data Warehouse.
The second section, “Data Warehouse”, has the core of this literature review, starting with a brief introduction of the concept of Data Warehouse as well as the goals and benefits of it. Also in this section there are four additional major sub-sections in which different approaches on how to design a Data Warehouse are presented.
5 After metadata, the next section is “Optimization and Scalability” and it explains the scalability major issues and also the challenges that may occur while implementing new solutions.
The next section is “Management Processes” and it focuses on the problem in which this area is usually forgotten in organizations. Another topic is the importance of having a good management, information and data quality. Finally, it will also address the need of having data warehouse policies/administration and consistency.
The next section is “Infrastructure” and it will describe the advantages and impact of data acquisition and data storage have dropped the price in the last years. Another major debate is the strategy of organizations about where to have the data, if locally or in the cloud.
The next section is “Reporting Tools” and it will detail the different Reports/ Dashboard Tools in the market nowadays. This research will show which tool suits better the project.
The next section is “Trends”, aiming primarily to the evolution of the Business Intelligence being more focused on data exploration and visualization. Another trend is the use of web technologies and smartphones, which is not entirely new but is growing more and more. Finally, this section will also include some prediction in the area.
The last section “Development Methodologies” is composed by the different development methodologies that are currently in use in the development market. This master thesis project will be based on Agile methodology.
2.2.
I
NITIALP
LANNINGThe initial planning of a Data Warehouse starts with the requirements like business need, outputs, expectations, indication of a scope for the data required and how it should be delivered. It also must be accompanied by defining a subject model1, beginning to document the understanding of data,
helping to communicate the scope of the data warehouse and providing a context for later data models.
The requirements analysis is the succeeding step and they are often stated in a functional form. According to Boateng, Singh, Greeshma & Singh (2012) the following factors affect the architectures selection decision:
Nature of end-user tasks
Information interdependence between organizational units
Social/political factors
Constraints on possessions
Professed ability of the in-house IT staff
Uppe
r management’s information needs
6
Necessity of need for a data warehouse
Strategic view of the data warehouse former to implementation
Compatibility with existing system
Technical Issues
Also according to Boateng, Singh, Greeshma & Singh (2012), the following questions will impact when deciding which architecture should be used:
What tools will be used to sustain data recovery and analysis?
Which database management system should be used?
Will data migration tools be used to load the data warehouse?
Will parallel processing or partitioning be used?
In agreement with Moody & Kortink (2000), these are essential steps that need to be completed for developing a Data Warehouse. These steps may be found below:
1.
Develop Enterprise Data Model
2(EDM)
2.
Design Data Warehouse
–
based on the enterprise data model, but will be a
subset of the model which is relevant for decision support purposes
3.
Classify Entities
–
classify entities in the data warehouse model as either
transaction, component or classification entities
4.
Identify Hierarchies
–
identify the hierarchies which exist in the data model
5.
Design Data Marts (DM)
–
develop star cluster schemas for each transaction
entity in the data warehouse model. Each star cluster will consist of a fact table
and a number of dimension and sub dimension tables. This minimises the
number of tables while avoiding overlap between dimensions
There are two major architectures when designing Data Warehouses. The first architecture belongs to Bill Inmon, known as corporate information factory, which follows a top-down design. Starting with a normalized data model it is then defined the dimensional data marts, which contains data required for specific departments that are created from the data warehouse. This architecture is also organised around the applications of the company (Inmon, 2002). The second one presented by Ralph Kimball, known as dimensional data warehouse architecture, considered a bottom-up design in which business users have a simple dimensional structure at first and when combined together it will create a broad Data Warehouse. It is a design to match the fundamental human need for simplicity.
7 Simplicity is critical because it ensures that users can easily understand the data, as well as allows software to navigate and deliver results quickly and efficiently (Kimball & Ross, 2013).
A Data Warehouse is a database that is managed independently of an Operational database (OLTP - On Line Transaction Processing databases), according to Santos & Ramos (2009). The Table 2.1 illustrates the main differences between a Data Warehouse and an Operational database.
Operational Database
Data Warehouse
Operational Purposes
Records history
Read/Write access
Read-only access
Pre-defined transactions access
Periodic reports and ad hoc access
Access to a small amount of records
Access to a huge amount of records
Refresh of data near real time
Scheduled data loads
Optimized structure for updates
Optimized structure for processing issues
Table 2.1 – Differences between Operational Database and Data Warehouse (Santos & Ramos, 2009)
Table 2.1 illustrates that both types of databases serve different purposes. The operational
database aims to handle near real time transactions (i.e. credit cards transactions) while the
data warehouse is more dedicated for analysing a bugger volume of data. All these
differences must be taken into account in the process of selecting a new database (Santos &
Ramos, 2009).
2.3.
D
ATAW
AREHOUSEA
RCHITECTURES2.3.1.
Introduction
As stated by Kimball & Ross (2013), information is one of the most important assets of any organization and it is practically always used for two purposes: operational record keeping and analytical decision making. Simply speaking, the operational systems are where you put the data in, and the DW/BI system is where you get the data out.
Data Warehousing is a technique of bringing collectively all of a company’s data from different computer systems, together with those connecting to customers, employees, vendors, product, inventory, and financial. The data warehouse connects different database together in order to offer a more inclusive data set for making decision (Boateng, Singh, Greeshma, & Singh, 2012).
There are numerous goals of Data Warehousing and Business Intelligence systems that should be transformed into requirements for the DW system, as reported by Kimball & Ross (2013) it must:
8
Present information consistently
Adapt to regular change
Present information in a timely way
Secure support that protects the information resources
Serve as the confident and trustworthy foundation for improved decision
making
The business community must accept the DW system to deem it successful
Despite all of the above requirements being important, the last two, “the data warehouse to serve as the authoritative and trustworthy foundation for improved decision making” and “that the business community should accept a data warehouse in order for it to be successful“ are the most overlooked ones. The success of a data warehouse depends not only on the best technicians but also on the best business users, which only by combining both skills the data warehouse will be successfully delivered (Kimball & Ross, 2013).
It is very important to understand that the key to long-term success in query performance, better maintainability, and robust recovery options is to have the right data warehouse foundation and data warehouse design (Petrenko, Rada, Fitzsimons, McCallig, & Zuzarte, 2012).
2.3.2.
Kimball DW Architecture
2.3.2.1.
Dimensional Modeling
Dimensional modelling is broadly acknowledged as the favourite technique for presenting analytic data because it addresses two simultaneous requirements. Firstly, it delivers data that’s logical to the business users and in second it delivers fast query performance. The dimensional modeling is a technique known for being simple, in consonance with Kimball & Ross (2013).
In line with Singh, Singh, & Sriveni (2010), a data warehouse with dimensional modeling is denormalized by nature it is used to transform business rules into useful information as it is the collection of archived operational data which is useful in tactical and strategic business decisions. Although dimensional models are often instantiated in relational database management systems (RDBMS), they are quite different from third normal form (3NF) models3 (Kimball & Ross, 2013).
9 Figure 2.1 – Core Elements of the Kimball DW Architecture (Kimball & Ross, 2013)
Figure 2.1 displays Kimball’s data warehouse architecture where it is divided in four main stages. The first is the source transactions (detailed on section 2.3.2.3) which consists in source systems that capture business’s transactions. After, the Extract, Transform and Load (ETL) which is made of (more detailed on section 2.3.2.4) a work area, data structures and a set of processes. The ETL is followed by the Presentation Area (more detailed on section 2.3.2.5) where the data is organised and stored and where the business may start to access. Finally, the last price to completely connect the business with the data presentation layer, the business intelligence applications (more detailed on section 2.3.2.6) that enables the business users to use the presentation area for analytic decision making where a range of capabilities are provided.
2.3.2.2.
Hierarchies
As reported by Moody & Kortink (2000), hierarchies are an extremely important concept in dimensional modelling, and form the primary basis for deriving dimensional models from Entity Relationship (ER) models4. Most dimension tables contain embedded hierarchies. A hierarchy in an
Entity Relationship model is any sequence of entities joined together by one-to-many relationships, all aligned in the same direction.
Figure 2.2 shows a hierarchy extracted from the example data
model, with State at the top and Sale Item at the bottom.
10 Figure 2.2 – Example of Hierarchy (Moody & Kortink, 2000)
In hierarchical terminology, it is stated by Moody & Kortink (2000) as:
State is the parent of Region
Region is the child of State
Sale Item, Sale, Location and Region are all “descendants” of State
Sale, Location, Region and State are all “ancestors”
of Sale Item
As demonstrated in Figure 2.1, there are four isolated and individual components to consider in the DW Kimball approach, each one of these components will also be covered in the next four sub-sections:
Data Source
ETL
Data Presentation Area
Business Intelligence Applications
2.3.2.3.
Data Source Systems
One of the main goals of a Data Warehouse system is to combine different data resources into information about processes in the company and provide this information in appropriate way and timely to company management. The main source systems can serve enterprise information, systems like Enterprise Resource Planning (ERP), Customer Relationship Management (CRL), or Supply Chain Management (SCM). Also complementary data from external private or public resources can be used. Finally, an integration of technologies with data analysis and visualization tools into BI principles, applicable in small enterprise, is suggested here. This approach presents one possibility how to arrange and process data from different resources and make them available timely for managerial decisions, according to Horakova & Skalska (2013).
11 can contain structured information, such as tables or spreadsheets, or unstructured information, such as plaintext files or pictures and other multimedia information.
2.3.2.4.
ETL
In line with Boateng, Singh, Greeshma, & Singh (2012), ETL can be defined as the data warehousing process that consists of extraction, transformation and load which is called putting data to the data warehouse.
According to Kimball & Ross (2013) the data warehouse process of ETL starts out with the extraction of data from the source systems into the ETL system. The extraction process is meant to understand the source systems data and after analysing it should be copied into the data warehouse. After the data is extracted to the data warehouse, there are several possible transformations, such as cleansing the data (correcting misspellings, resolving domain conflicts, dealing with missing elements, or parsing into standard formats), combining data from multiple sources, and de-duplicating data. The ETL organization adds data value with these cleansing and conforming tasks by changing the data and enhancing it.
A major part of the transformation process involves data history and in a real world, dimensions are not static eternally. Some of the dimension attributes may change over time and to handle this, it is necessary to track these changes. Kimball introduced a way of tracking these changes, naming it Slowly Changing Dimensions (SCDs) and it defines that each dimension table attribute should have a specific strategy to handle change.
The final step of the ETL process is the physical structuring and loading of data into the presentation area’s target dimensional models. The primary reason of an ETL system is to hand off the dimension and fact tables to the delivery step.
As reported by Simitsis & Vassiliadis (2003), the ETL processes can be simplified with five main task as may be seen below:
Identification of relevant information at the source side
Extraction of this information
Customization and integration of the information coming from multiple sources
into a common format
Cleaning of the resulting data set, on the basis of database and business rules
Propagation of the data to the data warehouse and/or data marts.
2.3.2.5.
Data Presentation Area
12 warehouse bus architecture. The data must not be structured according to individual departments’ interpretation of the data.
There are two approaches to choose from in this stage. Starting out with star schema which according with Moody & Kortink (2000) is the basic building block used in dimensional modelling. A star schema consists of one large central table called the fact table, and a number of smaller tables called dimension tables which radiate out from the central table as may be seen in Figure 2.3.
Figure 2.3 – Generic Structure of a Star Schema
Also in line with Moody & Kortink (2000) there some things to consider when handling star schemas:
The fact table contains measurements (e.g. price of products sold, quantity of
products sold) which may be aggregated in various ways
The dimension tables provide the basis for aggregating the measurements in
the fact table
The fact table is linked to all the dimension tables by one-to-many relationships
The primary key of the fact table is the concatenation of the primary keys of all
the dimension table
13 formats and methods that are designed for dimensional data. Performance combinations or pre-calculated summary tables are often created and managed by the OLAP cube engine. Consequently, cubes deliver superior query performance because of the pre-calculations, indexing strategies, and other optimizations. Business users can drill down or up by adding or removing attributes from their analyses with excellent performance without issuing new queries. OLAP cubes also provide more analytically robust functions that exceed those available with SQL. The downside is that it pays a load performance price for these capabilities, especially with large data sets.
OLAP is also referred as the way in which business users can slice and dice their way through data using sophisticated tools that allow for the navigation of dimensions such as time or hierarchies. It provides multidimensional, summarized views of business data and is used for reporting, analysis, modeling and planning for optimizing the business. OLAP techniques and tools can be used to work with data warehouses or data marts designed for sophisticated enterprise intelligence systems, as reported by Ranjan (2009).
The OLAP cubes in a data warehouse can be stored in three different modes. The Table 2.2 presents each mode characteristics.
Multidimensional Online
Analytical Processing (MOLAP)
Hybrid Online Analytical
Processing (HOLAP)
Relational Online Analytical
Processing (ROLAP)
The storage mode causes the
aggregations of the partition
and a copy of its source data to
be stored in a
multidimensional structure
when the partition is
processed
The storage mode combines
attributes of both MOLAP and
ROLAP. Like MOLAP, HOLAP
causes the aggregations of the
partition to be stored in a
multidimensional structure
The storage mode causes the
aggregations of the partition
to be stored in indexed views
in the relational database that
was specified in the partition's
data source
Structure highly optimized to
maximize query performance
Does not cause a copy of the
source data to be stored
Enables users to view data in
real time and save storage
space when working with large
datasets that are infrequently
queried, such as purely
historical data
Query response times can be
decreased substantially by
using aggregations
For queries that access only
summary data in the
aggregations of a partition,
HOLAP is the equivalent of
MOLAP. Nevertheless, queries
that access source data must
retrieve data from the
relational database and will
not be as fast as they would be
if the source data were stored
in the MOLAP structure
Query response is generally
slower with ROLAP storage
than with the MOLAP or
14
The data in the partition's
structure is only as current as
the most recent processing of
the partition
Users will typically experience
substantial differences in
query times depending upon
whether the query can be
resolved from cache or
aggregations versus from the
source data itself
Processing time is also typically
slower with ROLAP
Table 2.2 – Differences between ROLAP, MOLAP, and HOLAP (Kimball & Ross, 2013)
According to Kimball & Ross (2013) star schemas and OLAP cubes have a common logical design with recognizable dimensions. However, the physical implementation differs. When data is loaded into an OLAP cube, it is stored and indexed using formats and techniques that are designed for dimensional data. Performance aggregations or pre-calculated summary tables are often created and managed by the OLAP cube engine. Consequently, cubes deliver superior query performance because of the Data Warehousing, Business Intelligence, and Dimensional Modelling pre-calculations, indexing strategies, and other optimizations. Business users can drill down or up by adding or removing attributes from their analyses with excellent performance without issuing new queries. OLAP cubes also provide more analytically robust functions that exceed those available with SQL. The downside is that you pay a load performance price for these capabilities, especially with large data sets.
Kimball & Ross (2013) claims that use of star schemas to design data warehouses results in 80% of queries being single table browses. Star schemas may either be implemented in specialist OLAP tools, or using traditional relational DBMS. The advantage of using star schemas to represent data is that it reduces the number of tables in the database and the number of relationships between them and therefore the number of joins required in user queries.
2.3.2.6.
Business Intelligence Applications
Kimball & Ross (2013) refers to the term BI application as the range of capabilities provided to business users to leverage the presentation area for analytic decision making. A BI application can be:
Ad hoc queries
–
as simple as an ad hoc query tool or as complex as a
sophisticated data mining or modelling application
Standard reports
–
Most corporate users will probable access the data through
prebuilt parameter-driven applications and templates that do not require users
to construct queries directly
15
Data mining & models
–
Some of the sophisticated applications, such as
modeling tools, might upload results back into the operational source systems,
ETL or presentation area
Obeidat, North, Richardson & Rattanak (2015) adds that the Business Intelligence applications are infrequently used in a popular of search-based applications within a diversity of fields, such as Business, Security, Finance, Marketing, Law, Education, Visualization, Science, Engineering, Medicine, Bioinformatics, Health Informatics, Humanities, Retailing, and Telecommunications.
2.3.3.
Other Architectures
2.3.3.1.
Independent Data Mart Architecture
In line with Moody & Kortink (2000), a data mart represents the lower level of the data warehouse, where data is accessed directly by the department final users. Data is extracted from the data warehouse into data marts (smaller data warehouses) to back analysis requirements. The most important requirement at this level is that data is structured to be easy for users to understand and use. Therefore, dimensional modelling techniques are most appropriate at this level. This ensures that data structures are as simple as possible in order to simplify user queries.
16 Figure 2.4 – Example of a simplified illustration of the independent data mart architecture (Kimball &
Ross, 2013)
These standalone analytic silos represent a DW design that’s fundamentally un-architected. Even though no industry leaders promote these independent data marts, this approach is predominant, especially in large organizations. It mirrors the way many organizations fund IT projects, plus it doesn’t require cross-organizational data governance and coordination. It’s the path of least resistance for fast development at relatively low cost, at least in the short run. Undeniably, multiple uncoordinated extracts from the equivalent operational sources and redundant storage of analytic data are inefficient and wasteful in the long run. Deprived of any enterprise perspective, this independent approach results in myriad standalone point solutions that perpetuate incompatible views of the organization’s performance, resulting in unnecessary organizational argument. It’s strongly discouraged the independent data mart approach. Nonetheless, often these independent data marts have embraced dimensional modeling because they’re interested in delivering data that’s easy for the business to understand and highly responsive to queries. Therefore, the theories of dimensional modeling are often applied in this architecture, in spite of the complete disregard for some of the core doctrines, such as focusing on atomic details, building by business process instead of department, and leveraging conformed dimensions for enterprise consistency and integration (Kimball & Ross, 2013).
2.3.3.2.
Hub-and-Spoke Corporate Information Factory Inmon Architecture
Kimball & Ross (2013) introduces the hub-and-spoke Corporate Information Factory5 (CIF) approach
as being supported by Bill Inmon and others in the industry. This methodology starts by the data
17 being extracted from the operational source systems and processed through an ETL system occasionally mentioned to as data acquisition. The atomic data that outcomes from this processing lands in a 3NF database; this normalized, atomic repository is raised to as the Enterprise Data Warehouse (EDW) within the CIF architecture. Even though the Kimball architecture allows optional normalization to support ETL processing, the normalized EDW is a mandatory build in the CIF. As the Kimball approach, the CIF promotes enterprise data coordination and integration. The CIF states the normalized EDW is suited for this role, whereas the Kimball architecture strains the importance of an enterprise bus with fit in dimensions.
Figure 2.5 – Example of a simplified illustration of the hub-and-spoke Corporate Information Factory architecture (Kimball & Ross, 2013)
18
2.3.3.3.
Hybrid Hub-and-Spoke and Kimball Architecture
The last architecture justifying discussion is the marriage of the Kimball and Inmon CIF architectures. As illustrated in Figure 2.6, this architecture populates a CIF-centric EDW that is entirely off-limits to business users for analysis and reporting. It’s purely the source to populate a Kimball-esque presentation area in which the data is dimensional, atomic (complemented by aggregates) and conforms to the enterprise data warehouse bus architecture. Some proponents of this blended approach claim it’s the best of both worlds. The situation may perhaps leverage a pre-existing investment in an integrated repository, at the same time addressing the performance and usability matters associated with the 3NF EDW by offloading queries to the dimensional presentation area. In addition, because the final deliverable to the business users and BI applications is constructed based on Kimball tenets, it is quite hard to argue with the approach. Especially if a large investment in the creation of a 3NF EDW was made and it’s not delivering on the users’ expectations of fast and flexible reporting and analysis. The hybrid approach might be applicable for an organization which is starting with a blank sheet of paper. The hybrid approach will likely cost more time and money, both during development and operation, given the multiple movements of data and redundant storage of atomic details (Kimball & Ross, 2013).
Figure 2.6 – Hybrid architecture with 3NF structures and dimensional Kimball presentation area (Kimball & Ross, 2013)
2.4.
M
ETADATA19 much more useful. For example, summaries, topics, people or companies mentioned. Two technologies designed for generating metadata about content is to extract information and to automatic categorize (Cebotarean, 2011).
In order to answer the question “what should be included as metadata?” Inmon (2002) has provided a list the important information that should be retained:
Document ID
Data of entry
Description
Source
Classification(s)
Index words
Purge date
Physical location reference
Length
Related references
Data transformation tools (ETL tools) are used for data extraction from source systems and subsequently for transformation and transmission these data into the specialized database. Advanced ETL suites often handle also data quality control mechanisms as well as metadata management, as reported by Horakova & Skalska (2013). Boateng, Singh, Greeshma, & Singh (2012) has also stated that automatic capturing and delivery of metadata is a major goal of ETL.
The Data Warehouse architect must be vigilant about how to populate and maintain the metadata repository. The attribute definition, interpretations and each staged/archived data set should have accompanying metadata describing the origins and processing steps that produced the data origins should be documented in the metadata. The tracking of this lineage is explicitly required by certain compliance requirements but should be part of every archiving situation. In addition, these activities can be architected to create diagnostic metadata, eventually leading to business process reengineering to improve data quality in the source systems over time, according to Kimball & Ross (2013).
2.5.
O
PTIMIZATION ANDS
CALABILITY20 several vendors can reduce the risk of lock-in6. Lock-in refers to the idea that the switching cost of
changing vendor would be too expensive or time-consuming. None of the organisation studied raised concern about lock-in, but it was discovered another reason for the many complex BI solutions with multiple vendors: heritage.
Boateng, Singh, Greeshma, & Singh (2012) has studied and addressed the major issues regarding scability:
The amount of data in the warehouse
How quickly the warehouse is expected to grow
The number of concurrent users
The complexity of user queries
Good scalability means that queries and other data access functions will grow
linearly with the extent of the data warehouse
Dimensional models are extremely scalable. Fact tables often have a large number of rows; fact tables holding two trillion rows have been stated. The database vendors have enthusiastically embraced data warehouse and continue to integrate competences into their products to enhance dimensional models’ scalability and performance (Kimball & Ross, 2013).
Additionally, Kimball & Ross (2013) states that simplicity is the key to ensuring that a business used is able to understand the data, allowing a quick and efficient software navigation and delivering results quickly.
2.6.
M
ANAGEMENTP
ROCESSESEarly studies on critical success factors of data warehouse projects have already emphasised the importance of proper management of BI and holistic concepts of BI maturity also include BI management as a critical dimension. From a theoretical perspective, BI management capabilities can be interpreted as a reflection of resources and learning processes required to combine BI software and organizational strategy into BI solutions, and to ensure the on-going achievement of the objectives associated with the BI process. BI software products, on the other hand, are assets which are readily available in factor markets. Similarly, BI software implementation services can be purchased and the on-going maintenance of BI solutions can also be outsourced. But successful management of BI also requires a close alignment of IT and business throughout the whole BI solution life cycle, in particular matching decisions and requiring information, asking the right questions, gaining and maintaining top management support and championship, and end-user ‘buy -in’, etc. Providing and maintaining a BI solution in support of “effective problem and opportunity identification, critical decision-making, and strategy formulation, implementation, and evaluation” cannot be fully outsourced, but rather requires internal resources beyond the IT department. Only if
21 IT resources and business requirements are aligned through proper management of BI, organisations can realize the potential benefits of BI applications (Wieder & Ossimitz, 2015).
Wieder & Ossimitz (2015) also predict associations between BI management quality, information quality and data quality as may be found below:
BI management quality is positively related to the quality of managerial
decision making
Information quality is positively related to the quality of managerial decision
making
Data quality is positively related to information quality
BI management quality is positively related to data quality
BI management quality is positively related to information quality
Couture (2013) refers to data quality as one of the keys to be truly successful, and writes that there are many dimensions of data quality that can be addressed as part of a data quality assessment program. Data quality itself can be defined as “fitness for use,” a very broad definition that entails many aspects of quality at the enterprise level. Also according to Couture (2013) there are four basic dimensions that can be expanded upon over time:
Completeness - Source-to-target validation; Monitored and reported
Timeliness
–
Defined Service Level Agreements
7(SLAs); Reviewed and
approved; Monitored and reported
Validity
–
Data profiling
8; Data cleansing
9; Inline data quality checks; Monitored
and reported
Consistency
–
Inline data quality; Trended; Monitored and reported
One of the key deliverables in Business Intelligence is providing consistent, comprehensive, clean, conformed and current information for business people to enable analysis and decision making and to deliver this is not achieved by BI Tools simply accessing unrelated dater, but rather though data integration (Sherman, 2014).
Sherman (2014) states that three quarters of the BI project’s time is devoted to data integration when new data sources are added to the data architecture and that it is critical to adopt best practices to design robust, scalable, and cost-effective data integration processes.
7 A service-level agreement (SLA) is a contract between a service provider and its internal or external
customers that documents what services the provider will furnish -
http://searchitchannel.techtarget.com/definition/service-level-agreement
8 Data Profiling is a systematic analysis of the content of a data source - http://datasourceconsulting.com/data-profiling/
22 Data integration processes should be, according to Sherman (2014):
Holistic
–
avoid costly overlaps and inconsistencies
Incremental
–
more manageable and practical
Iterative
–
discover and learn from each individual project
Reusable
–
ensure consistency
Documented
–
identify data for reuse, and create leverage for future projects
Auditable
–
necessary for government regulations and industry standards.
Kimball & Ross (2013) defined that a foundation of main descriptive followed dimensions involves effort, but after it’s agreed upon, following data warehouse efforts can influence the work, both ensuring reliability and reducing the implementation’s delivery cycle time. Come to agreement on data classifications, labels and domain values is one of the key functions of data governance. Additional key functions are to create policies and responsibilities for data quality and accurateness, as well as data security and access controls.
Kimball & Ross (2013) also adressed that there was often little effort to ensure consistent common reference data and a strong data governance function is a necessary prerequisite for conforming information regardless of technical approach.
Data Warehouse Administrator10 (DWA) is responsible for the administration and management of a
data warehouse and an effective security in a data warehouse should focus on four main areas, as reported by Boateng, Singh, Greeshma & Singh (2012):
Founding in effect corporate and security policies and procedures
Applying logical security measures and techniques to confine access
Preventive physical access to the data environment
Instituting an effective inner control evaluation process highlighting on security
and privacy
Following are the issues to consider by Boateng, Singh, Greeshma, & Singh (2012) to build a successful data warehouse:
Delivering data with overlapping and confusing definitions
Believing promises of performance, capacity, and scalability
Believing that your problems are over when the data warehouse is up and
running
Focusing on ad hoc data mining and periodic reporting instead of alerts
23 According to Horakova & Skalska (2013) studies, the BI tools are more and more often focused on Corporate Performance Management11 (CPM). CPM deals with managing and monitoring of general
business efficiency. Performance indicators are usually monitored both at the corporate level and at the level of single department or division. According to this methodology, CPM determines metrics for verification of business efficiency development. Information technology tools, and especially tools from BI area, can support practical realization of CPM.
2.7.
I
NFRASTRUCTUREChaudhuri, Dayal, & Narasayya (2011) writes that today is difficult to find a successful enterprise that has not leveraged Business Intelligence technology for their business and one of the reasons for it is that the cost of data acquisition and data storage has declined significantly. This has increased the appetite of businesses to acquire very large volumes in order to extract as much competitive advantage from it as possible. Obeidat, North, Richardson, & Rattanak (2015) confirms that as computer technology advances, larger volume of data are acquired and stored at much lower cost. Any classification of transaction in business, including e-business, radio-frequency identification (RFID) tags, Web sites, emails, blogs, and many more produces new data to be tracked. Cloud virtualization permits virtual servers to be hosted in the cloud, eventually providing much lower cost of hardware and software, while ensuring better utilization of resources. As organisations are moving in the direction of cloud based offerings for increased scalability and flexibility with lower costs, this seems like a great strategy. Nevertheless, with business intelligence applications, businesses sometimes have delicate data that cannot be wholly outsourced to a cloud environment. The scenarios gradually show how more specialized data or the movement of a BI application can trigger events in other systems indicating targeted applications should be moved by following a confined and cloud deployment model rather than an all-or-nothing with cloud infrastructures only.
Advantages
Disadvantages
Increased Elastic Computing Power
Security Risks
Potential Cost Savings
Slow Data Breach Recovery
Easy Deployment
Cloud BI Availability Is
Determined By External Factors
Supportive of Nomadic Computing
Potential Compromise of Core
BI Capabilities
NA
Costs Are Difficult To Quantify
NA
Changing and Controversial
Regulatory Environment
11 Corporate performance management involves monitoring and managing an organization's
performance, according to key performance indicators -
24 Table 2.3 – Benefits and Risks of using a Business Intelligence cloud-based solution (Tamer, Kiley,
Ashrafi, & Kuilboer, 2013)
The Table 2.3 displays the numerous advantages and disadvantages of Business Intelligence on the Cloud. Starting with the advantages, the “Increased Elastic Computing Power” in which refer to how fast a machine or software can perform an operation. Project sizes vary greatly and the flexibility in computing power is appealing for companies with fluctuating and growing data sources. Another advantage is the “Potential Cost Savings” as the user on the cloud only has to pay for whatever computing power is needed. Computing needs could vary considerably due to seasonal changes in demand or during high-growth phases. “Easy Deployment” is also an advantage in which the cloud makes it easier for a company to adopt a Business Intelligence Solution and quickly experience the value. Finally, the last advantage presented is the “Supportive of Nomadic Computing” that refers to the information systems support that provides computing and communication capabilities and services to users, as they move from place to place allowing employees and BI users to travel without losing access to the tools. Despite the numerous benefits of adopting cloud-based business intelligence, there are many risks. The following risk emphasis on security of a cloud-based solution. Firstly, the “Security Risks” that come cloud computing, data is stored and delivered across the Internet. Since the location of data is unknown and not controlled by the owner of the data, there is a good chance that several competitors’ data and applications reside on the same resources environment. When putting data onto an external server and outside of the user’s direct control, there’s no way avoiding confidentiality risks. Encryption is a viable option, but it is the responsibility of the user to ensure that data is appropriately encrypted on the cloud. Another risk is “Slow Data Breach Recovery” which is caused due to user does not knowing where the data is actually stored and processed making it difficult to respond quickly, remedy the problem, and provide customers. “Cloud BI Availability Is Determined by External Factors” risk is important because using the Business Intelligence tools is relying on the third party’s server availably which is a bit of gambling on the control of its data. Another disadvantage is the “Potential Compromise of Core BI Capabilities” in which the traditional BI solutions offer full control and high-touch data integration, a capability crucial to defining a successful and robust BI solution. On the other side, the cloud presents the potential for compromised data, metadata, and application integration. One more risk is the “Costs Are Difficult to Quantify” which even though a cost benefit analyses for business intelligence is already difficult to do, even more so with cloud solutions. The last risk is “Changing and Controversial Regulatory Environment” which by using the cloud to store and compute data complicates regulation, as there is increased likelihood of cross-border data storage and access (Tamer, Kiley, Ashrafi, & Kuilboer, 2013).
25
2.8.
R
EPORTINGT
OOLSNowadays, technology and major vendors are driving data visualization within the Business Intelligence Dashboard (Wakeling, Clough, Wyper, & Balmain, 2015). However, others defend that in order for business Intelligence to be successful it needs to shift the primary focus from technology (machines assisting) to human being capable on knowledge that a business should rely on to succeed (Few, 2007).
Wakeling, Clough, Wyper and Balmain (2015) proposes that at least one delivery process should be dependent on the user throughout the development of a dashboard solution, mainly due to the users’ ability to interpret and comprehend which data is relevant to them.
There is a large number of business intelligence reporting software’s available and Table 2.4 presents two of these business intelligence software solutions.
BI Software
Qlikview
Tableau
Key Features
Hybrid platform
Hybrid platform
Data collection
Data collection
3rd-party data integration
3rd-party data integration
Customizable dashboards
Customizable dashboards
Data visualization
Data visualization
Ad hoc analytics & reports
Ad hoc analytics & reports
Self-service
Self-service
Mobile accessibility
Mobile accessibility
Additional Features
Consolidates data from multiple
sources into a single application
Flexible data architecture allows
users to connect live to their data
source, or extract all or a portion
of their data into memory
Data visualizations with
state-of-the-art graphics
Scalable for hardware and
memory
Interactive apps, dashboards and
analytics
Automatic updates
Easily create and manage data
definitions and transformations
Embed, share, comment on and
subscribe to interactive
dashboards
Table 2.4 – Example of two Business Intelligence Software Solutions (Business-software, 2016)
26 This has evolved significantly the era of self-service business intelligence (Ferrari & Russo, 2014). Microsoft PowerPivot data and Excel presentation objects are contained within the same workbook file, meaning that Excel features to aggregate and interact with data like PivotTables, PivotCharts are instantaneously available (Microsoft, 2012).
2.9.
T
RENDS2.9.1.
Cloud BI
Obeidat, North, Richardson, & Rattanak (2015) states that as many investigation challenges endure in BI, numerous new open research challenges appear on horizon for recent technologies, such as Cloud Computing. The traditional BI standpoint is focused on Extract, Transform, and Load (ETL), and reporting, while the new BI seems to be more focused on data exploration and visualization. As databases are collecting more and more data, the traditional navigating techniques become inefficient and ineffective, while data exploration and visualization techniques may contribute in a much sophisticated understanding of big data. Furthermore, the authors highlight the importance of providing environments to help users in progressively challenging tasks. Universally, data exploration and visualization techniques deliver an important nexus for the several business organisations to explore, understand and achieve valuable insights to operate and compete globally. Obeidat, North, Richardson, & Rattanak (2015) illustrates how to sustain self-service BI. Firstly, with the definition of self-service reporting, by describing the approaches for operational decision makers, analysts, and knowledge workers to access data required to back decisions and actions to promote business accomplishment. BI software merchants and industry experts distinguish self-service as a key component to eliminate problems to timely insight, decision making, as well as lowering the cost of reporting, analysis, and metrics-driven management by placing data in the proper hands.
Horakova & Skalska (2013) adresses that web technologies are still very popular due to broad availability. Most companies have built intranet or extranet for sharing information between employees and business partners. Web 2.0 conceptions include space for easy creation and maintenance of web content. Very simple is also sharing of web content with others. In connection with BI, web user can online maintain a set of analytical reports in intranet, share this content among other interested users, put comments to interesting indicators or generate dynamically ad-hoc queries directly from web application. The main advantage of this technology is ease of use and fast distribution of analytic outputs.
Smart phones enable to run a lot of applications that were available only on personal computers in the past. It is possible to integrate analytics output with mobile access to applications. The existing BI reports and dashboards will be progressively moved to the mobile platform. Then also more vendors of mobile application for specific BI tasks should appear on the market (Horakova & Skalska, 2013).