ABSTRACT: The cropping system model, namely, the crop environment resource synthesis-rice (CSM-CERES-Rice) model, is a decision supporting tool for the design of crop management. This study aimed to determine management practices for increasing rice (Oryza sativa L.) production in Laos by using the CSM-CERES-Rice model. The model was evaluated with data sets from the TDK8 and TDK11 cultivars in farmers’ fields in the Vientiane plain in 2012. Anthesis and harvesting dates, growth and yield for various management scenario combinations (eight transplanting dates × two levels of plant densities × three rates of nitrogen (N) fertilizer application) for both cultivars were simulated by the model from 1980 to 2012. The model evaluation results showed strong agreement between simulated and observed data for days to harvest with a difference within four days. The model provided acceptable accuracy for grain yields with normalized root mean square error values ranging between 1 and 16 %. The results from the model application indicated that TDK8 and TDK11 produced similar yields. Transplanting TDK8 with two plant densities produced similar yields. The highest yield for both cultivars was achieved on the transplanting date of 15 Jan. N-fertilizer application at 60 and 120 kg N ha−1 was able to increase yield for TDK8 by 50 and 87 %, respectively, and for TDK11 by 54 and 70 %, respectively. Rice transplanted on 15 Jan with 5 seedlings hill−1 and N-fertilizer at 120 kg N ha−1 had the highest average yield for both cultivars with 6,460 and 6,351 kg ha−1 for TDK8 and TDK11, respectively. The CSM-CERES-Rice model is an alternative tool in determining crop management practices for rice production.
Keywords: crop simulation, N-fertilizer application, planting practice, transplanting date
Introduction
Rice (Oryza sativa L.) is the most important food for half of the world’s population especially in Asia (Schil-ler et al., 2006). In Laos, rice is mostly cultivated in the plain areas which account for more than 80 % of the agricultural areas of the country. Records from the Of-fice of Agricultural Statistics of Laos indicate that the average rice yield is lower than the expected yield level of 2.5 t ha−1. There are several factors that impact rice
production, including management practices such as cultivar use, transplanting date, plant density, fertilizer application, irrigation amongst others. Identification of suitable crop management practices could provide infor-mation for designing a plan to increase the rice yield of this production area. However, this process is time consuming and expensive as many years of experimen-tal trials are required. In addition, cropping systems are extremely complex and many factors have to be con-sidered to achieve long-term sustainability (Geng et al., 1990) in major rice growing areas.
The CSM-CERES-Rice model has been developed to support decision making in agronomic research, crop production and land-use planning. It has been in-cluded in the decision support system for agrotechnol-ogy transfer (DSSAT). The CSM-CERES-Rice model is physiologically based and simulates daily canopy pho-tosynthesis, respiration, growth, biomass partitioning and crop development as a function of input informa-tion, including daily weather conditions, soil
proper-ties, management practices and cultivar characteristics (Jones et al., 2003).
This model was introduced as a decision-supporting tool and its performance has been assessed for rice-wheat cropping systems to increase land and resource use effi-ciency (Timsina and Connor, 2001; Sarkar and Kar, 2006; Timsina and Humphreys, 2006). The model has been evaluated in a number of agro-environments and crop management strategies (Cheyglinted et al., 2001; Singh et al., 2007; Vilayvong et al., 2012; Yao et al., 2005). It has also been used to determine better rice management sys-tems under irrigated conditions (Ahmad et al., 2012) and simulate rice yield under certain agronomic management practices and changing climatic scenarios (Lamsal and Amgain, 2010). Therefore, the CSM-CERES-Rice model offers the opportunity of a tool to determine crop man-agement for improving rice productivity.
Currently, the lack of this model assessment has limited the application in investigating the interaction of transplanting dates, plant densities and N-fertilizer application for lowland rice under both irrigated and rainfed conditions in tropical regions such as Laos. This study aimed to determine management practices that will increase rice production in Laos by using the CSM-CERES-Rice model.
Materials and Methods
Model evaluation
The input data required to evaluate the CSM-1Khon Kaen University/Faculty of Agriculture – Dept. of Plant
Science and Agricultural Resources − Khon Kaen − 40002 – Thailand.
2Khon Kaen University/Faculty of Agriculture − Plant Breeding Research Center for Sustainable Agriculture. *Corresponding author <[email protected]>
Edited by: Gerrit Hoogenboom
CSM-CERES-Rice model to determine management strategies for lowland rice
Saythong Vilayvong1, Poramate Banterng1,2*, Aran Patanothai1, Krirk Pannangpetch1
management, including cultivars used, transplanting date, planting method, plant spacing, fertilization, weed control, irrigation, pest control, harvest time and others production practices were obtained from farmer inter-views (nine households) in 2012 in the Xaythani district (18°4’ N, 102°36’ E and 170 m above mean sea level), Vientiane, Laos. These data cover the range of rice man-agement practices in Vientiane. Therefore, it would con-stitute information representative of rice production in this area. Crop details include harvest maturity date and dry weight of grain yield for TDK8 and TDK11 cultivars from nine farmers’ fields.
The sample plots (three plots for each cultivar) were selected for the collection of data from an area of 4 m2 foreach plot. The soil surface and soil profile
charac-teristics for two soil groups in the Vientiane plain were obtained from the Soil Survey and Land Classification Center, National Agriculture and Forestry Research In-stitute, Ministry of Agriculture and Forestry, Laos (Table 1). The genetic coefficients of TDK8 and TDK11 (Table 2) were obtained from our previous study (Vilayvong et al., 2012), that also indicated that the genetic coefficients of TDK8 and TDK11 cultivars are sufficiently accurate for further application of CSM-CERES-Rice to support decision making.
The management, soil, climatic and crop data for nine farmers’ fields and the genetic coefficients of TDK8 and TDK11were used as input data in the DSSAT v4.5. Model evaluation was performed by comparing the sim-ulated values with their corresponding observed values from nine farmers’ fields. The root mean square error (RMSEn) value (Wallach and Goffinet, 1987) was used to test the agreement between simulated and observed data. Low RMSE value indicates strong agreement between the data sets. The RMSEn value gives a measure (%) of the relative difference of simulated versus observed data. The simulation is considered excellent if the RMSEn value is less than 10 %, good if the RMSEn is greater than 10 % and less than 20 % and fair if the RMSEn is greater than 20 % and less than 30 % (Loague and Green, 1991).
Simulation for different management scenarios
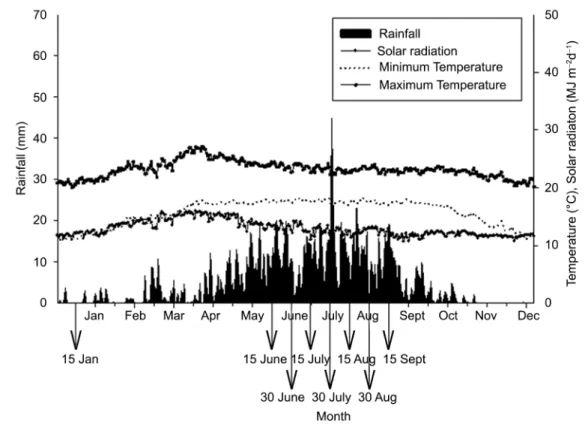
The input data required for model simulation in-clude genetic coefficients, soil properties, daily weather conditions and rice management. The genetic coeffi-cients of TDK8 and TDK11 (Table 2) were obtained from Vilayvong et al. (2012). The historical daily weather data for Vientiane from 2001 to 2012 (12 years) include maximum and minimum temperatures, solar radiation and rainfall (Figure 1). These historical weather data were then used as the input data for the WeatherMan program in DSSAT v4.5 to generate the weather param-eters for long-term simulation.
Model simulation for different management sce-narios was conducted to determine crop management practices for rice production in the Vientiane plain. The scenarios for crop management were first defined by following both local extension recommendations and current farmers’ management practices. Growing rice in-season under both rainfed and irrigated conditions were specified for seven transplanting dates in the rainy season, e.g. 15 June, 30 June, 15 July, 30 July, 15 Aug, 30 Aug and 15 Sept. Another growing rice off-season under irrigated conditions was also set as 15 Jan transplanting date (Figure 1).
Irrigation and water management for all planting dates were set as automatic application when required by the crop. The common plant densities of 1 seedling hill−1 and 5 seedlings hill−1 with 20 cm × 20 cm of plant
spacing were employed. N-fertilizer was applied at the rates of 60 kg N ha−1 (the rate recommended by Linquist
and Sengxua (2001) for lowland rice in Laos) and 120 kg N ha−1 (two times the recommended rate) with three
splits (recommended by Iqbal et al., 2008) of 35 % at 20-25 days after transplanting (DAT), 45 % at 40-45 DAT and 20 % at 60 DAT. The most popular glutinous rice cultivars TDK8 and TDK11 in Vientiane plain were used for simulation scenarios.
The crop management scenario combinations (eight transplanting dates × two plant densities × three Table 1 – The information for the top soil layer (depth 0-15 and 15-30
cm) for two soil groups in the Vientiane plain, Laos.
Soil characteristic
Soil group
Acrisols Alisols
0-15 cm 15-30 cm 0-15 cm 15-30 cm Soil texture Loam Loam Sandy loam Sandy loam
Sand (%) 52 46 54 55
Clay (%) 18 24 15 16
Silt (%) 30 30 31 29
pH in H2O 5.1 5.1 5.0 5.1
Total N (%) 0.2 0.2 0.1 0.1
Organic matter (%) 3.2 3.2 2.2 2.4
Bulk density (g cm−3) 1.5 1.5 1.5 1.5
Genetic coefficient
TDK8 TDK11 Phenology coefficient
P1: Growing degree day (GDD) for the basic
vegetative phase (˚C day) 415 409
P2R: Photoperiod sensitivity coefficient (˚C day) 195 199 P5: GDD from the beginning of grain filling to
physiological maturity (˚C day) 520 400 P20: Critical day length (h) 10.6 11.2 Growth coefficient
G1: Potential spikelet number coefficient 40 42 G2: Single grain weight (g) 0.025 0.025
G3: Tillering coefficient 0.8 0.9
G4: Temperature tolerance 0.8 0.8
Figure 1 – Average daily maximum temperature, minimum temperature, solar radiation and rainfall over 12 years (2001-2012) for the Vientiane plain, Laos.
rates of N-fertilizer application) were run by the CSM-CERES-Rice model for TDK8 and TDK11 cultivars. The simulation was conducted for 33 years from 1980 to 2012. The seasonal analysis program of DSSAT v4.5 was used to evaluate and compare between different combi-nations of crop management practices.
The simulated data were analyzed statistically us-ing the analysis of variance technique. Treatment means were compared by the least significant difference (LSD) method. All statistical analyses were performed us-ing Statistix8 software by followus-ing Gomez and Gomez (1984). The total production cost and gross income (aver-age simulated yield for 2012 × price of rice) for TDK8 and TDK11 productions under three different rates of N-fertilizer application were also evaluated and they were then used to calculate the net income. The rela-tive values (%) for total production cost, grain yield and net income were calculated by using the value of each N-fertilizer application rate multiplied by 100 and then divided by the corresponding value for no N-fertilizer application.
Results
Model evaluation
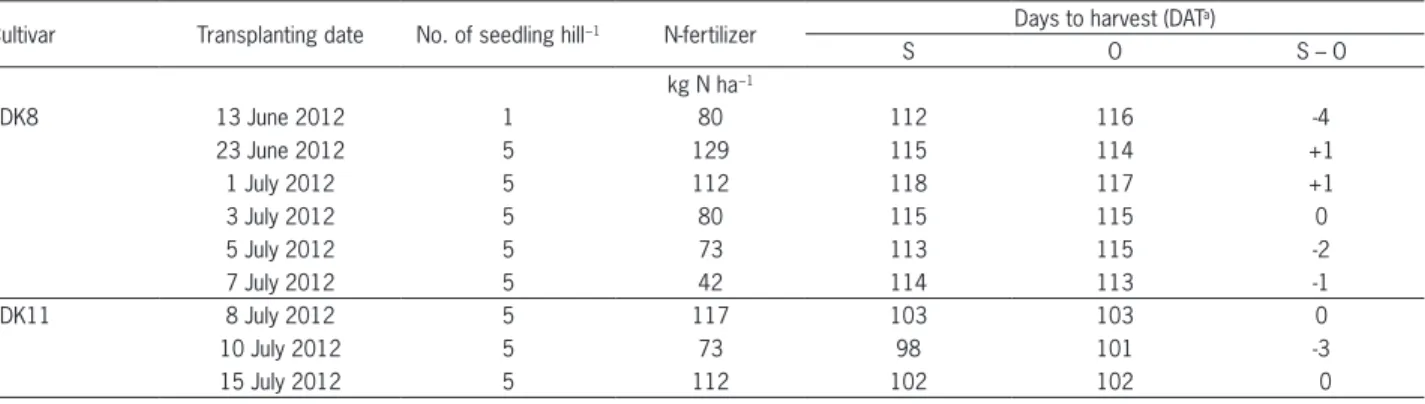
Differences between the simulated data and ob-served data for days to harvest ranged from +2 to -4 days (Table 3). The greatest difference (-4 days) was
found for TDK8 grown on 13 June 2013 with N-fertilizer at a rate of 80 kg N ha−1 followed by -3 days for TDK11
grown on 10 July 2011 with N-fertilizer at a rate of 73 kg N ha−1. Most differences between the simulated data
and observed data for grain yield were low, ranging from 31 to 154 kg ha−1 for RMSE values and 1 to 6 % for
RM-SEn values (Table 4). However, the highest RMSE value of 556 kg ha−1 and RMSE
n value of 16 % were found for
TDK8 transplanted on 7 July 2012 with N-fertilizer at a rate of 42 kg N ha−1.
Simulation for management scenarios
The simulated results for 33 years (from 1980 to 2012) indicated that there were differences (p < 0.05) between TDK8 and TDK11 for days to anthesis, days to harvest, biomass and harvest index, whereas there was no difference (p > 0.05) between TDK8 and TDK11 in terms of grain yield (Table 5). The results for simulated data showed that TDK8 flowered at 83 DAT and had 122 days to harvest, whereas TDK11 bloomed at 76 DAT and could be harvested at 108 days. TDK8 was also higher than TDK11 in biomass production (13,712 and 12,354 kg ha−1 for TDK8 and TDK11,
respective-ly), but it was lower than TDK11 as regards harvest in-dex (0.31 and 0.34 for TDK8 and TDK11, respectively). However, these cultivars had no differences in grain yield (4,165 and 4,209 kg ha−1 for TDK8 and TDK11,
Table 5– Simulated days to anthesis, days to harvest, biomass and grain yield of TDK8 and TDK11 for two plant densities, three rates of N-fertilizer application and eight transplanting dates for 33 years (from 1980 to 2012) in the Vientiane plain, Laos.
Management
Days to anthesisa
(DATb) Days to harvesta (DATb)
Biomassa (kg ha−1)
Grain yielda
(kg ha−1) Harvest indexa
TDK8 TDK11 TDK8 TDK11 TDK8 TDK11 TDK8 TDK11 TDK8 TDK11
Plant density
1 Seedling hill−1 83 A 76 A 124 A 110 A 13,518 B 11,996 B 4,154 A 4,232 A 0.3128 A 0.3553 A 5 Seedlings hill−1 82 B 75 B 121 B 106 B 13,905 A 12,712 A 4,177 A 4,186 B 0.3074 B 0.3326 B
LSD0.05 0.18 0.17 0.24 0.22 60.09 55.60 29.81 24.00 0.002 0.001
N rate (kg N ha−1)
0 82 B 75 B 120 C 106 C 9,097 C 8,669 C 2,850 C 2,954 C 0.3207 A 0.3460 A
60 83 A 76 A 122 B 108 B 14,472 B 13,270 B 4,405 B 4,556 B 0.3077 B 0.3456 A
120 83 A 76 A 124 A 109 A 17,566 A 15,123 A 5,241 A 5,117 A 0.3018 C 0.3404 B
LSD0.05 0.22 0.21 0.30 0.27 73.60 68.09 36.51 29.39 0.002 0.002
Transplanting date
15 Jan 82 D 74 D 114 F 101 F 14,811 C 13,953 B 4,889 A 4,766 A 0.3320 B 0.3414 D
15 June 85 A 78 A 120 E 108 C 11,096 H 10,383 H 3,760 G 3,840 F 0.3446 A 0.3726 A
30 June 84 B 78 A 121 D 108 C 11,552 G 10,610 G 3,769 G 3,823 F 0.3315 B 0.3637 B
15 July 83 C 77 B 120 E 107 D 12,331 F 11,203 F 3,893 F 3,861 F 0.3192 C 0.3472 C
30 July 82 D 75 C 120 E 106 E 13,036 E 11,597 E 4,080 D 3,940 E 0.3152 D 0.3406 D
15 Aug 82 D 75 C 123 C 107 D 14,131 D 12,304 D 4,341 C 4,247 D 0.3081 E 0.3449 C
30 Aug 82 D 75 C 128 B 111 B 15,669 B 13,589 C 4,601 B 4,571 C 0.2943 F 0.3366 E
15 Sept 82 D 74 D 130 A 114 A 17,066 A 15,192 A 3,990 E 4,624 B 0.2359 G 0.3047 F
LSD0.05 0.37 0.34 0.49 0.45 120.18 111.20 59.62 47.99 0.003 0.003
Average a 83 a 76 b 122 a 108 b 13,712 a 12,354 b 4,165 a 4,209 a 0.3101 b 0.3440 a
LSD0.05 for average 0.15 0.29 187.12 55.58 0.002
aValues in the column (capital letters) and row (small letters) followed by the same letter are not different (p < 0.05). bDAT is days after transplanting.
Table 4 – Simulated (S) and observed (O) values, root mean square error (RMSE) and normalized RMSE (RMSEn) for grain yield of TDK8 and TDK11 cultivars grown under different transplanting dates and N-fertilizer application rates in 2012 in Vientiane plain, Laos.
Cultivar Transplanting date No. of seedling hill−1 N-fertilizer Grain yield
S O RMSE RMSE n
kg N ha−1 --- kg ha−1 --- %
TDK8 13 June 2012 1 80 4,023 3,825 114 3
23 June 2012 5 129 5,190 5,100 52 1
1 July 2012 5 112 4,633 4,888 147 3
3 July 2012 5 80 3,922 3,975 31 1
5 July 2012 5 73 3,352 3,613 150 4
7 July 2012 5 42 2,437 3,400 556 16
TDK11 8 July 2012 5 117 4,337 4,250 50 1
10 July 2012 5 73 3,029 2,763 154 6
15 July 2012 5 112 4,121 4,038 48 1
Cultivar Transplanting date No. of seedling hill−1 N-fertilizer
S O S – O
kg N ha−1
TDK8 13 June 2012 1 80 112 116 -4
23 June 2012 5 129 115 114 +1
1 July 2012 5 112 118 117 +1
3 July 2012 5 80 115 115 0
5 July 2012 5 73 113 115 -2
7 July 2012 5 42 114 113 -1
TDK11 8 July 2012 5 117 103 103 0
10 July 2012 5 73 98 101 -3
15 July 2012 5 112 102 102 0
Differences in plant population densities affected (p < 0.05) days to anthesis, days to harvest, biomass and harvest index for both cultivars, but it did not af-fect (p > 0.05) grain yield of TDK8 (Table 5). Biomass of TDK8 and TDK11 grown at 5 seedlings hill−1 was higher
than that grown at 1 seedling hill−1, but both TDK8 and
TDK11 grown at 1 seedling hill−1 had a higher harvest
index than those grown at 5 seedlings hill−1.
N-fertilizer rates also affected (p < 0.05) days to an-thesis, days to harvest, biomass, grain yield and harvest index for both rice cultivars (Table 5). For both cultivars with higher N-fertilizer application, days to anthesis and days to harvest were slightly delayed, whereas biomass and grain yield were increased. However, N-fertilizer re-duced the harvest index in both cultivars.
Transplanting date affected (p < 0.05) days to anthesis, days to harvest, biomass, grain yield and har-vest index (Table 5). The longest days to anthesis was recorded for the crop transplanted on 15 June in TDK8 (85 DAT) and 15 June and 30 June in TDK11 (78 DAT). Whereas the longest days to harvest was recorded for the crop transplanted on 15 Sept for both cultivars with 130 and 114 DAT for TDK8 and TDK11, respectively. The shortest periods of life cycle were recorded for both cultivars transplanted on 15 Jan.
The crop transplanted on 15 Sept produced the highest above ground biomass with 17,066 kg ha−1 for
TDK8 and 15,192 kg ha−1 for TDK11. The crop grown on
other transplanting dates during the period 15 June to 15 Aug had low biomass. The crop transplanted on 15 Jan produced the highest grain yield with 4,889 and 4,766 kg ha−1 for TDK8 and TDK11, respectively. TDK8 and
TDK11 transplanted on 15 June had the highest harvest index. Both cultivars had the lowest harvest index when they were planted on 15 Sept.
According to simulated results for all manage-ment combinations, a delay in transplanting dates and an increase in the rate of N-fertilizer application could increase grain yields for all cultivars and plant densities, except for a combination of the crop transplanted on 15 Jan with 1 seedling hill−1 and 120 kg N ha−1 (Figure 2).
A plant density of 5 seedlings hill−1 along with 120 kg N
ha−1 and a transplanting date of 15 Jan had the highest
average grain yield for both TDK8 (6,460 ± 403 kg ha−1)
and TDK11 (6,351 ± 410 kg ha−1) when compared to the
other management combinations. In addition, the range of the simulated rice grain yield around the median for this management combination was also small, especially in TDK8.
Contribution of N-fertilizer application to produc-tion cost, grain yield and income
Economic assessment for rice production under three rates of N-fertilizer application was also made by using the simulated results from 2012. The results indi-cated that N-fertilizer rates of 60 and 120 kg N ha−1
in-creased total production costs of 6 and 12 %, respective-ly, for both TDK8 and TDK11 (Table 6). N-fertilizer rates
of 60 and 120 kg N ha−1 contributed to yield increases of
50 and 87 % for TDK8 and 54 and 70 % for TDK11, indi-cating that TDK8 responded to fertilizer application bet-ter than did TDK11. The net incomes for growing TDK8 with 0, 60 and 120 kg N ha−1 were 147.5, 563.0 and
855.2 US$ ha−1, respectively, while the net incomes for
growing TDK11 were 201.9, 678.5 and 794.5 US$ ha−1,
respectively. The relative net income for TDK8 went up by 382 and 580 % when the rate of N application was increased from 0 to 60 and 120 kg N ha−1, respectively,
it went up by 336 and 393 % for TDK11, respectively.
Discussion
Model evaluation
Differences in simulated data and observed data for days to harvest were in the range between +1 to -4 days and the major differences were TDK8 with N-ferti-lizer at a rate of 80 kg N ha−1 (-4 days) and TDK11 with
N-fertilizer at a rate of 73 kg N ha−1 (-3 days). The
differ-ences were partially due to inaccuracy in determining crop maturity which caused harvest delays by farmers.
The differences between observed and simulated yields were not particularly great. Most differences be-tween simulated yield and observed yield were lower than 10 % except for one crop cut which had a 16 % difference. The simulated results are considered accept-able if the difference between simulated yield and actual yield is lower than 10 % (Loague and Green, 1991). The disparities between the observed and simulated values were attributable to the fact that the crop in the actual farmers’ fields had been affected by weeds, diseases and pests and other factors which were not taken into ac-count by the model. In addition, error from fertility data could also result in differences between observation and simulation (Oteng-Darko et al., 2012; Yao et al., 2007).
The CSM-CERES-Rice model provided good sim-ulated yields of glutinous lowland rice (Vilayvong et al., 2012). Overall, variations between observed and simulated yields are adequately accounted for and the CSM-CERES-Rice model could be used to determine the appropriate management practices for improving rice production in the Vientiane plain, Laos.
Simulation for different management scenarios
There was no difference in the yields of TDK8 and TDK11 although they were different in days to anthe-sis, days to harvest, biomass and harvest index. Differ-ence in days to harvest is very useful for rice production. TDK11 may be better under terminal drought because it completes the life cycle earlier. Thus, it can alleviate the effect of terminal drought. In cases where soil prepara-tion was delayed, TDK11 is also better than TDK8.
The increase in plant population density from 1 seedling hill−1 to 5 seedlings hill−1 slightly increased
as-similation rate which is the physiological potential for converting the total dry matter into grain yield (Baloch et al., 2006). Similarly, plant density of 1 seedling hill−1
of rice gave higher grain when compared to plant den-sity of 2 seedlings hill−1 (Srinivasulu et al., 1999). In this
study, a high assimilation rate did not contribute much to grain yield because the crop grown at 5 seedlings hill−1 had higher biomass than the crop grown at 1
seed-ing hill−1. Grain yield in this study seems to be related to
the harvest index instead of biomass. However, attaining high grain yield may be difficult in different contexts because grain yield is dependent on several factors such as soil moisture, soil fertility, agronomic practices, pests and diseases.
Increases in N-fertilizer rates could increase both biomass and grain yield but they seemed to reduce har-vest index. Greater increases in grain yield were found for N-fertilizer at a rate of 60 kg N ha−1 and grain yield
was increased albeit at a reducing rate when the crop was applied with N-fertilizer at a rate of 120 kg N ha−1.
Appli-cation of N-fertilizer supports crop growth and final yield (Baloch et al., 2006). If the crop is not labile to natural disasters such as flooding, drought, insect pests and dis-eases, higher N-fertilizer rate is highly recommended for attaining maximum yield and maximum profit.
Production of glutinous rice in this area depends heavily on N-fertilizer input. In this study, application of N-fertilizer at the rates of 60 and 120 kg N ha−1 increased
total production costs for both cultivars by 6 and 12 %, respectively. At these N-fertilizer rates, changes in grain yield and net income were much higher than changes in production costs. In general, adding N-fertilizer applica-tion under good management condiapplica-tions farmers could obtain a satisfactory income from their rice growing.
The farmers in Laos usually transplant rice in-sea-son (from June to Aug) depending on rainfall and rain distribution and they can also grow off-season rice in Jan with irrigation. In this study, we simulated in-season rice starting from 15 June to 15 Sept (seven transplanting dates) and off-season rice on 15 Jan to understand the ef-fects of the transplanting date on growth and yield. For in-season rice, delayed transplanting from June to Sept caused slightly early anthesis in both TDK8 and TDK11. However, both cultivars seemed to have increased days to harvest with late transplanting dates. These results are similar to the observed values measured by Vilayvong et al. (2012) who maintained that TDK8 and TDK11 are non-photosensitive cultivars. Therefore, the variation in transplanting times would also have a key effect on life duration of these rice cultivars (Fukai, 1999).
Both TDK8 and TDK11 increased biomass with late transplanting dates of in-season rice but they re-duced harvest index. Growing rice off-season with a transplanting date of 15 Jan gave high biomass, grain yield and harvest index when compared to in-season rice. This was caused by high solar radiation during the growing season. The average values of solar radiation for the entire growing season were 19.9, 16.7, 15.9, 15.4, 15.1, 14.9, 14.8 and 14.8 MJ m−2 day−1 for the
transplant-ing dates of 15 Jan, 15 Sept, 30 Aug, 15 Aug, 30 July, 15 July, 30 June and 15 June, respectively.
A high solar radiation value for the entire growing season contributes to the high level of crop yield (Ban-terng et al., 2010). Solar radiation provides the energy for the processes that drive photosynthesis, affecting carbo-hydrate partitioning and biomass growth of the individual plant components (Hoogenboom, 2000). Considering the transplanting date, therefore, farmers are recommended to grow rice under both rainfed and irrigated conditions on 15 Jan, 30 July, 15 Aug, 30 Aug and 15 Sept to attain acceptable grain yield.
The highest simulated grain yield for the combina-tion of rice transplanted on 15 Jan with 5 seedlings hill−1
and 120 kg N ha−1 would be related to the effects of high
solar radiation during crop life duration, high N-fertilizer input as well as suitable plant density. However, low val-ues of simulated grain yields for the transplanting date of 15 Jan with 1 seedling hill−1 and 120 kg N ha−1 were
also recorded and this because of over N-fertilizer applica-tion. The simulated output from the model indicated that stress or nutrient toxicity was the result of a high input of N-fertilizer during the panicle initiation stage to the begin-ning of the grain filling stage for the crop transplanted on 15 Jan along with 1 seedling hill−1 and 120 kg N ha−1 and
it reduced the total number of panicles and ultimately grain yield. Under no N-fertilizer application, however, transplanting with 5 seedlings hill−1 may face nutrient
de-ficiency stress during the panicle initiation phase.
We demonstrated how the CSM-CERES-rice model could potentially assist in the determination of crop man-agement schemes for rice production in tropical regions such as Laos. The model could provide valuable informa-tion in the design of agricultural management practices that will increase rice production in the Vientiane plain. To be able to identify crop management practices for a specific region, however, we suggest that the results both from a few years of actual experiments and from long-term simulation should be used to help design the best recommendations.
Conclusion
CSM-CERES-Rice model is an alternative tool for determining management practices for lowland rice in Table 6 – Contribution of N-fertilizer application on total production cost, simulated grain yield for 2012 and income for TDK8 and TDK11 cultivars
in Vientiane plain, Laos.
Items
Cultivar and N-fertilizer rate (kg N ha−1)
TDK8 TDK11
0 60 120 0 60 120
Total production cost (US$ ha−1) 772.9 818.4 863.8 772.9 818.4 863.8
Relative total production cost (%) 100 106 112 100 106 112
Average simulated grain yield (kg ha−1) 2,789 4,186 5,209 2,954 4,536 5,025
Relative grain yield (%) 100 150 187 100 154 170
Gross income (US$ ha−1)a 920.4 1,381.4 1,719.0 974.8 1,496.9 1,658.3
Net income (US$ ha−1) 147.5 563.0 855.2 201.9 678.5 794.5
Relative net income (%) 100 382 580 100 336 393
grain yield. The transplanting methods of 1 seedling hill−1
and 5 seedlings hill−1 produced similar grain yield for
TDK8. Application of N-fertilizer at the rates of 60 and 120 kg N ha−1 could increase grain yield and net income.
The transplanting date of 15 Jan gave the highest grain yield for both TDK8 and TDK11 when compared with the other transplanting dates. The management combination of irrigated rice transplanted on 15 Jan with 5 seedlings hill−1 and N-fertilizer at 120 kg N ha−1 is recommended
for improving lowland rice production in Laos.
Acknowledgements
This study was supported by the Thailand re-search fund through the CLMV-T DSS graduate degree program research initiative: 1st phase grant number
RD-G52O0003-LV05 of Assoc. Prof. Dr. Attachai Jintrawet, Chiang Mai University, Thailand. Assistance in con-ducting the work was received from the plant breeding research center for sustainable agriculture, Khon Kaen University, Khon Kaen, Thailand. Acknowledgement is also extended to Khon Kaen University and the Faculty of Agriculture for providing financial support for manu-script preparation activities.
References
Ahmad, S.; Ahmad, A.; Tojo Soler, C.M.; Ali, H.; Zia-Ul-Haq, M.; Anothai, J.; Hussain, A.; Hoogenboom, G.; Hasanuzzaman, M. 2012. Application of the CSM-CERES-Rice model for evaluation of plant density and nitrogen management of fine transplanted rice for an irrigated semiarid environment. Precision Agriculture 13: 200-218.
Baloch, M.S.; Awan, I.U.; Hassan, G. 2006. Growth and yield of rice as affected by transplanting dates and seedlings per hill under high temperature of Dera Ismail Khan, Pakistan. Journal of Zhejiang University SCIENCE B 7: 572-579.
Banterng, P.; Hoogenboom, G.; Patanothai, A.; Singh, P.; Wani S.P.; Pathak, P.; Tongpoonpol, S.; Atichart, S.; Srihaban, P.; Buranaviriyakul, S.; Jintrawet, A.; Nguyen, T.C. 2010. Application of the cropping system model (CSM)-CROPGRO-Soybean for determining optimum management strategies for soybean in tropical environments. Journal of Agronomy and Crop Science 196: 231-242.
Cheyglinted, S.; Ranamukhaarachchi, S.L.; Singh, G. 2001. Assessment of the CERES-Rice model for rice production in the central plain of Thailand. Journal of Agricultural Science 137: 289-298.
Fukai, S. 1999. Phenology in rainfed lowland rice. Field Crops Research 64: 51-60.
Geng, S.; Hess C.E.; Auburn, J. 1990. Sustainable agricultural systems: concepts and definitions. Journal of Agronomy and Crop Science 165: 73-85.
Gomez, K.A.; Gomez, A.A. 1984. Statistical Procedures for Agricultural Research. 2ed. John Wiley, New York, NY, USA.
Iqbal, S.; Ahmad, A.; Hussain, A.; Ali, M.A.; Khaliq, T.; Wajid, S.A. 2008. Influence of transplanting date and nitrogen management on productivity of paddy cultivars under variable environment. International Journal of Agriculture and Biology 10: 288-292.
Jones, J.W.; Hoogenboom, G.; Porter, C.H.; Boote, K.J.; Batchelor, W.D.; Hunt, L.A.; Wilkens, P.W.; Singh, U.; Gijsman, A.J.; Ritchie, J.T. 2003. The DSSAT cropping system model. European Journal of Agronomy 18: 235-265.
Lamsal, A.; Amgain, L.P. 2010. Simulation of growth and yield of rice under varied agronomic management and changing climatic scenario by using DSSAT ver. 4.0 crop model in Chitwan, Nepal. Journal of Hill Agriculture 1: 114-123. Linquist, B.; Sengxua, P. 2001. Nutrient Management in Rainfed
Lowland Rice in the Lao PDR. International Rice Research Institute, Los Banos, Philippines.
Loague, K.; Green, R.E. 1991. Statistical and graphical methods for evaluating solute transport models: overview and application. Journal of Contaminant Hydrology 7: 51-73.
Oteng-Darko, P.; Kyei-Baffour, N.; Ofori, E. 2012. Simulating rice yields under climate change scenarios using the CERES-Rice model. African Crop Science Journal 20: 401-408.
Sarkar, R.; Kar, S. 2006. Evaluation of management strategies for sustainable rice-wheat cropping system, using DSSAT seasonal analysis. Journal of Agricultural Sciences 144: 421-434. Schiller, J.M.; Ladsavong, H.; Doungsila, K. 2006. A history of
rice in Laos. p. 9-28. In: Schiller, J.M.; Chanphengxay, M.B.; Linqiust, B.; Appa Rao, S., eds. Rice in Laos. International Rice Research Institute, Los Banos, Philippines.
Singh, H.; Singh, K.N.; Hasan, B. 2007. Evaluation of CERES-rice model (V. 4.0) under temperate conditions of Kashmir valley, India. Cereal Research Communications 35: 1723-1732.
Srinivasulu, K.; Veeraraghavaiah, R.; Madhavi, K. 1999. Growth performance of rice hybrids under different methods and densities of planting. Crop Research 18: 1-7.
Timsina, J.; Connor, D.J. 2001. Productivity and management of rice-wheat cropping systems: issues and challenges. Field Crops Research 69: 93-132.
Timsina, J.; Humphreys, E. 2006. Performance of CERES-rice and CERES-wheat models in rice-wheat systems: a review. Agricultural System 90: 5-31.
Vilayvong, S.; Banterng, P.; Patanothai, A.; Pannangpetch, K. 2012. Evaluation of CSM-CERES-Rice in simulating the response of lowland rice cultivars to nitrogen application. Australian Journal of Crop Science 6: 1534-1541.
Wallach, D.; Goffinet, B. 1987. Mean squared error of prediction in models for studying ecological and agronomics systems. Biometrics 43: 561-573.
Yao, F.; Xu, Y.; Feng, Q.; Lin, E.; Yan, X. 2005. Simulation and validation of CERES-rice model in main rice ecological zones in China. Acta Agronomica Sinica 31: 545-550.