Redes neurais e análise estatística para classificação de mapas topográficos da
córnea baseados em coeficientes de Zernike: uma comparação quantitativa
Trabalho realizado no Laboratório de Óptica Oftálmica, Grupo de Óptica do Instituto de Física de São Carlos da Universidade de São Paulo USP São Carlos (SP) -Brasil.
1Coordenador de Pesquisa do Laboratório de Óptica
Oftálmica do Grupo de Óptica do Instituto de Física de São Carlos da Universidade de São Paulo - USP - São Carlos (SP) - Brasil.
2Pós-Doutorando pelo Instituto de Física de São Carlos
da Universidade de São Paulo - USP - São Carlos (SP) - Brasil.
Endereço para correspondência: Grupo de Óptica, Instituto de Física de São Carlos Universidade de São Paulo. Av. Trabalhador Sãocarlense, 400 - Caixa Postal 369 - São Carlos (SP) CEP 13560-970
E-mail: [email protected] [email protected]
Recebido para publicação em 19.12.2006 Última versão recebida em 11.11.2007 Aprovação em 14.11.2007
Nota Editorial: Depois de concluída a análise do artigo sob sigilo editorial e com a anuência da Dra. Belquiz Rodrigues A. Nassaralla sobre a divulgação de seu nome como revisora, agradecemos sua participação neste processo.
Luis Alberto Vieira de Carvalho1
Marconi Soares Barbosa2
classification of corneal videokeratography maps based
on Zernike coefficients: a quantitative comparison
Keywords: Corneal topography/methods; Statistical analysis; Neural networks (computer); Artificial intelligence; Discriminant analysis
Purpose:The main goal of this study was to develop and compare two different techniques for classification of specific types of corneal shapes when Zernike coefficients are used as inputs. A feed-forward artificial Neural Network (NN) and discriminant analysis (DA) techniques were used. Methods: The inputs both for the NN and DA were the first 15 standard Zernike coefficients for 80 previously classified corneal elevation data files from an Eyesys System 2000 Videokeratograph (VK), installed at theDepartamento de Oftalmologia of the Escola Paulista de Medicina, São Paulo. The NN had 5 output neurons which were associated with 5 typical corneal shapes: keratoconus, with-the-rule astigmatism, against-the-rule astigmatism, “regular” or “normal” shape and post-PRK. Results:
The NN and DA responses were statistically analyzed in terms of precision ([true positive+true negative]/total number of cases). Mean overall results for all cases for the NN and DA techniques were, respectively, 94% and 84.8%. Conclusion: Although we used a relatively small database, results obtained in the present study indicate that Zernike polynomials as des-criptors of corneal shape may be a reliable parameter as input data for diagnostic automation of VK maps, using either NN or DA.
ABSTRACT
INTRODUCTION
Other authors have conducted studies and implementation of different methods for the classification of videokeratography maps(1-3). Although most of these methods have shown successful results regarding their main objective of automation of classification, there are very few attempts in the literature to use curvature independent input parameters such as Zernike coefficients (ZC)(4-5). Since ZC have practically become a standard in des-cribing corneal surface shapes(5) and also wavefront aberration data for the eye(6-7), and since they are curvature definition independent, we believe they form a better input parameter for automated diagnosis systems.
Representation of the cornea as a set of Zernike polynomials
In VK systems that use the Placido disc for measuring corneal shape/power the examination data files are usually based on the cylindrical symmetry and number of Placido discs. In our case, an Eyesys System 2000 was used. For this equipment we have 16 Placido discs and 360 polar angles, separated by intervals of 1 degree, which gives us a total of 5760 points over the cornea (corneas with excessive loss in peripheral and central discs were excluded during the random selection of the original database and only those for which only peripheral discs needed little or no editing were used in this study).
The input parameters in an artificial NN are a very critical aspect. This happens because each input is represented by a single neuron and it would be a very awkward task to create a NN with 5760 inputs, one for each corneal point.
For the previously mentioned reasons, our choice of input was a set composed of the first 15 ZC, enumerated according to the VSIA Taskforce members(8), to fit corneal elevation data files extracted from the Eyesys VK. Given that many brands of VK systems offer software modules for exporting elevation data (or at least the documentation of how data are organized inside their files so one can build algorithms to successfully read them), any reader may perform the calculations presented here. Although initially used by optical engineers, ZC are quite common today for the vision science community. They have been successfully used to represent corneal height data in many studies and the fitting method is a straightforward process. Although the choice of using only 15 Zernike terms are usually balanced between computational power and pre-cision, precise results for conic surfaces (RMSE of 0.2 µm associated with the fitting process and 1-2 µm when VK mis-alignment and improper focus is considered) have been re-ported without the need of more terms(4,6,9). For completeness, a very brief description of the fitting procedure is given below since this method is well documented elsewhere.
Fitting corneal height data with Zernike polynomials
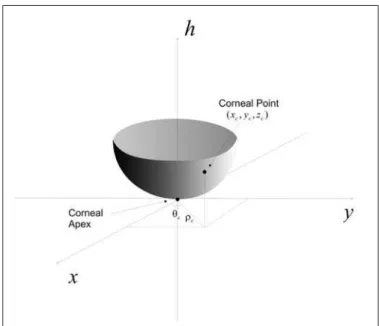
In order to implement the fitting routines we represented corneal elevation data h as a parameterized function of Placido disc coordinates (ρ,θ). This representation is illustrated in figure 1. In this manner, corneal surface elevation may be approximated by the series:
where, because of the method in which Eyesys saves and organizes its data files, ρ is a parametric function of the Placido disc number and angle (η,θ), C are the Zernike coefficients and Z are the ZC.
In order to find the Zernike coefficients for a specific
corneal height, we perform a minimum square fit for all N data points. This procedure consists of minimizing the sum
relative to each Zernike coefficient, therefore we have to find for dS/dCt= 0 for t= 1,...,k, where k is the total number of coefficients, such that
from where we extract a linear system AC = b with 15 equations and 15 unknown values of C. By solving this linear system through conventional procedures, such as the Gaus-sian elimination method, we find the 15 Zernike coefficients for each corneal surface.
Data Acquisition
A total of 80 corneal VK files were randomly selected from the database of an Eyesys VK installed at the refractive surgery department of the Departamento de Oftalmologia - Escola Paulista de Medicina - São Paulo. Two specialists in the area were asked to select 5 corneal cases (“Normal” cornea (NRM), Keratoconus (KC), Post-LASIK (PK), Astigmatisms with (AW) and against-the-rule (AA)) from all files. From these, a total of 50% were randomly selected as the training set and the other (3)
(1)
(2)
50% were added to the remaining of the original database and was used as the testing set. This is an important step because the training phase of the NN and the DA algorithm should be accomplished by presenting equal numbers of each classification case. In this way a more balanced solution for the synaptic weights and DA parameters is reached.
Implementation of the Neural Network
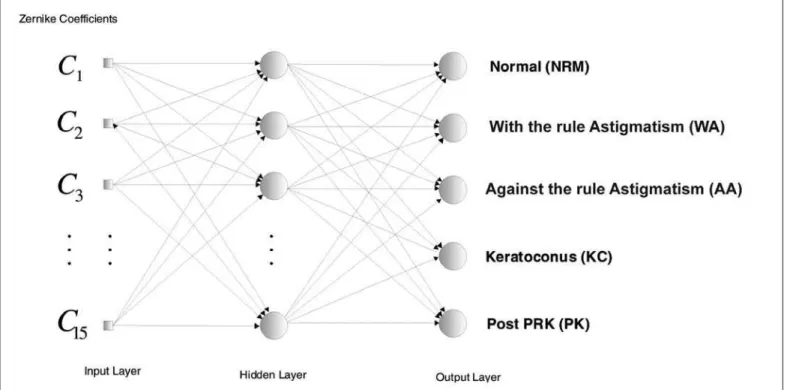
We used the Matlab Neural Network Toolbox (www. mathworks.com) to implement the feed-forward Neural Net-work, shown in figure 2.
This type of NN is defined in the literature as feed-forward with single occult layer. As mentioned, the input layer is used to feed each Zernike coefficient representing corneal eleva-tion; the occult layer, after several tests using the optimization functions available in the Matlab toolbox, was determined to have 5 neurons and the output layer contains one neuron for each corneal shape that we are classifying. There are ob-viously an infinite number of configurations for intermediate layers, such as the actual number of layers and the number of neurons for each layer. What we tried to do was to make the NN as simple as possible for the best possible results. There is also the possibility of a much greater number of output neu-rons, i. e., corneal classifications, but we were restricted to the number of cases that we had collected in our VK database.
Implementation of different statistical methods
There is an overwhelming amount of statistical software and methods in the market today. We have chosen to use the
Scilab (www.scilab.org) program and its toolbox in discri-minant analysis as our statistical method.
In the case we are considering, with 5 classes or catego-rical variables (Keratoconus, Normal, Against and with the rule astigmatisms and post-PRK), this procedure is also re-ferred to as Multiple discriminant analysis or discriminant factor analysis(10). Discriminant analysis is used to determine which variables discriminate more between two or more naturally occurring groups and to quantify the classification potential of their discriminant function base.
In the simplest case, we assume that all the groups have equal covariance matrices. In this case, called the homoscedastic mo-del, we can derive a linear discriminant function of the form
wherex is, in our case a vector with all Zernike coefficients, and as result the discriminant function will be a linear combi-nation of those polynomials.
In the most general case, the various groups have independent covariance matrices, leading to the heteroscedastic model, which leads to a quadratic discriminant function of the form:
RESULTS
Neural Networks
As mentioned in the previous section we first use our training set to adjust the synaptic weights of the NN and then
Figure 2 - NN implemented for classification of VK examinations
(4)
use these same weights to test our NN. The efficiency of the NN was analyzed without using any corneal data from the training set. At this point of our implementation an output signal greater than or equal to the threshold value of 0.5 was defined as a positive response for the given category and a value less than 0.5 was defined as a negative response. If more than one neuron at the output layer had response greater than or equal to 0.5, the one that had the greater value would be used as the correct response. If none of the responses were greater than or equal to 0.5 we would consider that the NN did not have a classification for that corneal shape.
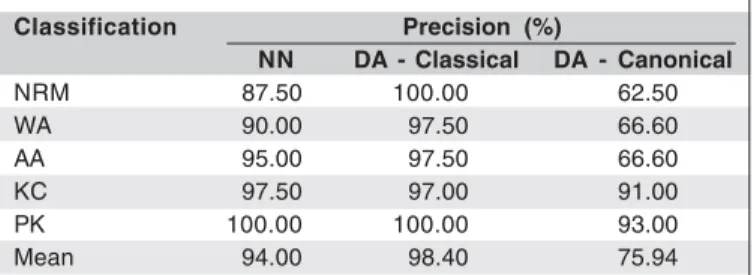
We analyzed the outputs for each classification category in terms of precision ([true positive+true negative]/total of cases). Table 1, second column, shows the results for preci-sion for all test cases for each classification category.
Statistical Analysis
Classical/Heteroscedastical/proportional
In this section we describe the results of two discrimi-nant analysis models. The first one assumes a more complex structure (Heteroscedastic) for the covariance matrix in each group. Table 1, column 3 shows the results for this DA implementation. It is clear from such a table that the Hete-roscesdatic model performed quite well, considering the overall RMSE of 1.6%, on data considered in testing the model, where only one keratoconic cornea was classified as astigmatic.
Canonical/Homoscedastical/proporcional
We consider further in our analysis a simpler linear model, with homoscedastic covariance structure. Table 1 shows the results of this model with the data used to estimate the ca-nonical function. Interestingly it performs relatively well to detect the keratoconic and post-LASIK cases, but is not re-liable in classifying the normal and astigmatic group of in-dividuals (fourth column).
DISCUSSION
From the results obtained here our claim is that both an Artificial Intelligence (AI) system and statistical DA for
corneal diagnosis that use Zernike terms as input for a NN are satisfactory solutions. First because it is easier to implement, given that ZC and least squares fitting methods are well do-cumented in literature and have been used for decades in the field of optical engineering(11). Second, because it will allow any interested reader to reproduce these results in the laboratory, given that Zernike terms do not depend on any user or subjec-tive choice in order to determine corneal parameters and also does not use any complex statistical formulation, and also because their implementation details are not proprietary. In addition, last of all, because the proposed method represents an elegant mathematical approach in terms of corneal repre-sentation and may serve well as input into a well-established NN theory and algorithms. This solution is very independent of the VK manufacture, NN configuration or parameters chosen to represent the cornea.
Now, regarding the usefulness or cost-benefit of using NN or conventional statistical techniques is a more complicated issue. As we may see from Table 1, a simple feed-forward NN gave us a mean classification precision of 94%. The effort for trying the best NN was not needed: we simply used the first feed-forward design that was implemented. Now the second attempt using a canonical DA furnished a poor average pre-cision of 75.94%, which urged us to test other types of DA and, finally, obtain a very satisfactory result of 98.40% mean precision with a classical DA. This result was even better than that of the NN. Nevertheless, if we take the mean of the DA methods, 87.17%, the NN technique performed better.
So now we come to a cost-benefit relation that might in-volve implementation factors as well; that is, although DA is more computationally cost-effective when compared to NN, it might be tricky to find which type of DA furnishes better results for that specific database. In terms of processing time the DA took only a few seconds while the NN training took about half an hour and the testing took only about 1-2 se-conds. This means that for a very large database the training phase of the NN may take up to several hours in today’s personal computers, although after training it would take only a couple of seconds to classify the cornea. Another possible disadvantage of using NN is that, because of the complexity of the algorithm, there are very few packages available in the market and most of them with quite high prices; on the other hand there are many low-cost, and even free, quite powerful tools for statistical analysis available on the internet today. In general, we believe NN may render better results than sta-tistical models, but computational power available should be considered critical.
RESUMO
Objetivos:Nosso principal objetivo neste trabalho foi de de-senvolver e comparar duas técnicas diferentes para classifica-ção de superfícies corneanas. Uma rede neural artificial ali-mentada adiante e análise descriminante foram as técnicas de
Table 1. Results for NN and DA (classical and canonical) Classification Precision (%)
NN DA - Classical DA - Canonical
NRM 87.50 100.00 62.50 WA 90.00 97.50 66.60 AA 95.00 97.50 66.60 KC 97.50 97.00 91.00 PK 100.00 100.00 93.00 Mean 94.00 98.40 75.94
classificação comparadas neste trabalho. Métodos: As entra-das para ambos os métodos de classificação foram os primei-ros 15 coeficientes de Zernike para 80 córneas mensuradas anteriormente em um topógrafo Eyesys instalado no Departamento de Oftalmologia da Escola Paulista de Medicina -UNIFESP. A rede neural tem 5 saídas que foram associados aos cinco casos típicos contidos na base de dados: ceratoco-ne, astigmatismo a favor da regra, astigmatismo contra a regra, formato “regular” ou “normal” e pós-PRK. Resultados:
Os resultados de ambos os métodos foram estatisticamente analisados em termos de precisão. Os resultados gerais para ambos os métodos de redes neurais e análise discriminante foram 94% e 84,8%, respectivamente. Conclusão: Embora te-nha-se utilizado uma base de dados relativamente pequena, os resultados obtidos aqui indicam que os polinômios de Zernike podem ser um parâmetro de entrada para classificação de diferentes formatos de córnea, tanto para uso com redes neurais ou análise discriminante.
Descritores: Topografia da córnea/métodos; Análise estatís-tica; Redes neurais (computação); Inteligência artificial; Aná-lise discriminante
REFERENCES
1. Maeda N, Klyce SD, Smolek MK, Thompson HW. Automated keratoconus screening with corneal topography analysis. Invest Ophthalmol Vis Sci. 1994;35(6):2749-57.
2. Kalin NS, Maeda N, Klyce SD, Hargrave S, Wilson SE. Automated topo-graphic screening for keratoconus in refractive surgery candidates. CLAO J. 1996;22(3):164-7.
3. Rabinowitz YS, Rasheed K. KISA% index: a quantitative videokeratography algorithm embodying minimal topographic criteria for diagnosing keratoconus. J Cataract Refract Surg. 1999;25(10):1327-35. Erratum in: J Cataract Refract Surg. 2000;26(4)480. Comment in: J Cataract Refract Surg. 2000;26(4):472-4. 4. Schwiegerling J, Greivenkamp JE. Keratoconus detection based on
videokera-toscopic height data. Optom Vis Sci. 1996;73(12):721-8.
5. Carvalho LA. Preliminary results of neural networks and Zernike polynomials for classification of videokeratography maps. Optom Vis Sci. 2005;82(2):151-8. 6. Carvalho LA. Accuracy of Zernike polynomials to characterizing optical aberrations and the corneal surface of the eye. Invest Ophthalmol Vis Sci. 2005;46(6):1915-26. 7. Carvalho LA. Absolute accuracy of Placido-based videokeratographs to measure
the optical aberrations of the cornea. Optom Vis Sci. 2004;81(8):616-28. 8. Thibos LN, Applegate RA, Schwiegerling JT, Webb R; VSIA Standards
Taskforce Members. Vision science and its applications. Standards for reporting the optical aberrations of eyes. J Refract Surg. 2002;18(5):S652-60. 9. Guirao A, Artal P. Corneal wave aberration from videokeratography: accuracy and limitations of the procedure. J Opt Soc Am A Opt Image Sci Vis. 2000; 17(6):955-65.