Universidade Federal do Cear´
a
Centro de Ciˆ
encias
Departamento de Computa¸c˜
ao
Mestrado e Doutorado em Ciˆ
encia da Computa¸c˜
ao
BENCHXTEND: A TOOL TO MEASURE THE ELASTICITY OF
CLOUD DATABASE SYSTEMS
Rodrigo Felix de Almeida
DISSERTAC
¸ ˜
AO DE MESTRADO
Universidade Federal do Cear´
a
Centro de Ciˆ
encias
Departamento de Computa¸c˜
ao
Rodrigo Felix de Almeida
BENCHXTEND: A TOOL TO MEASURE THE ELASTICITY OF
CLOUD DATABASE SYSTEMS
Disserta¸c˜ao submetida `a Coordena¸c˜ao do Curso de P´
os-Gradua¸c˜ao em Ciˆencia da Computa¸c˜ao da Universidade
Federal do Cear´a como requisito parcial para a obten¸c˜ao
do grau de Mestre em Ciˆencia da Computa¸c˜ao.
Orientador: Prof. Javam de Castro Machado, DSc
Co-orientadores: Prof. Fl´avio R. C. Sousa, DSc.
Dados Internacionais de Catalogação na Publicação Universidade Federal do Ceará
Biblioteca de Ciências e Tecnologia
A45b Almeida, Rodrigo Félix de.
BenchXtend: a tool to measure the elasticity of cloud database systems. / Rodrigo Félix de Almeida. – 2013.
87f. : il., color., enc. ; 30 cm.
Dissertação (mestrado) – Universidade Federal do Ceará, Centro de Ciências, Departamento de Computação, Programa de Pós Graduação em Ciência da Computação, Fortaleza, 2013.
Área de Concentração: Sistemas de informação. Orientação: Prof. Dr. Javan de Castro Machado. Coorientação: Prof. Dr, Flávio R. C. Sousa. .
1. Banco de dados - Gerência. 2. Computação em nuvem. I. Título.
BenchXtend: a tool to measure the elasticity of cloud database systems
Rodrigo Felix de Almeida
Disserta¸c˜ao submetida `a Coordena¸c˜ao do Curso de P´os-Gradua¸c˜ao em Ciˆencia da Computa¸c˜ao da Universidade Federal do Cear´a como requisito parcial para a obten¸c˜ao
do grau de Mestre em Ciˆencia da Computa¸c˜ao.
Prof. Javam Machado, DSc Universidade Federal do Cear´a
Prof. Jos´e Maria da Silva Monteiro, DSc Universidade Federal do Cear´a
Prof. Fl´avio R. C. Sousa, DSc Universidade Federal do Cear´a
Prof. S´ergio Lifschitz, DSc
Pontif´ıcia Universidade Cat´olica - Rio de Janeiro
ACKNOWLEDGEMENTS
Ao meu orientador, prof. Javam Machado, por ter confiado no meu potencial como es-tudante de mestrado e por ter sido compreensivo nos momentos delicados em que tive que conciliar as atividades de mestrado com o meu trabalho como gerente de projetos no LSBD.
Aos meus pais, Sebasti˜ao e Escol´astica, por terem dado todo o suporte e base familiar necess´arios para que eu pudesse focar nas atividades, durante boa parte do meu mestrado.
`
A minha amada esposa, B´arbara Vasconcelos, que passou de noiva a esposa durante esse percurso da p´os-gradua¸c˜ao, por ter estado sempre comigo, compreendido os momen-tos de ausˆencia ou falta de aten¸c˜ao e me aconselhado nos momenmomen-tos em que vacilei sobre a continua¸c˜ao desse projeto.
Aos professores Leonardo Moreira, por acompanhar e sugerir melhorias no trabalho, e Fl´avio Sousa por estar sempre presente e sol´ıcito no acompanhamento e direcionamento dos detalhes da pesquisa, sendo primordial para os resultados obtidos.
A todos os colaboradores do LSBD por terem me ajudado e desempenhado com com-petˆencia as atividades dos projetos nos momentos em que tive que me ausentar, devido aos compromissos do mestrado.
Ao LSBD como institui¸c˜ao por ter fornecido uma estrutura f´ısica adequada para a pesquisa e pelo apoio financeiro para participa¸c˜ao de congressos cient´ıficos.
Aos colegas de mestrado da UFC por compartilharem as alegrias e as tristezas durante as disciplinas e as escritas de disserta¸c˜oes e de artigos.
Aos professores Jos´e Maria Monteiro e S´ergio Lifschitz por comporem a banca e pelas valiosas sugest˜oes no aprimoramento desta disserta¸c˜ao.
Success is getting what you want.
Happiness is wanting what you get.
RESUMO
Nos ´ultimos anos, a computa¸c˜ao em nuvem tem atra´ıdo a aten¸c˜ao tanto da ind´ustria quanto do meio acadˆemico, tornando-se comum encontrar na literatura relatos de ado¸c˜ao de computa¸c˜ao em nuvem por parte de empresas e institui¸c˜oes acadˆemicas. Uma vez que a maioria das aplica¸c˜oes em nuvem s˜ao orientadas a dados, sistemas de gerenciamento de bancos de dados s˜ao componentes cr´ıticos das aplica¸c˜oes. Novos sistemas de bancos de dados surgiram para atender a novos requisitos de aplica¸c˜oes altamente escal´aveis em nuvem. Esses sistemas possuem diferen¸cas marcantes quando comparados com sistemas relacionais tradicionais. Al´em disso, uma vez que elasticidade ´e um recurso chave da computa¸c˜ao em nuvem e um diferencial desse paradigma, esses novos sistemas de bancos de dados tamb´em devem prover elasticidade. Juntamente com o surgimento desses novos sistemas, surge tamb´em a necessidade de avali´a-los.
Ferramentas tradicionais de benchmark para bancos de dados n˜ao s˜ao suficientes para analisar as especificidades desses sistemas em nuvem. Assim, novas ferramentas de benchmark s˜ao necess´arias para avaliar adequadamente esses sistemas em nuvem e como medir o qu˜ao el´asticos eles s˜ao. Antes de avaliar e calcular a elasticidade desses sistemas, se faz necess´aria a defini¸c˜ao de um modelo com m´etricas de elasticidade que fa¸cam sentido tanto para consumidores quanto provedores.
Nesse trabalho apresentamos BenchXtend, uma ferramenta, que estende o Ya-hoo! Cloud Serving Benchmark (YCSB), para benchmarking e medi¸c˜ao de elasticidade de bancos de dados em nuvem. Como parte desse trabalho, propomos um modelo com m´etricas a partir das perspectivas dos consumidores e dos provedores para medir a elasti-cidade. Por fim, avaliamos nossa solu¸c˜ao atrav´es de experimentos e verificamos que nossa ferramenta foi capaz de variar a carga de trabalho, como esperado, e que nossas m´etricas conseguiram capturar a varia¸c˜ao de elasticidade nos cen´arios analisados.
ABSTRACT
In recent years, cloud computing has attracted attention from industry and academic world, becoming increasingly common to find cases of cloud adoption by companies and research institutions in the literature. Since the majority of cloud applications are data-driven, database management systems powering these applications are critical compo-nents in the application stack. Many novel database systems have emerged to fulfill new requirements of high-scalable cloud applications. Those systems have remarkable differ-ences when compared to traditional relational databases. Moreover, since elasticity is a key feature in cloud computing and it is a differential of this computing paradigm, novel database systems must also provide elasticity. Altogether with the emergence of these new systems, the need of evaluating them comes up.
Traditional benchmark tools for database systems are not sufficient to analyze some specificities of these systems in a cloud. Thus, new benchmark tools are required to properly evaluate such cloud systems and also to measure how elastic they are. Before actually benchmarking and measuring elasticity of cloud database systems, it becomes necessary to define a model with elasticity metrics that makes sense both for consumers and providers.
In this work we present BenchXtend, a tool, that extends Yahoo! Cloud Serving Benchmark (YCSB), to benchmark cloud database systems and to measure elasticity of such systems. As part of this work, we propose a model with metrics from consumer and provider perspectives to measure elasticity. Finally, we evaluated our solution by performing experiments and we verified that our tool could properly vary the load dur-ing execution, as expected, and that our elasticity model could capture the elasticity differences between the studied scenarios.
CONTENTS
Chapter 1—Introduction 1
1.1 Motivation . . . 3
1.2 Contributions . . . 4
1.3 Publications . . . 4
1.4 Organization . . . 5
Chapter 2—Cloud Computing and Databases 6 2.1 Cloud Computing . . . 6
2.2 Databases on Cloud . . . 8
2.2.1 Service-Level Agreements (SLAs) . . . 8
2.2.2 Relational Databases and Distributed Databases . . . 9
2.2.3 NoSQL Databases . . . 10
2.3 Benchmark Tools . . . 14
2.3.1 YCSB . . . 15
2.3.2 OLTP-bench . . . 17
2.4 Related Work . . . 17
2.4.1 Elasticity Metrics . . . 17
CONTENTS vii
Chapter 3—Elasticity Metrics 20
3.1 Consumer Perspective . . . 21
3.1.1 Under-provisioning Penalty (underprov) . . . 22
3.2 Provider Perspective . . . 24
3.2.1 Over-provisioning Penalty (overprov) . . . 25
3.2.2 Elasticity for Database System (elasticitydb) . . . 26
Chapter 4—BenchXtend 29 4.1 Monitoring and Scaling In and Out . . . 31
4.2 YCSB Extensions . . . 33
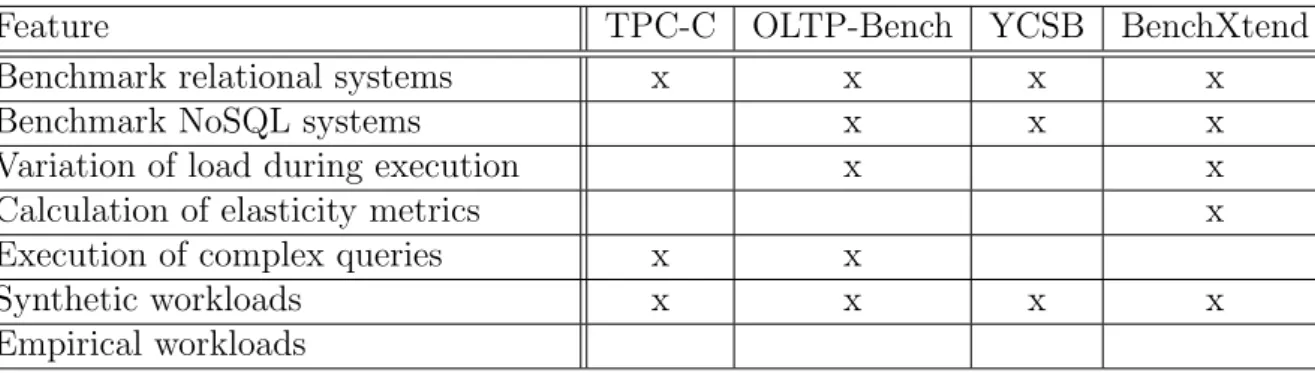
4.3 Comparing BenchXtend and Related Work . . . 37
Chapter 5—Evaluation 39 5.1 Environments . . . 39
5.2 Experiments . . . 40
5.3 Results . . . 41
5.3.1 Workload A . . . 42
5.3.2 Workload E . . . 50
5.3.3 Varying Parameters of Elasticity Metrics . . . 55
5.3.4 Overall Analysis . . . 59
LIST OF ABBREVIATIONS
API - Application Programming Interface
ACID - Atomicity, Consistency, Isolation and Durability
DaaS - Database-as-a-Service
DBMS - DataBase Management System
EBS - Elastic Block Store
EC2 - Elastic Compute Cloud
ECU - EC2 Compute Unit
IaaS - Infrastrucure-as-a-Service
IOPS - I/O operations per second
OLTP - On Line Transaction Processing
OLAP - On Line Analytical Processing
PaaS - Platform-as-a-Service
QoS - Quality of Service
RDBMS - Relational DataBase Management System
SaaS - Software-as-a-Service
SLA - Service Level Agreement
vCPU - Virtual Central Processing Unit
VM - Virtual Machine
XML - eXtensible Markup Language
LIST OF FIGURES
2.1 Cloud Database System . . . 11
2.2 Data range division for a 3-node cluster . . . 13
3.1 Time ranges where each response time can be placed within . . . 26
3.2 Metric values when adopted weighted arithmetic mean . . . 27
3.3 Metric values when adopted weighted geometric mean . . . 27
3.4 Metric values when adopted weighted harmonic mean . . . 28
4.1 BenchXtend architecture . . . 30
4.2 Timeline without any interpolation . . . 30
4.3 Timeline with Linear interpolation . . . 31
4.4 Timeline with Poisson interpolation . . . 31
4.5 Cloud database system instantiated for our experiments and BenchXtend 32 5.1 Scenario with elasticity . . . 42
5.2 Scenario without elasticity . . . 42
5.3 Scenario with elasticity . . . 44
5.4 Scenario without elasticity . . . 44
5.5 Scenario with elasticity . . . 45
LIST OF FIGURES x
5.7 Scenario with elasticity . . . 45
5.8 Scenario without elasticity . . . 46
5.9 Scenario with elasticity . . . 46
5.10 Scenario without elasticity . . . 46
5.11 Box plot chart showing elastic and inelastic scenario of Read operation -Workload A . . . 47
5.12 Box plot chart showing elastic and inelastic scenario of Update operation - Workload A . . . 49
5.13 Scenario with elasticity . . . 50
5.14 Scenario without elasticity . . . 50
5.15 Scenario with elasticity . . . 51
5.16 Scenario without elasticity . . . 51
5.17 Scenario with elasticity . . . 51
5.18 Scenario without elasticity . . . 52
5.19 Scenario with elasticity . . . 52
5.20 Scenario without elasticity . . . 52
5.21 Scenario with elasticity . . . 53
5.22 Scenario without elasticity . . . 53
5.23 Box plot chart showing elastic and inelastic scenario of Scan operation -Workload E . . . 54
5.24 Box plot chart showing elastic and inelastic scenario of Insert operation -Workload E . . . 55
5.25 Metrics variations when underprov percentile varies . . . 56
LIST OF FIGURES xi
5.27 Metrics variations when SLA upper bound varies . . . 58
5.28 Metrics variations when SLA lower bound varies . . . 58
5.29 Metrics variations when underprov weight varies . . . 59
5.30 Example of timeline with higher peaks . . . 62
LIST OF TABLES
2.1 Tokens and range of hash values for a 3-node cluster . . . 13
2.2 Core workloads that come with YCSB by default . . . 16
4.1 Parameters included in the timeline.xml file to be used for elasticity metrics 35 4.2 Comparison of some benchmark tools for database systems . . . 38
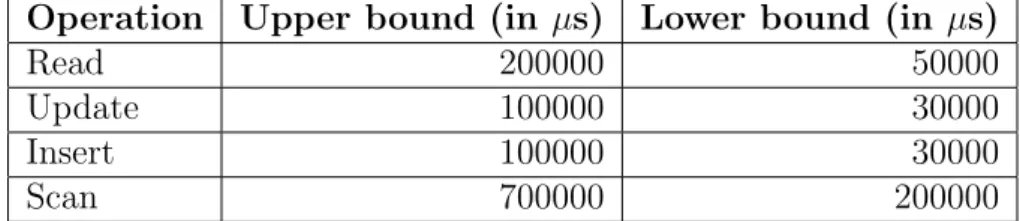
5.1 Expected response times for each operation defined in the SLA . . . 41
5.2 Metrics calculated for Read operations . . . 47
5.3 Metrics calculated for Update operations . . . 49
5.4 Metrics calculated for Scan operations . . . 53
5.5 Metrics calculated for Insert operations . . . 54
CHAPTER 1
INTRODUCTION
Scalability, pay-per-use or pay-as-you-go pricing model and elasticity are the major rea-sons for the successful and widespread adoption of cloud infrastructures. Since the ma-jority of cloud applications are data-driven, database management systems (DBMSs) powering these applications are critical components in the cloud software stack [1]. Scal-ability is not a new requirement of database systems for cloud environments. However, the appearance of infinite computing resources available on demand in a cloud changes the dimensions of the scalability requirement. Pay-per-use model of cloud computing allows an organization to pay by the hour for computing resources, potentially leading to cost savings even if the hourly rate to rent a machine from a provider is higher than the rate to own one [2]. This model can be applied also for database services provided in the cloud [3]. The elasticity concept encompasses the idea of scale in and out resources on demand to keep the quality of a provided service. Cloud database systems should be able to transparently manage and utilize the elastic computing resources to deal with fluctuating workloads [4]. There is currently a lot of interest in elastic database systems [5].
Scalability of a system only provides a guarantee that a system can be scaled up from a few machines to a larger number of machines. In cloud computing platforms, it is necessary to support an additional property so that scalability can be dynamically provisioned without causing any interruption in the service. Elasticity emcompasses scalability aspects and goes beyond by adding the requirement of scaling down when level of demand is low. Time is also a central aspect in elasticity, which depends on the speed of response to changed workload, while scalability allows the system to meet the changed load as long as it needs. Therefore, elasticity receives remarkable importance on cloud services.
2
database systems present several differences when compared to traditional relational sys-tems, regarding to their data models, consistency, availability, replication strategy and so on. Since there are many differences and many available database systems, having a way to compare them is very useful for developers and architects of cloud applications, for instance. Benchmark tools are commonly used to evaluate the performance of a system as well as to help on tuning it.
The most prominent examples to evaluate transactional database systems are the various TPC benchmarks. However, TPC-family benchmarks do not consider essential aspects of cloud database systems, like the variation of demand and resources during a workload and the measurement of specific characteristics like elasticity. Defining a work-load that changes the number of clients during workwork-load process illustrates a more realistic scenario for many applications, like Web applications, in which this number goes up and down continuously. Particularly, reducing the number of clients is a more challenging aspect, that is not addressed for most related works. Therefore, to properly evaluate a cloud database system it becomes necessary to have a benchmark tool that properly ful-fills cloud requirements. Before measuring elasticity of cloud database systems, a model with metrics is required. Thus, there must be defined a quantitative model to compare elasticity of different database systems. Services on cloud computing, including database services but not limited to, are sold by providers and contracted by consumers. Due to the large number of providers and to the wide range of possible consumer applications, comparing options based on some criteria help on taking decisions. On one hand, con-sumers want to compare cloud database services to choose one that fits better to their needs. On the other hand, providers want to meet the Service-Level Agreement (SLA) established with the consumer, regarding to the database systems, with the minimum cost and amount of resources. Therefore, the elasticity metrics must make sense both for consumer and provider perspectives in order to support them on their decisions.
1.1. Motivation 3
1.1 MOTIVATION
For decades, relational database management systems (RDBMSs) have been considered as the one-size-fits-all solution for providing data persistence and retrieval. However, the ever increasing need for scalability and new application requirements have created new challenges for traditional RDBMSs. NoSQL database systems have emerged as an alternative to reach high scalability for applications that may relax some requirements, like strong consistency. Dozens of NoSQL systems are currently available and several differences can be pointed out among the existing alternatives. Some NoSQL systems differ on their data models that could be, for instance, key-value stores, column stores or document stores. Some systems are optimized to write operations while other ones for read operations. Synchronous replication can be adopted for some of them, while other systems adopt assynchronous replication. Thus, many characteristics, that are not covered by traditional benchmark tools, should be considered by new solutions to evaluate performance of such novel systems.
YCSB [7] is an outstanding solution to benchmark NoSQL systems. YCSB has been referenced by many works and currently allows to benchmark more than ten different database systems. However, YCSB presents some limitations regarding to on how to properly emulate the behavior of applications in a cloud. For instance, YCSB does not allow to vary the load during a workload execution. If the load is not changed during an experiment, it is very hard to evaluate how a system would react to adapt itself to maintain Quality of Service (QoS) when there are some fluctuations of demand. In a cloud environment, maintenance of QoS is usually related to satisfying a contract, namely Service-Level Agreement (SLA), that establishes what are the criteria and the thresholds to state whether the quality of a service was violated or not. Therefore, adding features on YCSB or in other benchmark tool to provide a way to vary load during a workload may help one to evaluate NoSQL systems in a cloud.
1.2. Contributions 4
represents and measures the elasticity of cloud database systems can help on identifying which services are more elastic. If a provider maintains its QoS by satisfying the SLA and tries to minimize the resource usage in a scenario with remarkable load variation, we can say the system acts in an elastic way. We argue that an elasticity model can be based on how much the SLA is met. Besides having an elasticity model, it becomes necessary to have also a benchmark tool that can run some workloads and then measure the elasticity based on the proposed model.
1.2 CONTRIBUTIONS
The major contributions of this master dissertation are:
1. Development of a benchmark tool for cloud database system that calculates elas-ticity metrics and varies upward and downward the number of active clients while executing a workload.
2. Definition of a model with metrics to measure the elasticity of database systems in cloud, from consumer and provider perspectives.
3. Evaluation of our model through some experiments, that can help on understanding some characteristics of novel data systems in a cloud.
1.3 PUBLICATIONS
During the graduate course, we have published the following papers related to the theme of this dissertation:
• [Almeida, 2012] Rodrigo Felix de Almeida. 2012. BenchXtend: a tool to
bench-mark and measure elasticity of cloud databases in 27th Simp´osio Brasileiro de Bancos de Dados - SBBD 2012 - Workshop de Teses e Disserta¸c˜oes. S˜ao Paulo, SP, Brazil.
• [Almeida et al., 2013] Rodrigo Almeida, Fl´avio Sousa, S´ergio Lifschitz and Javam
1.4. Organization 5
1.4 ORGANIZATION
The remaining chapters are organized as follow:
• Chapter 2: presents basic concepts about cloud computing, relational and NoSQL
databases, as well as benchmark tools and finally presents related work.
• Chapter 3: describes the proposed model of metrics for elasticity of databases in
cloud, from consumer and provider perspectives.
• Chapter 4: presents the BenchXtend tool, explaining its architecture and extensions
developed.
• Chapter 5: presents the enviroment where experiments were performed and analyzes
the results gathered.
CHAPTER 2
CLOUD COMPUTING AND DATABASES
2.1 CLOUD COMPUTING
In recent years, cloud computing has attracted attention from industry and academic worlds, becoming increasingly common to find in the literature cases of cloud adoption by companies and research institutions. One of the reasons is the possibility of acquiring resources in a dynamic and elastic way. In fact, elasticity is a key feature in the cloud computing context, and perhaps what distinguishes this computing paradigm from the other ones [8]. Even though elasticity is often associated with scalability, they are different concepts and should never be used interchangeably.
2.1. Cloud Computing 7
Elasticity is the degree to which a system is able to adapt to workload changes by provisioning and deprovisioning resources in an autonomic manner, such that at each point in time the available resources match the current demand as closely as possible.
This definition encompasses important characteristics. Firstly, it mentions “the degree” which suggests it should be measured. Secondly, it mentions the need of adaption when the load varies and then that resources can be allocated or deallocated. Besides, the adaption must be performed in an autonomic way. Finally, it states that resources match the demand being as closely as possible, i.e. allocating when needed, but trying to save resources when possible.
In cloud systems, where resources are usually managed in an autonomous way, the control and the actions related to resource management are taken in such a way to satisfy the SLA. On one hand, if SLA is not met, the system may have provisioned less resources than necessary and, consequently, the system component responsible for adding resources is not acting according to the demand. If the SLA is not being satisfied, the system mechanism responsible for monitoring and taking decisions is not well tuned to act and add machines when necessary. Therefore, the system is not being elastic and we can establish a correspondence between satisfying the SLA and system elasticity. On the other hand, if that component is providing more resources than needed, SLA is being satisfied, but the provider may be spending more resources and, consequently more money, than necessary. In this scenario resources are not as closely as possible to the demand, implying the system is not being elastic. If the provider defines a lower bound of such a metric, like number of machines, CPU usage, query response time or any other, it can help it on determining how much resource is being wasted. This bound may be defined in the SLA, but it would not generate any penalty neither for the provider nor for the consumer, if the measurements are below the lower bound.
2.2. Databases on Cloud 8
2.2 DATABASES ON CLOUD
Since most cloud applications are data-driven, database management systems (DBMSs) powering these applications are critical components in the cloud software stack [1]. Data-intensive applications can be classified, in general, into two groups: Online Transaction Processing (OLTP) and Online Analytical Processing (OLAP). OLTP systems are char-acterized by a large number of short transactions that can update or retrieve data. Since in OLTP systems, the database is usually accessed by concurrent users that can be both updating or reading data, to maintain the data consistency of these kinds systems is a critical factor to be treated. OLAP systems aim to work with data consolidation and data analysis, typically relaxing normalization of the modeling, performing much more read than update operations and they are usually accessed by a very few number of users. As far as cloud is concerned, some works focus on OLTP databases [7] [4] in cloud platforms, while other present analysis of OLAP databases [13] [14] in such platforms.
Stateful systems, such as DBMSs, are hard to scale elastically because of the requirement of maintaining consistency of the database that they manage [5]. However, cloud database systems must provide elasticity otherwise data-driven applications would miss some benefits that cloud computing can provide to them. Even though the adopted definition of elasticity is not focused on database-system elasticity, it can be applied if we assume that “resources” are data nodes and “workload changes” are changes on the number of queries sent to a database system.
2.2.1 Service-Level Agreements (SLAs)
Many companies expect cloud database providers to guarantee quality of service using SLAs [15]. Cloud computing contracts agreed between customers and providers are usu-ally adherent to an SLA. SLA defines the terms that must be satisfied by the provider and it works as a guarantee for the consumer. SLAs are usually based on one or more metrics that can be understood both for consumer and provider. In general, cloud providers base their SLAs only on the availability of services. Amazon EC2, for instance, has an SLA based on availability, in which it is guaranteed an uptime of at least 99.95%. If this SLA is not satisfied, Amazon generates a service credit of 10% or 30%, depending on if the uptime was between 99.95% and 99.00% or if it was less than 99.0%, respectively.
2.2. Databases on Cloud 9
deal with data management aspects, such as [16] and [17]. However, as far as we know, there are no providers of public clouds that base their SLAs on response times or elasticity metrics of databases, for instance.
2.2.2 Relational Databases and Distributed Databases
The reason for the proliferation of DBMSs in the cloud computing space is due to the success DBMSs, particularly relational systems, have had in modeling a wide variety of applications. The key ingredients to this success are the many features DBMSs offer: overall functionality (modeling diverse types of application using the relational model which is intuitive and relatively simple), consistency (dealing with concurrent workloads without worrying about data becoming out-of-sync), performance (both high-throughput, low-latency and more than 25 years of engineering), and reliability (ensuring safety and persistence of data in the presence of different types of failures) [18]. However, in spite of RDBMS success, such systems are not easy to scale due to the requirement of main-taining consistency of the database that they manage [5]. Moreover, traditional database management systems are designed, in general, for statically provisioned infrastructures.
This difficult of scaling RDBMS is probably the main reason that motivated the development of other systems which do not provide everything that relational systems provide, but that are easier to scale. Since scalability can be the most important require-ment for many applications, such applications may give up some features of relational systems in order to have a better performance. For instance, ensuring atomicity and consistency of data entities may be a responsibility of applications to make data systems more scalable. Even though there is a remarkable number of works guiding research on cloud to alternatives for RDBMS, one can say that changing some strategies can make RDBMS as elastic as NoSQL systems [19].
2.2. Databases on Cloud 10
hold locks across those servers. While this is costly even if the servers are collocated, it is more costly if the servers are in different datacenters. When data is replicated, every-thing becomes even more complex because it is necessary to ensure that the surviving nodes in a failure scenario can determine the actions of both completed and incomplete transactions. In addition to the added costs incurred during normal execution, these measures can force a block during failures that involve network partitions, compromising availability, as the CAP theorem [21] describes.
The notions of consistency proposed in the distributed systems literature focus on a single object and are client-centric definitions. Strong consistency means that once a write request returns successfully to the client, all subsequent reads of the object, by any client, see the effect of the write, regardless of replication, failures, partitions, and so on. The term weak consistency describes any alternative that does not guarantee strong consistency for changes to individual objects. An example of weak consistency is eventual consistency. For eventual consistency, the guarantee offered is that every update is eventually applied to all copies, but there is no guarantee regarding to in which order the updates will be applied and when they will be applied.
2.2.3 NoSQL Databases
For decades, RDBMSs have been considered as the one-size-fits-all solution for providing data persistence and retrieval. However, the ever increasing need for scalability and new application requirements have created new challenges for traditional RDBMSs. Therefore, recently, a new generation of low-cost, high-performance database software that challenges the dominance of relational database management systems has emerged. These novel systems are commonly called NoSQL, for Not only SQL, systems.
As opposed to ACID transactions of RDBMS, NoSQL DBMSs follow the CAP theorem and thus their transactions conform to the BASE (Basically, Available, Soft state, Eventually consistent) principle [22]. According to the CAP theorem, a distributed database system can only choose at most two out of three properties: Consistency, Avail-ability and tolerance to Partitions. Therefore, most of ACID transaction systems decide to compromise the strict consistency requirement. In particular, they apply a relaxed consistency policy called eventual consistency.
2.2. Databases on Cloud 11
by Amazon, have inspired the development of other novel systems, like MongoDB [24], HBase [25] and Cassandra [26]. We present more details about Cassandra in this chapter, since we used it in our experiments.
Although some novel database systems are said to be elastic they do not provide mechanisms to automatically monitor the environment and take decisions on adding or removing resources, based on one or more metrics monitored, like CPU usage, memory usage, throughput, response time, and so on. Therefore, we have to add other components apart from a database system to have a more complete system that we call cloud database system, as illustrated on Figure 2.1. This system is composed of (i) an Instance Manager, (ii) a Database Manager and (iii) a pool of instances (virtual machines) that are running or available to be started. The Instance Manager, composed of a Monitor and a Decision Taker, is responsible for monitoring the pool gathering statistics, as well as for taking decision on starting or on stopping instances of the pool. The Database Manager is the access point to where queries are sent. Depending on the DBMS under test, there is no central node to receive queries and distribute. In such systems, queries are sent all over the pool and the Database Manager is a regular instance. The pool of instances is only a set of pre-configured instances that can be started or stopped by the Instance Manager. From now on, every time we mention we are benchmarking a database system, we are refering to this cloud database system just defined.
Figure 2.1: Cloud Database System
Cassandra
Cassan-2.2. Databases on Cloud 12
dra does not demand you to model all of the columns required by your application up front, as each row is not required to have the same set of columns. A Cassandra instance is a collection of independent nodes that are configured together into a cluster, where all nodes are peers, meaning there is no master node or centralized management process. A node joins a Cassandra cluster based on its configuration. This section explains key aspects of the Cassandra cluster architecture.
Cassandra uses a protocol called gossip to discover location and state information about the other nodes participating in a Cassandra cluster [27]. The gossip process runs on every second and exchanges state messages with up to three other nodes in the cluster. The nodes exchange information about themselves and about the other nodes that they have gossiped about, so all nodes quickly learn about all other nodes in the cluster. When a node first starts up, it looks at its configuration file to determine the name of the Cassandra cluster it belongs to and which nodes, called seeds, to contact to obtain information about the other nodes in the cluster. Each node owns a data range. To know what range of data it is responsible for, a node must also know its own token, that is a hash, and those of the other nodes in the cluster.
In Cassandra, the total amount of data managed by the cluster is represented as a ring, with range from 0 to 2217−1, assuming the default partitioner, i.e.
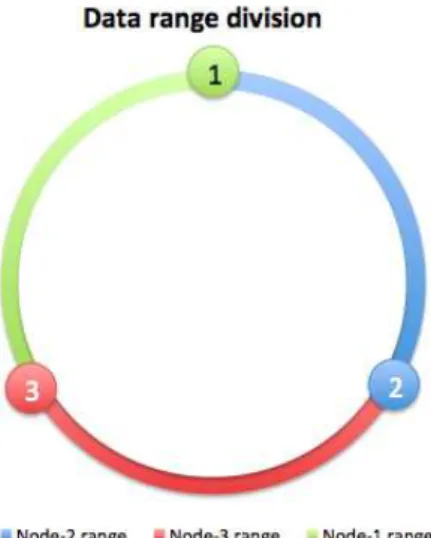
RandomPar-titioner. A partitioner is a hash function for computing the token of a row key. Each row of data is uniquely identified by a row key and distributed across the cluster by the value of the token. In versions 1.1.x, the ring is divided into contiguous ranges equal to the number of nodes, as illustrated on Figure 2.2 and on Table 2.1 for a 3-node cluster. In this example, the first node, whose token is 0, has its range from 23 ∗2217) + 1 to
0. The token value is always equal to the end hash value of the range. The start hash value is always the value of the end hash value for the subsequent range added by 1. For instance, the start hash value of node 2 is the end hash value of node 1 plus 1, i.e. 0 + 1 = 1, as shown on Table 2.1 and graphically represented on Figure 2.2. For versions 1.2.x it is possible to use virtual nodes, or simply vnodes, feature that creates multiple ranges (256, by default, but configurable vianum tokensproperty on cassandra.yml) and evenly divides data through the nodes. This feature avoids the need of move operations to redefine tokens of existing nodes, which is required when a node joins or leaves the cluster. In addition, vnodes minimizes the time to recover the cluster when a node dies completely. Virtual nodes also present other advantages [28] [29].
2.2. Databases on Cloud 13
Figure 2.2: Data range division for a 3-node cluster
Node Token Start hash value End hash value
1 0 (2
3 ∗2
217) + 1 0
2 1
3 ∗2
217 1 (1
3 ∗2 217)
3 2
3 ∗2
217 (1 3 ∗2
217) + 1 (2 3 ∗2
217)
Table 2.1: Tokens and range of hash values for a 3-node cluster
a client connects to a node and issues a read or write request, that node serves as the coordinator for that particular client operation. The job of the coordinator is to act as a proxy between the client application and the nodes that own the data being requested. The coordinator determines which nodes in the ring should get the request based on the cluster configured partitioner and replica placement strategy.
In Cassandra, consistency refers to how up-to-date and synchronized a row of data is on all of its replicas. Cassandra extends the concept of eventual consistency by offering tunable consistency. For any given read or write operation, the client application decides how consistent the requested data should be. For write requests, the consistency level specifies on how many replicas the write must succeed before returning an acknowl-edgement to the client application. For read request, the consistency level specifies how many replicas must respond before a result is returned to the client application.
2.3. Benchmark Tools 14
successful once data is written to the commit log and memory, so there is very minimal disk I/O at the time of write. Writes are batched in memory and periodically written to disk to a persistent table structure called an SSTable (sorted string table). SSTables files are not changed after they are written. Thus, a row is typically stored across mul-tiple SSTable files. This strategy has a drawback for read requests, since a row may be combined from more than one SSTable, but an in-memory structure called Bloom filter is aimed to optimized these types of requests. Periodically, Cassandra merges SSTables into larger SSTables in a process called compaction. On one hand, compaction impacts negatively on read requests since during this process there is a temporary spike on disk space usage and disk I/O. On the other hand, after the process is finished, read requests performance is improved since there are less SSTables to be checked before completing a read request.
According to our adopted definition of elasticity, Cassandra cannot be consid-ered an elastic database, since it it not able to adapt itself depending on the workload fluctuation. However, if we add a mechanism to monitor Cassandra instances and to take decisions to add or remove instances, Cassandra can work in an autonomic way to distribute data among the nodes and to eventually maintain the consistency. Therefore, Cassandra can be a good alternative for cloud applications that need scalability and high availability without compromising performance. To the best of our knowledge, there is no all-in-one database system that is able to manage its own instances, by monitoring them and by taking decisions of changing the resources according to the load variation.
2.3 BENCHMARK TOOLS
Traditionally, the goal of benchmarking a software system is to evaluate its performance under a particular workload for a fixed configuration and to help on tuning a system. The most prominent examples for evaluating transactional database systems as well as other components on top, such as a application-servers or web-servers, are the various TPC benchmarks. All TPC-family benchmarks test environments with fixed configuration. In addition, TPC-benchmarks focus on transactional database systems that provide ACID properties.
dif-2.3. Benchmark Tools 15
ferent data models, sacrifice strong consistency for availability and offer only some weaker forms of consistency. Thus, benchmark tools for cloud database systems should consider specificities of cloud computing and of new database systems available. Particularly, pro-viding a way to vary the load to stress the system and then force it to add resources must receive attention. With such feature to vary load, benchmark tools can start thinking on how to measure elasticity. Unlike measuring efficiency, response time or throughput, to measure elasticity it is important to keep in mind that workloads must be carefully selected so that the system can be stressed. Comparing two cloud data systems with the same workload is fair only if two systems are equally or approximately stressed by the selected workload [11].
SLA plays an important role on cloud computing, since it establishes the rules between consumer and provider to guarantee quality of service. Although its importance is accepted by most works, benchmark tools usually do not consider SLA to state whether a cloud database system satisfies or not the SLA. As aforementioned, a relation can be established between poor elasticity and to dissatisfy an SLA. Therefore, benchmark tools should also match workload results with how much they are meeting the SLA.
Some tools have tried to address some specificities of benchmarking cloud database systems. The most referenced is YCSB [7], but OLTP-bench [30] also presents interesting features, although it is not properly a single benchmark.
2.3.1 YCSB
YCSB [7] framework consists of a workload generating client and a package of pre-configured Core workloads that cover interesting parts of the performance space, such as read-heavy workloads, write-heavy workloads and scan workloads. An important aspect of YCSB framework is its extensibility: the workload generator makes it easy to define new workload types, and it is also straightforward to adapt the client to benchmark new data serving systems.
2.3. Benchmark Tools 16
operation types are: read, insert, update, delete, scan.
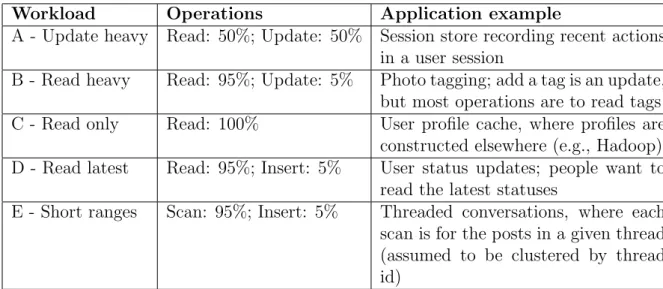
Core workload A, for instance, defines that the queries performed during work-load must be evenly balanced between read and update operations, i.e. 50% for each. Such workload characterizes an update-heavy application, since in most applications the number of reads is higher than the number of writes. An example of heavy-update appli-cation is a Web site that records what a user does during his session. In this appliappli-cation, on one hand, the system updates frequently the recent actions of a user, but on the other hand, these actions usually require reading records from a database.
Workload Operations Application example
A - Update heavy Read: 50%; Update: 50% Session store recording recent actions in a user session
B - Read heavy Read: 95%; Update: 5% Photo tagging; add a tag is an update, but most operations are to read tags C - Read only Read: 100% User profile cache, where profiles are
constructed elsewhere (e.g., Hadoop) D - Read latest Read: 95%; Insert: 5% User status updates; people want to
read the latest statuses
E - Short ranges Scan: 95%; Insert: 5% Threaded conversations, where each scan is for the posts in a given thread (assumed to be clustered by thread id)
Table 2.2: Core workloads that come with YCSB by default
YCSB architecture is designed in such a way it provides an abstraction layer for adapting to the API of a specific table store. To add support for new database systems few methods must be implemented, creating what is called a DB Binding. At the moment this work was written, there were fourteen DB Bindings, including bindings for well-known systems like Cassandra, HBase [25] and MongoDB [24].
While executing a workload, YCSB gathers performance metrics in order to pro-vide, by the end of the execution, statistics about the results. YCSB also allows to choose between time series or histogram representation of the results, reporting also 95th
and 99th percentiles, average, maximum and minimum response times by operation type.
2.4. Related Work 17
2.3.2 OLTP-bench
OLTP-Bench project is a “batteries-included” benchmarking infrastructure designed for and tested on several relational DBMSs and cloud-based database-as-a-service (DBaaS) offerings. OLTP-Bench is capable of controlling transaction rate, mixture, and work-load skew dynamically during the execution of an experiment, thus allowing the user to simulate a multitude of practical scenarios that are typically hard to test, for example, time-evolving access skew. Moreover, the infrastructure provides an easy way to monitor performance and resource consumption of the database system under test.
OLTP-Bench includes a set of known benchmarks, like TPC-C, Wikipedia, Re-sourceStresser and YCSB, in a standardized way to provide a similar configuration input file for each one and to gather comparable results.
2.4 RELATED WORK
Benchmarking databases systems is always related to performing experiments and gath-ering metrics. Measuring performance is one of the main purposes of benchmarking database systems. Usually, performance of such systems is measured by query response time or throughput. Considering these metrics, systems that respond to query request in less time perform better. Systems that execute more operations by second, i.e. have a higher throughput, perform better. Besides, it can be measured also the scalability of system in order to identify if the system scales linearly, for instance, as the number of resources increases linearly. These metrics are important and will be kept useful while database systems last. However, these metrics are not enough to measure the elastic char-acteristic of cloud database systems. Therefore, it becomes necessary to define models to represent elasticity of systems and metrics to measure it.
2.4.1 Elasticity Metrics
2.4. Related Work 18
is different or not of elasticity. [32] provides metrics inspired on elasticity definition from physics, but focus on network bandwidths instead of database-specific aspects and does not use real data in their experiments.
Some authors [33] [34] discuss elasticity but do not propose metrics to com-pare their results with other works. [34] presents improvements when comcom-pared to [35] but the presented analysis only compare the results plotted in charts. No common in-dicator is used to analytically measure the results and to compare elasticity of cloud database systems. [12] proposes ways to quantify the elasticity concept in a cloud. They define a measure that reflects the financial penalty to be paid to a consumer, due to under-provisioning, by leading to unacceptable latency or throughput, or due to over-provisioning, by paying more than necessary for the resources. Nevertheless, it does not take into account DBMSs features such as query response time or throughput to cal-culate the metrics. It uses only a resource-oriented approach to calcal-culate the metrics. [33] provides definitions of elasticity for database systems and a methodology to evalu-ate the elasticity. However, these definitions deal only with under-provisioning scenarios and do not address issues of SLA, penalties, and resources. In addition, the authors do not explain clearly how they calculate the metrics presenting arguments to support their decisions.
[36] presents a cloud-enabled framework for adaptive monitoring of NoSQL sys-tems and it performs some experiments with YCSB for few NoSQL syssys-tems trying to vary the load by manually adding new YCSB instances. However, they do not provide metrics for elasticity, do not deal with situations of where there are more resources than necessary and present a cumbersome way to vary the load during workload execution. [7] presents the metrics named elastic speedup and scaleup. The first metric illustrates the latency variation as new machines are instantiated. The second one is a traditional metric and does not encompass elasticity aspects. Even though these metrics can be useful, they do not illustrate the consumer perspective and do not consider the variation of clients accessing an application.
2.4.2 Benchmarking Cloud Database Systems
2.4. Related Work 19
provide a way to vary number of clients during workload execution. Thus, we believe that, without changing the workload, is not possible to measure how elastic a system is, since workload is nearly constant from the beginning to the end of the YCSB benchmark process.
[38] extends YCSB to support complex features such as including multi-tester co-ordination for increased load and eventual consistency measurement, multi-phase work-loads to quantify the consequences of work deferment and the benefits of anticipatory configuration optimization such as B-tree pre-splitting or bulk loading. However, [38] does not provide a workload variation to stress and relax a system to measure its elastic-ity.
OLTP-Bench [30] presents an improvement on elasticity measurement since it allows to vary the load by varying operations/second by client. However, OLTP-Bench number of clients is fixed, what does not represent a more realistic scenario. In addition, OLTP-Bench does not calculate any elasticity metric.
In [34] the variation of load is made by removing one of the workloads being executed. However, this does not represent a regular behavior of a web application, for instance, since it is not very common to have many clients leaving an application at the same time. [39] proposes a framework that intercepts queries from application and then forward them to database layer, gathering information about the query executions. This kind of additional layer may include overheads that are hard to be measured, since no query is directly sent to the database layer. In addition, experiments show only addition of resources when a threshold is reached. Removing resources is not illustrated and analyzed. [11] clearly presents the difference of measuring elasticity, scalability and efficiency. In addition, [11] presents elasticity metrics for cloud computing and what a benchmarking for elasticity should consider. However, the elasticity metrics are focused only on the resources allocated and the expected resources, they are not aimed for database systems, and, finally, the development of the benchmark tool itself is not part of the work and details about the implementation are not presented.
CHAPTER 3
ELASTICITY METRICS
According to the definition adopted in this work, elasticity is “the degree to which a system is able to adapt to workload changes by provisioning and deprovisioning resources in an autonomic manner, such that at each point in time the available resources match the current demand as closely as possible”. Thus, it is essential to have a model to measure the mentioned degree. Since we could not find a model with metrics for elasticity that encompasses the guarantee of quality of service and that considers consumer and provider perspectives, we propose a model with a set of metrics before actually measuring elasticity of cloud data systems with BenchXtend.
Our approach to define metrics for elasticity uses a penalty model approach to measure imperfections in elasticity for database systems. Similarly to [12], our elasticity model is composed of two parts: penalty for over- and under-provisioning. Unlike [12], we explore database system features, like query response times, and present both the con-sumer and provider perspectives. [12] presents the importance of analyzing the concon-sumer point of view. [39] comments the dhicotomy of consumer and provider perspectives.
3.1. Consumer Perspective 21
of CPU utilization, or some other criteria. When a criterion is exceeded, the DBaaS might automatically add a new database instance to share the load. DBaaS may be seen as a specific kind of service delivered by a Platform-as-a-Service (PaaS) provider [41]. [42] suggests a solution for a DBaaS. Many players like Amazon, Oracle and Microsoft already provide solutions for DBaaS. SLA receives relevant importance in this case, since it must be defined in such a way the consumer has a suitable and understandable metric to evaluate the service quality, like query response time or throughput. [39] presents some challenges on defining SLAs properly.
We do not consider a Software-as-a-service (SaaS) scenario, because, in general, a SaaS consumer has no access or control to the database system when contracts a SaaS provider. Infrastructure-as-a-service (IaaS) scenario is not considered either because the SLA is usually based only on infrastructure resources, removing from the provider the responsibility of guaranteeing quality of any software service. Amazon EC2 is an example of IaaS provider and its SLA guarantees only availability.
3.1 CONSUMER PERSPECTIVE
Due to the large number of DBaaS providers and to the so-claimed buzzword elasticity, it is important for consumers to have a model to evaluate and compare elasticity of database systems. From a DBaaS-consumer perspective, a database system is elastic if, regardless the number of queries submitted to the system, the system makes adaptions on its resources, based on the demand, in order to satisfy the SLA. Even though most providers do not give guarantees of performance on database systems yet, defining an SLA based on response time for queries can attract new consumers, since an agreement based on that allows the consumers to assure the quality of a service for the end users of their applications.
3.1. Consumer Perspective 22
DBMSs, like replication or cache strategy are considered to be transparent for a DBaaS consumer. Thus, we propose metrics that abstract techniques like those. Even though we present the following metrics by operation type, the concept presented here can be applied to response times of transactions, specific queries or group of queries.
[7] presents a metric namedelastic speedupto measure the impact on performance as new servers are manually added, while the workload is running. They stated that a system that offers good elasticity should show a performance improvement when new servers are added, with a short or non-existent period of disruption while the system is reconfiguring itself to use the new server. Even though this metric can be useful from the provider perspective, from the consumer perspective it would be more important to have a metric that considers the increase and decrease of numbers of clients, instead of number of machines. As aforementioned, for a DBaaS consumer, it is transparent how many machines are needed to meet a response time defined in the SLA. Thus, considering a variation in the number of clients, a developer could benchmark his applications to check if non-functional requirements of scalability, for instance, are met. Furthermore, the addition of machines was made manually, while our adopted definition of elasticity considers an autonomic management. [7] also presents thescaleup metric. This is not an elastic metric, since does not consider the variation of resources while running a workload. According to this metric, a system has good scaleup properties if the performance remains constant as the number of servers, amount of data and throughput scale proportionally.
3.1.1 Under-provisioning Penalty (underprov)
3.1. Consumer Perspective 23
less violated queries, i.e. more queries satisfy the SLA.
We define this metric in equation (.) as the average of the ratio execution time
by expected time of those n queries whose response times are greater than the upper bound defined in the SLA and that are not discrepant values. We consider the fraction execution time by expected time in order to measure how far from the expected time, the execution time is. We argue that from an end-user point of view there are different perceptions of quality between violating the expected time by a very little amount of time and by a remarkable amout of time. In order to remove discrepant values, caused by timeout or instability peaks, for instance, we consider a percentile for under-provisioning. Values higher than the defined percentile are not considered by this metric calculation. By default, we consider 99th percentile for underprov metric, to have a more precise
metric.
Expected response time (expected) or SLA upper bound is defined by operation type in the SLA. This time represents the maximum time a query should take without disrespecting the SLA. The violated execution time (violatedet(i)) represents time spent
by a query i that did not meet the SLA and that is lower than the defined underprov
percentile.
underprov=
n X
i=1
violatedet(i)
expected
n (.)
The higher underprov is, the less elastic the database system is, because the system could not identify the need of adding more resources, could not quickly act to maintain acceptable response times and then more queries violated the SLA. violatedet(i)
expected
is always greater than 1, since it is applied only for violated queries, and measures the difference between defined and executed time.
In order to better understand on how to calculateunderprov, consider the follow-ing hypothetical response times, in µs: [400; 150; 180; 250; 120; 300; 130]. For a matter of simplicity, consider also that discrepant values were already removed, making use of percentiles. If we assume expected = 200µs, the response times that violate the SLA, i.e. that are greater than the expected response time (SLA upper bound), are [400; 250; 300]. For these three violated queries, the values of fractions violatedet(i)
expected are [2; 1,25; 1,5].
3.2. Provider Perspective 24
underprov=2 + 1,25 + 1,5
3 =1,5833
Apart from percentiles, we verified also other mathematical devices to identify discrepant values. One of them was interquartile analysis with outliers. Interquartile analysis identifies outliers in the data distribution by calculating the interquartile range (IQR) and defining upper and lower fences. Values are considered outliers if they are out of those fences. For instance, values are said to be extreme outliers if they are out of the range [Q1−3∗IQR, Q3 + 3∗IQR], where Q1 is the 1st quartile, Q3 is the 3rd quartile
and IQRis the difference Q3−Q1 [43]. Even though interquartile analysis seems to be a good solution to identify divergent values and that avoids the definition of magic numbers, like 99th percentile, this analysis may lead to unexpected behaviors. To illustrate these
behaviors, in some experiments, interquartile analysis classified more than 12% of data as outliers, which is a remarkable amount of data and that could lead us to remove data that are not discrepant and that could represent a peak of clients in the experiments. In addition, if the upper fence value is lower than the SLA upper bound, all response times greater than the upper fence would be removed, our metric would result 0 (zero) and it would be given a false impression of perfect elasticity, although there were queries that may not have satisfied the SLA.
3.2 PROVIDER PERSPECTIVE
From a customer perspective, we just presentedunderprovmetric. For a DBaaS provider, besides measuring that, it is also essential to evaluate how efficient the database system is to allocate only the minimum amount (or as closely as possible of the minimum amount) of resources to meet the SLA. Thus, from a provider perspective, our approach proposes
3.2. Provider Perspective 25
3.2.1 Over-provisioning Penalty (overprov)
When there is over-provisioning, the provider offers more resources than necessary to meet a demand. Thus, the provider is subject to an operating cost higher than the necessary to meet the SLA. In this situation, the database system has a number of resources that are running a given workload, but this amount may be higher than necessary. Unlike the penalty for under-provisioning, this metric does not make sense from a consumer perspective, since for a DBaaS consumer there is no problem to have more available resources if that does not imply in a cost increase.
overprov considers the execution time of queries performed when the database system is over-provisioned. We define this metric in equation (.) as the average of the
ratio lower bound time by execution time for those m queries that are considered over-provisioned. In this work, a query is said to be over-provisioned if its response time is less than the lower bound and it is greater than such a percentile. We call this percentile of
overprov percentile and the 1st percentile is the default one. Unlikeunderprov,overprov
moves theexpectedto the numerator since in an over-provisioning scenario the execution time is supposed to be lower than the expected one.
The query execution time (queryet) is the time spent by a query ithat is
consid-ered in the overprov calculation.
overprov=
m X
i=1
expected queryet(i)
m (.)
The higheroverprovis, the less elastic the database system is, because the system kept more resources than necessary to satisfy SLA. expected
queryet(i) is always greater than 1,
since query execution times are always lower than expected time in an overprovisioning scenario.
As exemplified forunderprov metric, to better understand overprov metric, con-sider the following hypothetical response times, inµs: [400; 150; 180; 250; 120; 300; 130]. For a matter of simplicity, consider also that discrepant values were already removed, making use of percentiles. If we assume expected = 140µs, the response times that vi-olate the SLA, i.e. that are lower than the expected response time (SLA lower bound), are [120; 130]. For these two violated queries, the values of fractions queryexpected
et(i) are [1,1667;
3.2. Provider Perspective 26
overprov=1,1667 + 1,0769
2 =1,1218
Figure 3.1 illustrates the five possible ranges in which queries can be placed depending on their response times. Acceptance range is the interval in which queries are included neither onunderprov nor onoverprov. In the example presented forunderprov
and overprov metrics, the values 150 and 180 are within the acceptable range, because they are between SLA upper and lower bounds. Underprovisioning range contains queries whose response times are lower than the defined percentile (by default, 99th) and greater
than the SLA upper bound for response times, defined on the SLA for such an operation type. Overprovisioning range contains queries whose response times are lower than the SLA lower bound and that are greater than the overprov percentile (1st, by default).
Queries that are placed in percentile areas are discarded both from underprovisioning and overprovisioning metrics.
Figure 3.1: Time ranges where each response time can be placed within
3.2.2 Elasticity for Database System (elasticitydb)
3.2. Provider Perspective 27
andoverprovvalues. We claim that different weights should be applied tounderprov and
overprovwhen combined in a single metric and a higher weight should be set tounderprov
when compared to overprov weight for one reason. The penalty due to over-provisioning affects only one of the parties, i.e. the provider. Penalties due to under-provisioning imply in a cost for the provider, who will have to pay to or to offset the consumer. Besides, for DBaaS consumers, the quality of service for their clients will be compromised when the service response takes longer than expected.
Lets assume for a moment thata is theunderprov weight andb is the respective
overprov one. In our context, it is not necessary to define exactly which values each weight assume. We need to know only how greater than b the a value is, i.e. what is the value of a/b. Thus, for a matter of simplicity, we can set overprov weight to 1 and rename the fraction a/b tox.
Figure 3.2: Metric values when adopted weighted arithmetic mean
Figure 3.3: Metric values when adopted weighted geometric mean
In order to provide a dimensionless metric, named elasticitydb, that combines
underprov and overprov metrics and that takes into account different weights for these metrics, we analyzed three weight functions: weighted arithmetic, geometric and har-monic means. To illustrate the fashion of each function, we fixedunderprovto 2,overprov
3.2. Provider Perspective 28
Figure 3.4: Metric values when adopted weighted harmonic mean
weighted arithmetic mean, weighted geometric mean and weighted harmonic mean, re-spectively. For the three kinds of weighted mean, the greaterxis, the closer tounderprov
theelasticitydbvalue is. We can notice thatelasticitydb values in geometric and harmonic
charts vary between a short range, when compared to arithmetic chart. Thus, for a mat-ter of simplicity on the calculation and to have a wider range of values to differentiate better elasticity of cloud database systems, we defineelasticitydbas a weighted arithmetic
mean of underprov and overprov, as shown on formula .. Numerical domain of x is
[1,∞).
elasticitydb=
x∗underprov+overprov
x+ 1 (.)
For instance, x weight could be defined based on costs. In this case, x could be defined by the cost of paying for underprovisioning penalties and overprov weight (set to 1) by the cost that could be saved if some resources had been released when environment was overprovisioned. Lower values of elasticitydb indicate more elastic cloud database
systems, since they make better use of resources while meeting the SLA. Our metric meets tests of reasonableness, such as (i) elasticity is non-negative and (ii) elasticity captures both over- and under-provisioning.
By definingunderprov,overprov and elasticitydb metrics, we have just proposed
CHAPTER 4
BENCHXTEND
We propose a benchmark tool called BenchXtend [6] which extends YCSB. YCSB was chosen among other possible benchmark tools mainly because it already has connectors for many NoSQL database systems as well as a JDBC driver can be user for relational systems, it is open source and it is designed in such a way that allows to extend it. This tool provides a way to change the number of clients while running a workload, as well as to calculate the metrics proposed in this work. Varying the load of a system is essential to properly evaluate its elasticity by stressing the system in such a way it can react to maitain quality of service. The load variation for database systems can be performed basically in two ways: (i) keeping the number of clients but changing the throughput by client, or (ii) changing the number of clients but keeping the throughput by client. YCSB does not implement any variation on the load, that means the expected throughtput by client and number of clients remain the same throughout the experiment. BenchXtend implements the change on number of clients both increasing and decreasing during workload execution, since this approach illustrates a more realistic scenario where users access and leave applications all the time.
Figure 4.1 presents the architecture of our solution. The Client Manager com-ponent controls the variation of clients. Metrics component is responsible for calculating
underprov, overprov and elasticitydb metrics after a workload execution. These metrics
are computed by operation type and according to some parameters passed as input. After executing all queries and calculating elasticity metrics, Exporter component outputs the query response times and metrics values.
30
Figure 4.1: BenchXtend architecture
second, as its name suggests, in a linear fashion from the initial to the subsequent entry. When selected Poisson function, the lambda (λ) parameter, that is equals to the variance of Poisson distribution, adopted is always the second value. For instance, if interpolating from 5 to 11,λchosen is 11. Even though we provide Linear and Poisson implementations, the architecture is designed to allow a user to implement his own distribution. Figure 4.2 shows the original timeline and figures 4.3 and 4.4 present examples of Linear and Poisson interpolations for the original timeline, respectively. In our experiments, we prefered to use linear interpolation to avoid abrupt increase or decrease on the number of clients.
4.1. Monitoring and Scaling In and Out 31
Figure 4.3: Timeline with Linear interpolation
Figure 4.4: Timeline with Poisson interpolation
4.1 MONITORING AND SCALING IN AND OUT
Our BenchXtend tool sends queries to a cloud database system (see Figure 2.1). Since our focus is not on how well or badly designed the cloud database system itself is, but on the benchmark tool, for a matter of simplicity, we implemented our own Instance Manager [44] in Ruby making use of Amazon EC2 API. Other authors [34] [35] propose some solutions to manage instances. [34] presents a systems that not only adds and removes nodes, but also reconfigures them in a heterogeneous manner according to the workload’s access patterns. [35] provides an implementation of a decision-making module as a Markov Decision Process, enabling optimal decision-making relative both to the desired policies as well as to changes in the environment the cluster operates under. Even though [34] and [35] seem to be good solutions for this purpose, they are not available to be deployed in Amazon EC2 environment and they would require additional research that is out of scope for this work. Figure 4.5 illustrates how BenchXtend and our Instance Manager act and how they interact with the cloud platform. Figure 4.5 represents the environment instantiated to evaluate our tool and our metrics. If we compare Figure 2.1 and Figure 4.5 we can notice there is no Database Manager in the later figure. This is due to the decentralized characteristic of the adopted database system, Cassandra. Instead of dedicating a node to a Database Manager, we use that node as a regular data node.
4.1. Monitoring and Scaling In and Out 32
Figure 4.5: Cloud database system instantiated for our experiments and BenchXtend
collects CPU usage from each running instance, via a SSH command, on every 5 seconds and saves it into a file. Decision Taker executes on every 60 seconds, that is time enough to have at least 10 new entries generated by the monitor, and then reads the last 10 entries of all files (one for each running machine). For each file, if 7 out of 10 entries exceed the maximum CPU usage threshold, that was set to 60%, we increment anadd machine
counter. After analyzing all files, if add machine ≥ machines running2 , we add a machine. Similarly, if 7 out of 10 entries are lower than the minimum CPU usage threshold, that was set to 20%, we increment the remove machine counter. If remove machine ≥
machines running
2 , we remove a machine. In both cases, machines runningis the number of
data instances running at that moment. The fraction machines running2 is used to define that only if at least half of the running machines are overloaded (or underloaded) the Instance Manager acts to adapt the nodes. This avoids that a sudden variations on only one or few (less than half) machines fire the action to add or remove an instance. For the number of running machines, we have lower (2 machines) and upper bounds (4 machines). If the Instance Manager decides to remove a machine and there are only 2 machines running, the removal process is then canceled and running machines remain the same. Similarly, if it is decided to add a new node but there are 4 machines running, the addition process is canceled. Upper and lower bounds of machines are necessary to deal with constraints of the experimental environment and they can be configured before starting the Instance Manager.